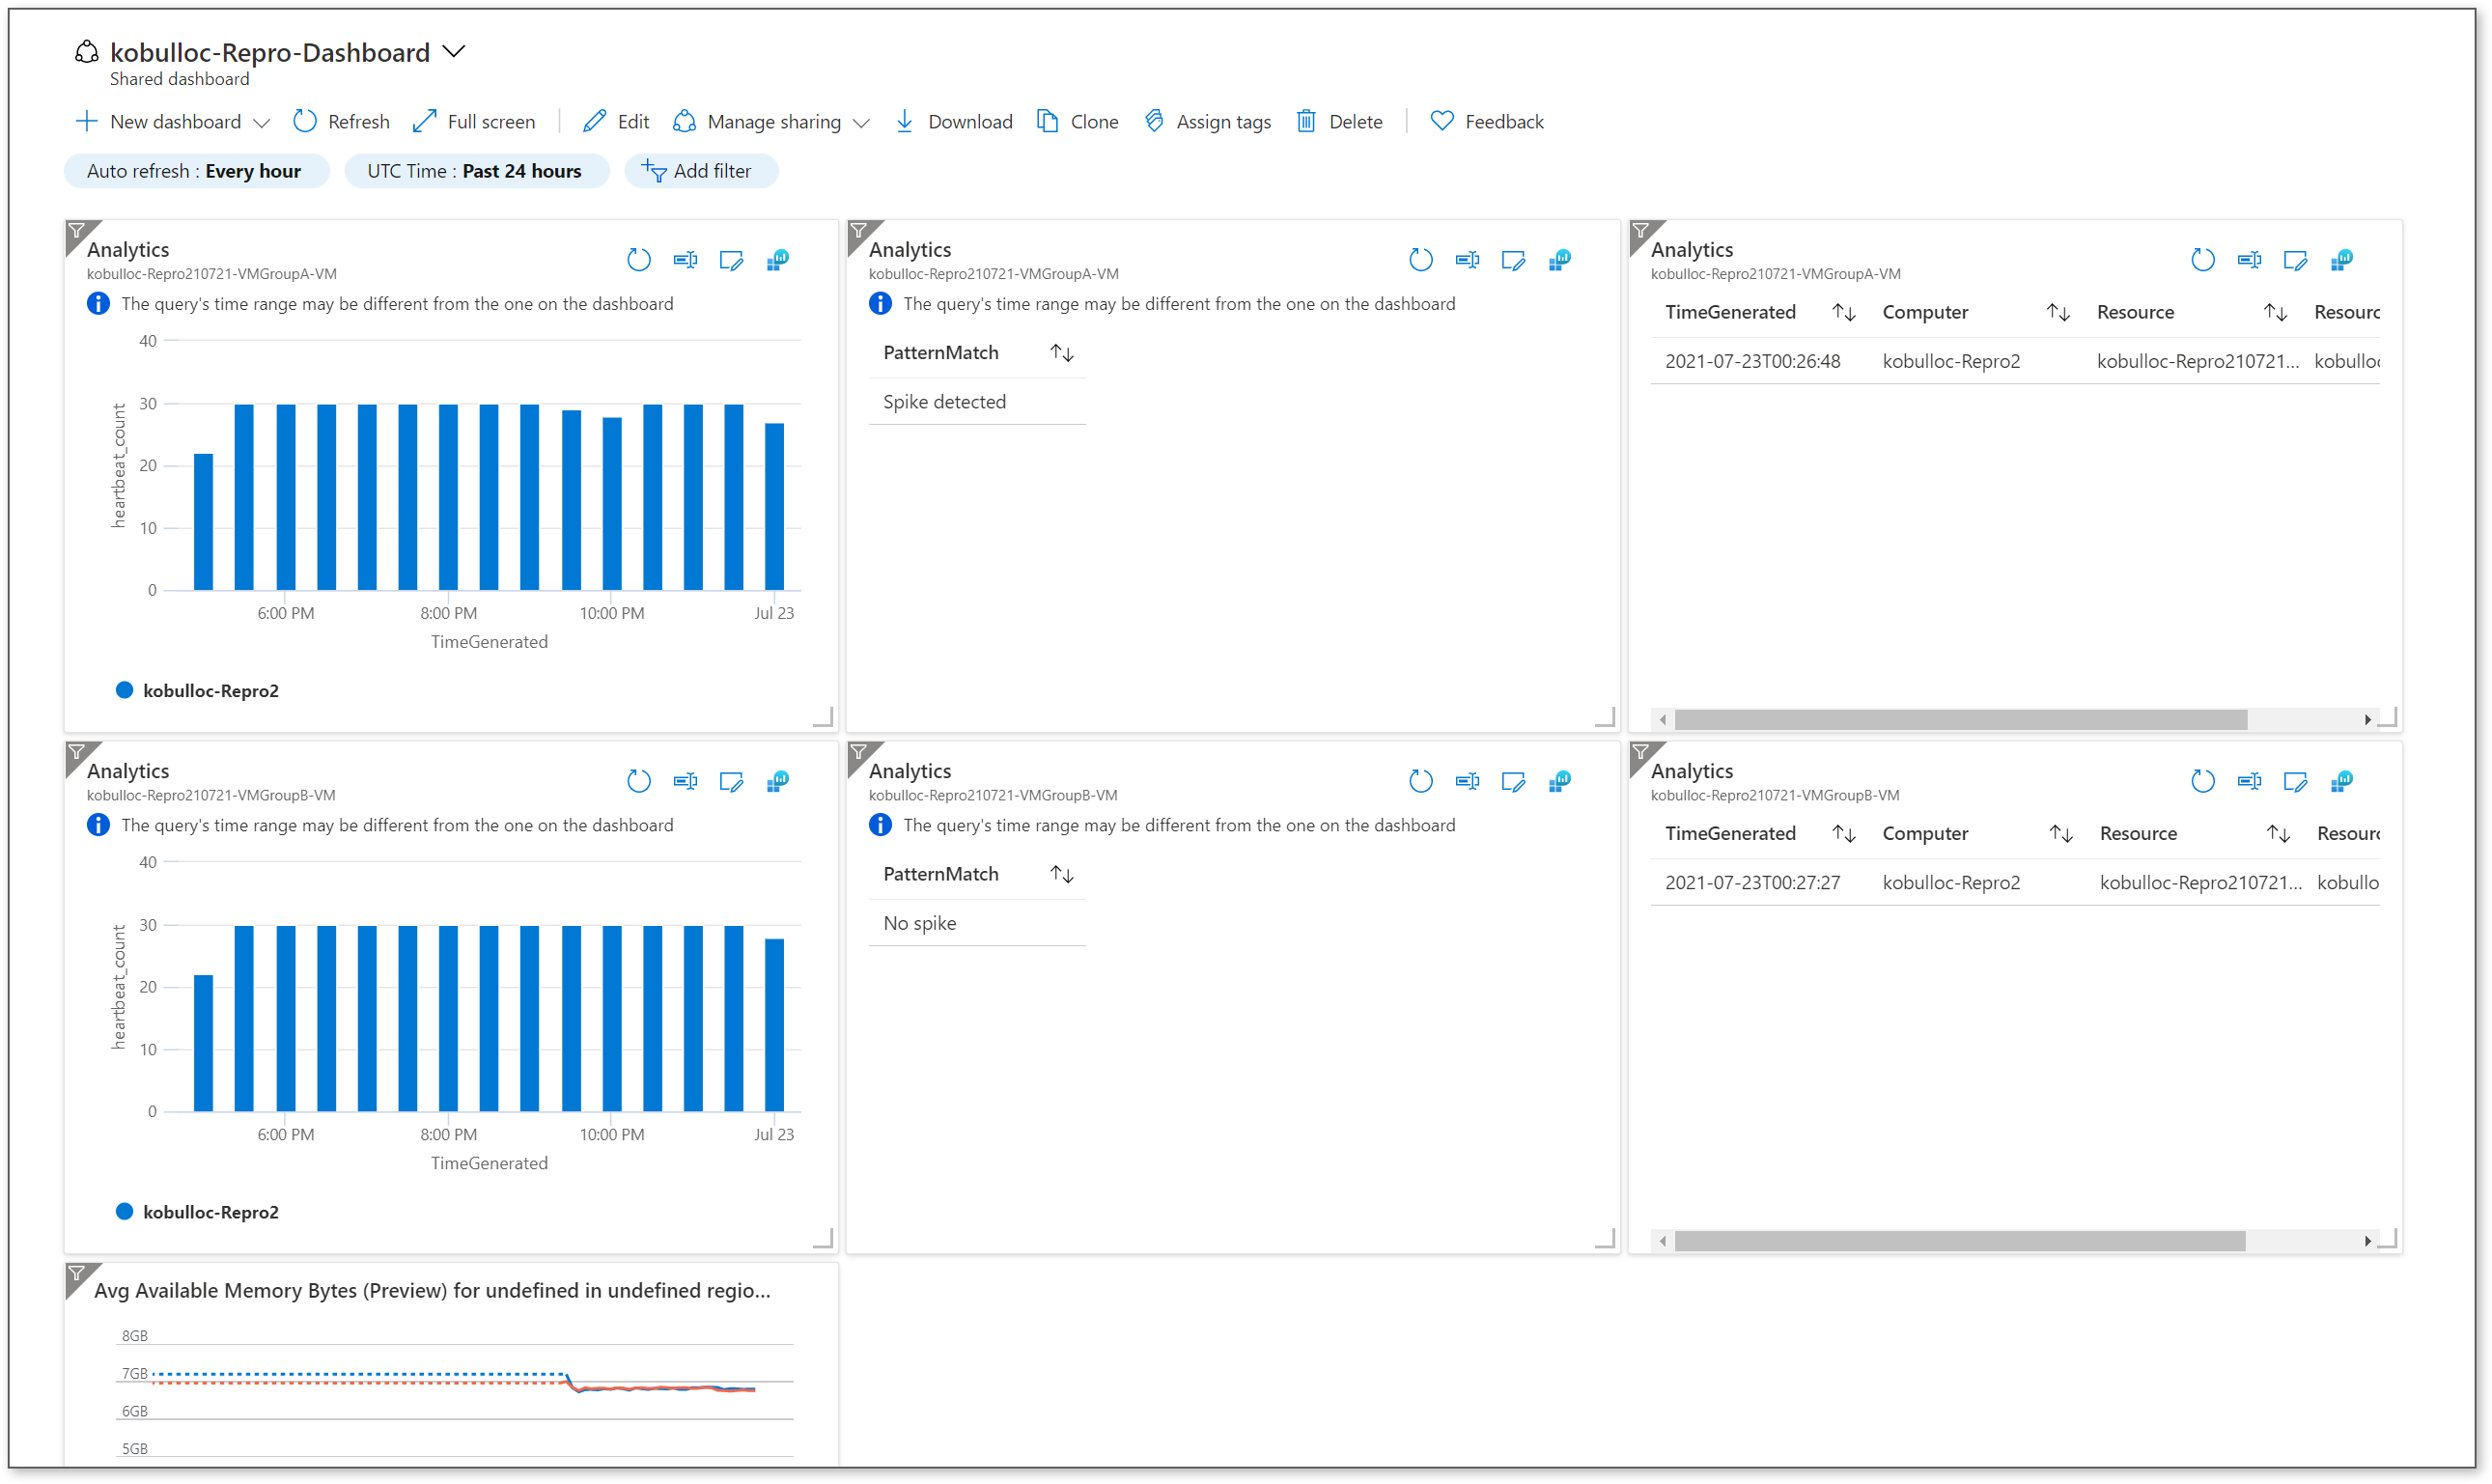
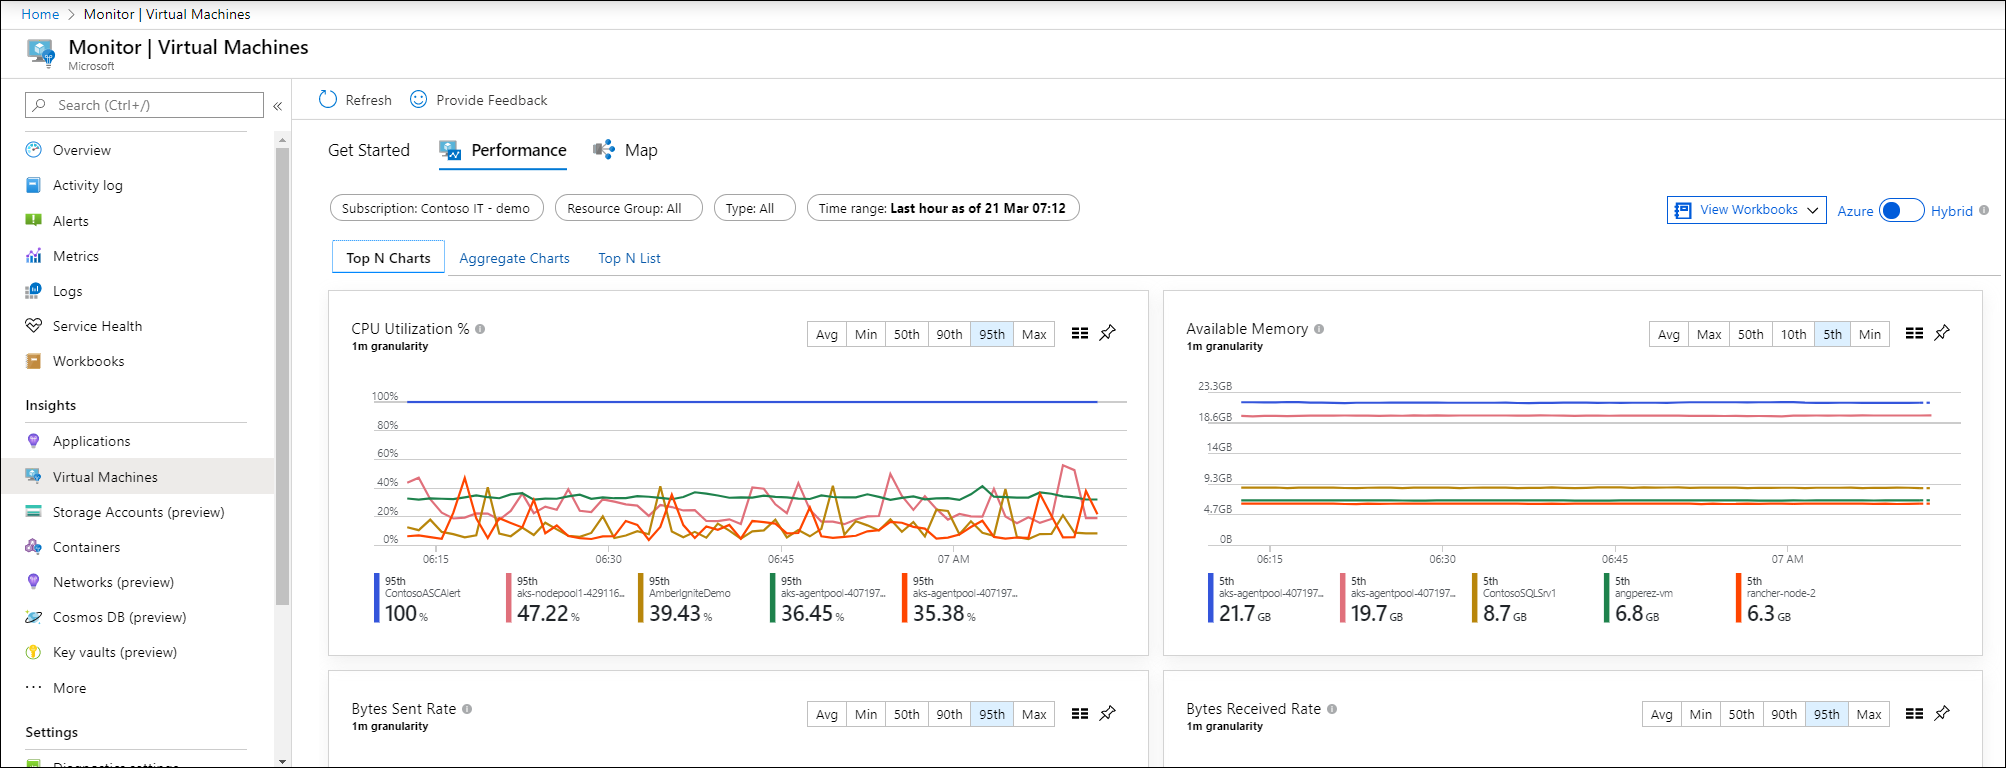
There are a lot of different ways to go about this (and going through the options would likely make for a good Azure Monitor question) but if we rule out VM Insights a Kusto query gives you the most control and options, especially if you are looking at multiple log analytic workspaces. There are three key steps to creating this dashboard:
Create a New Custom Dashboard
The documentation will walk you through the process of creating a custom dashboard here:
https://learn.microsoft.com/en-us/azure/azure-portal/azure-portal-dashboards
- Sign into the Azure Portal
- From the menu, select Dashboard
- Click on +New Dashboard > Blank dashboard
- Name the dashboard and click on Done customizing
Create Your Kusto Query
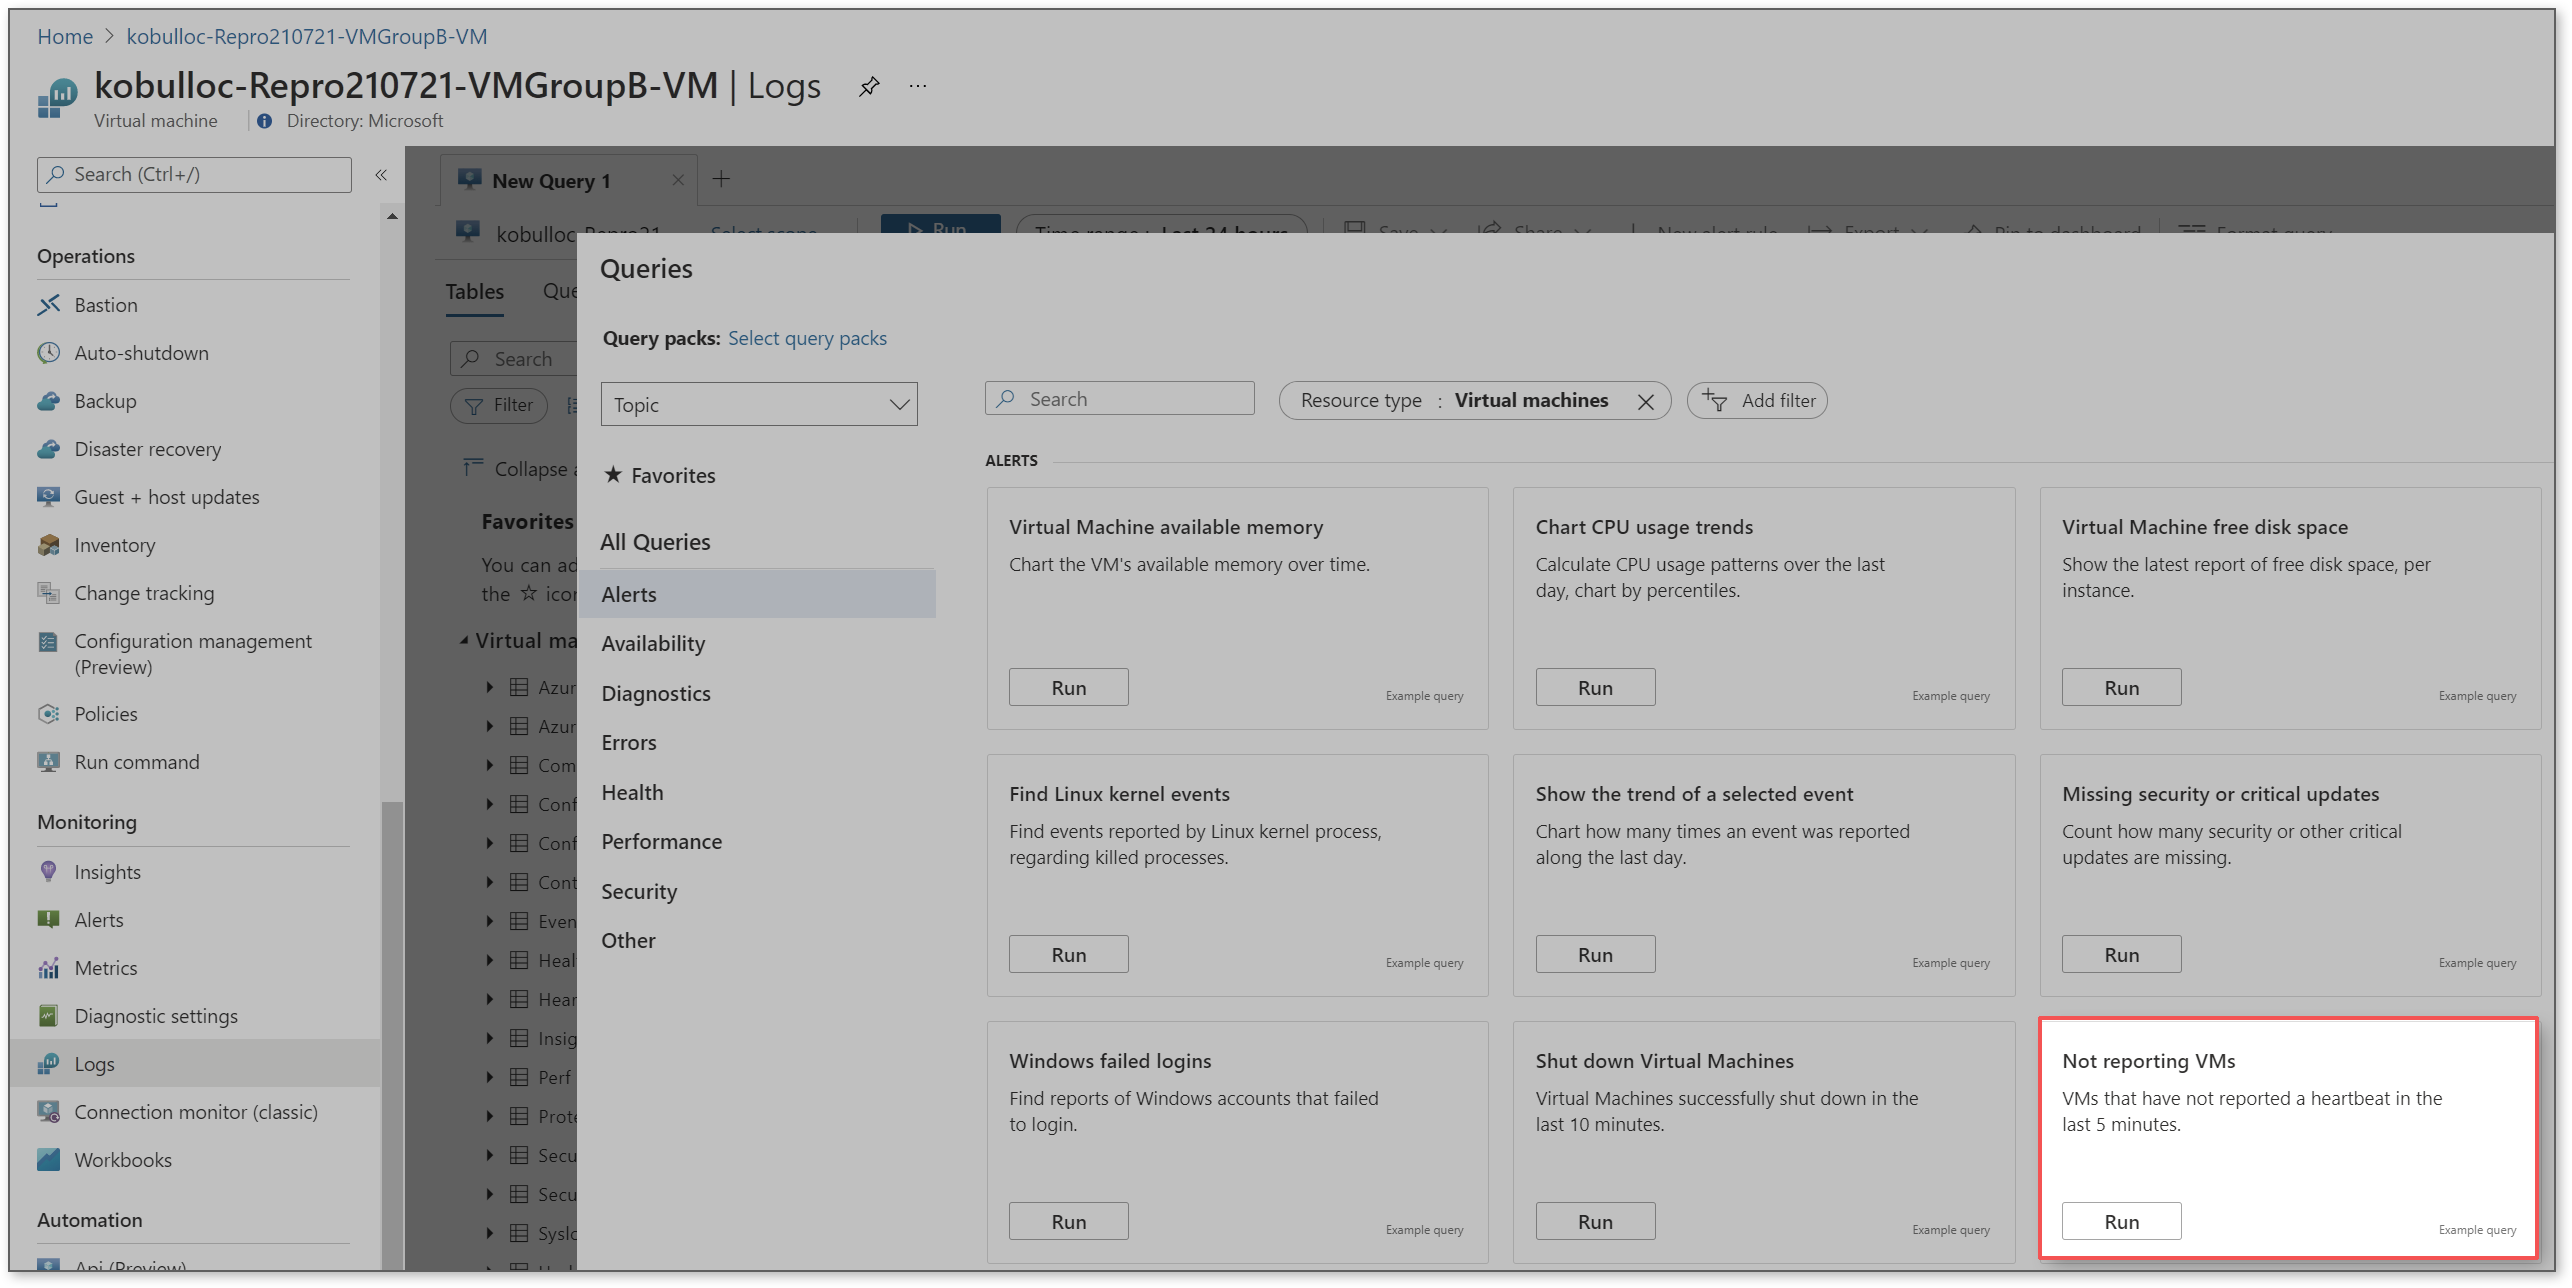
I suspect this is really the core of your question and there are a lot of possible options here so it depends on what you are after. In my example, I'm using 3 queries recommended by Monitoring > Logs on the VM resource page.
While you could leave this at just "Not Reporting VMs", there's some good information to be gained from "Last Heartbeat Status" and "Agent latency spikes - Heartbeat table". This is totally up to you, however, and there are a lot more queries you could add to this dashboard.

Not Reporting VMs
// Not reporting VMs
// VMs that have not reported a heartbeat in the last 5 minutes.
// To create an alert for this query, click '+ New alert rule'
Heartbeat
| where TimeGenerated > ago(24h)
| summarize LastCall = max(TimeGenerated) by Computer, _ResourceId
| where LastCall < ago(5m)
Last heartbeat of each computer
// Last heartbeat of each computer.
// Show the last heartbeat sent by each computer.
// Last heartbeat of each computer
// Show the last heartbeat sent by each computer.
Heartbeat
| summarize arg_max(TimeGenerated, *) by Computer
Agent latency spikes - Heartbeat table
// Agent latency spikes - Heartbeat table.
// Check for agent latency spikes in the ingestion of Heartbeats in the last 24 hours.
// Agent latency spikes - Heartbeat table
// Check for agent latency spikes in the ingestion of Heartbeats in the last 24 hour.
// This query calculates ingestion duration every 10 minutes, and looks for spikes
let StartTime = ago(24h);
let EndTime = now();
let MinRSquare = 0.9; // Tune the sensitivity of the detection sensor. Higher numbers make the detector more sensitive
Heartbeat
| where TimeGenerated between (StartTime .. EndTime)
// calculate ingestion duration in seconds
| extend AgentLatencySeconds = (_TimeReceived-TimeGenerated)/1s
// Create a time series
| make-series RatioSeries=avg(AgentLatencySeconds) default=0 on TimeGenerated in range(StartTime , EndTime,10m)
// Apply a 2-line regression to the time series
| extend (RSquare2, SplitIdx, Variance2, RVariance2, LineFit2) = series_fit_2lines(RatioSeries)
// Find out if our 2-line is trending up or down
|extend (Slope, Interception, RSquare, Variance, RVariance, LineFit) = series_fit_line(LineFit2)
// Check whether the line fit reaches the threshold, and if the spike represents an increase (rather than a decrease)
| project PatternMatch = iff(RSquare2 > MinRSquare and Slope>0, "Spike detected", "No spike")
To query across multiple resources/workspaces, you would use a union. For example:
https://learn.microsoft.com/en-us/azure/azure-monitor/logs/cross-workspace-query#performing-a-query-across-multiple-resources
union Update, workspace("contosoretail-it").Update, workspace("b459b4u5-912x-46d5-9cb1-p43069212nb4").Update
| where TimeGenerated >= ago(1h)
| where UpdateState == "Needed"
| summarize dcount(Computer) by Classification
Additional Kusto Query Examples:
Save and Pin the Kusto Query to Your Dashboard
After you have your query set, all that's left is to save and pin the query to your custom dashboard:
https://learn.microsoft.com/en-us/azure/azure-monitor/visualize/tutorial-logs-dashboards
Click on save, name the query, then Pin to dashboard.

Additional Reading:


