so im bit confused... if my servers are under memory pressure. Most of the time i see SQL Server transaction replication latency issue (which i think is more related to IO). I see lot of pagiolatch_sx and ex waits for the active sessions.
sql server memory check.
' cx='32' cy='32' r='32' /%3E%3Ctext x='50%25' y='55%25' dominant-baseline='middle' text-anchor='middle' fill='%23FFF' %3EH%3C/text%3E%3C/svg%3E)
Heisenberg
266
Reputation points
hi Folks,
im trying to see if any of my sql server is under memory pressure. Im getting quite a conflicting values from different parameters.
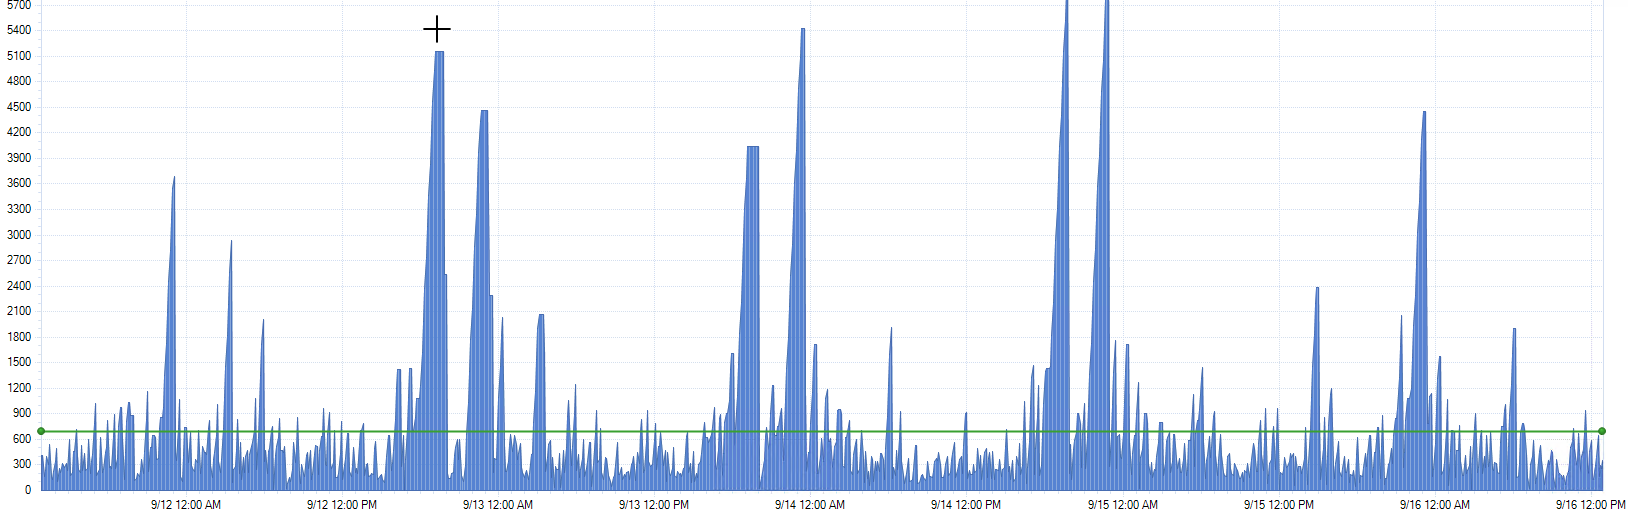
here is PLE status from idera for last 5 days. As per the image below . PLE is well below the baseline. Memory allocated to sql server is 230G.
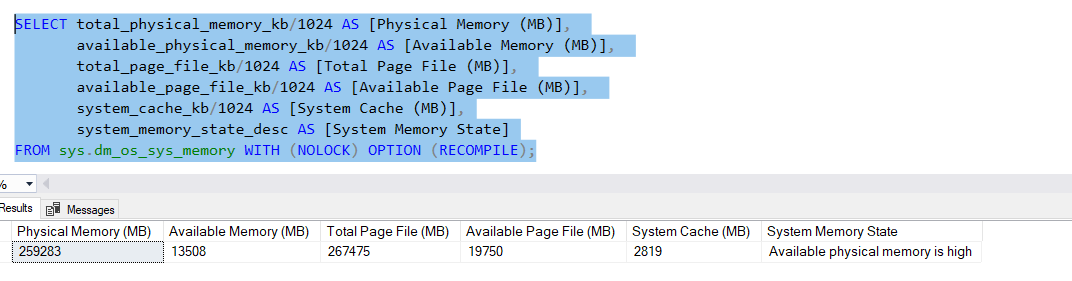
Below query shows me "available memory is high" which i think is good.
Buffer cache ratio is 90+
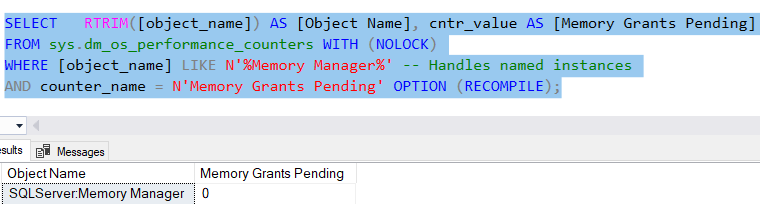
memory grants pending is 0
Following 2 values are 0 as well
![132871-image.png][5]
3: /api/attachments/132861-image.png?platform=QnA [5]: /api/attachments/132871-image.png?platform=QnA
SQL Server | Other
{count} votes
-
' cx='32' cy='32' r='32' /%3E%3Ctext x='50%25' y='55%25' dominant-baseline='middle' text-anchor='middle' fill='%23FFF' %3ESX%3C/text%3E%3C/svg%3E) Seeya Xi-MSFT 16,671 Reputation points
Seeya Xi-MSFT 16,671 Reputation points2021-09-22T06:19:44.13+00:00 Hi @SQLServerBro ,
We have not received a response from you. Did the reply could help you? If the response helped, do "Accept Answer". If it doesn't work, please let us know the progress. By doing so, it will benefit all community members who are having this similar issue. Your contribution is highly appreciated.
Best regards,
Seeya
Sign in to comment
4 answers
Sort by: Most helpful
-
-
Heisenberg 266 Reputation points
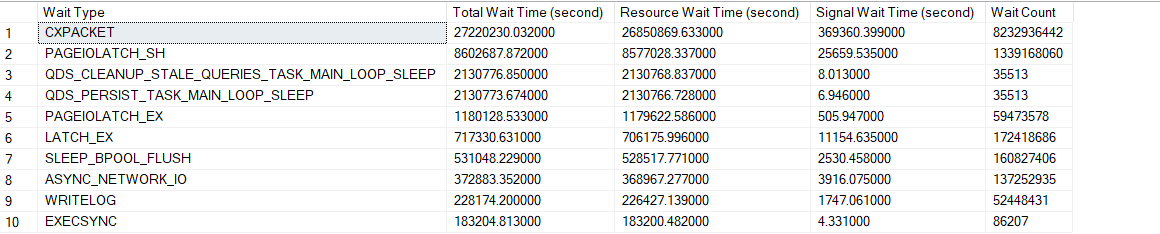
2021-09-16T20:09:59.37+00:00 here are my top waits from dm_os_wait_stats.
-
 Erland Sommarskog 128.7K Reputation points MVP Volunteer Moderator
2021-09-16T21:54:37.817+00:00 Nothing there that indicates memory pressure, but to make use of wait stats, you need to do two things:
1) Find Glenn Berry's query for wait stats where he filters out benign wait types.
2) Sample the wait stats on two or more occasions during the working day and compute the deltas. Right now you have everything since the server started, and you may not care what happens during the wee hours at night.
Sign in to comment -
-
Seeya Xi-MSFT 16,671 Reputation points
2021-09-17T07:46:59.787+00:00 Hi @SQLServerBro,
According to your description, your PAGEIOLATCH_SH and PAGEIOLATCH_EX wait types are many, which can reflect performance.
PAGEIOLATCH_EX
Occurs when a task is waiting on a latch for a buffer that is in an I/O request. The latch request is in Exclusive mode. Long waits may indicate problems with the disk subsystem.
How To Troubleshoot :- PAGEIOLATCH_EX and PAGEIOLATCH_SH are often reported as high – if so, disk io subsystem will be your first target
- The disk spin rate should not be the focus – but rather the workload. Therefore , for testing – run the workload and monitor disks
- It’s not just slow IO subsystems relative to workload but also overworked IO subsystems that can be the cause.
- General database tuning can help – but a single transaction is defined by : amount\speed of disks , memory amount availability , processor speed.
- Index management
- Differentiate between disk issues and memory issues – after all ,if memory is experiencing pressure – than dealing with incoming data will be slower
- Logical drive profiles – separating random file access with sequential files
PAGEIOLATCH_SH
This wait type accumulates while SQL Server is waiting for a page to be retrieved from disk and loaded into memory. The page collected will be used for a shared purpose (read operation). If this value is high it is likely disk or memory available are not keeping up with the workload
Possible solutions:- Add additional memory
- Investigate disk latency
- Increase the maximum memory allocation
- Indexing, look for high disk I/O queries
- Enable data page compression if CPU usage is not suffering
Note: It’s normal to see some PAGEIOLATCH_* waits, but if you’re frequently seeing them with wait times consistently above 10 milliseconds and you’re experiencing some type of latency, it suggests that the I/O subsystem is under pressure. Conversely, if you see many brief waits, you may be affected by increased I/O activity.
For more information, please refer to: PAGEIOLATCH_SH and PAGEIOLATCH_EX.
Best regards,
Seeya
If the response is helpful, please click "Accept Answer" and upvote it, as this could help other community members looking for similar queries.
Note: Please follow the steps in our documentation to enable e-mail notifications if you want to receive the related email notification for this thread. -
Heisenberg 266 Reputation points
2021-09-17T15:50:12.73+00:00 Thank you both for your response. Ive read lot of articles that says "page life expectancy" should be high. , in my system ive seen in idera tool it has been consistently below baseline (line in the red). At times ive seen its goes below 300, which imo is too low for a server that has 235G allocated with db size of around 1TB.
The issue we are having is with the 2 subscribers, and lot of times i see sessions will have a wait of "pageiolatch_sh" and "pageiolatch_ex". mostly the _sh. There are some heavy reports run on this db servers. doesnt it also mean if you see high number of pageiolatch_sh waits it is trying to ready page from disk ,rather than it is being in the buffer. so if we had more memory allocated it doesnt have to go to disk subsystem. Indicating memory pressure.