Azure Analysis Services
An Azure service that provides an enterprise-grade analytics engine.
439 questions
This browser is no longer supported.
Upgrade to Microsoft Edge to take advantage of the latest features, security updates, and technical support.
' cx='32' cy='32' r='32' /%3E%3Ctext x='50%25' y='55%25' dominant-baseline='middle' text-anchor='middle' fill='%23FFF' %3EM%3C/text%3E%3C/svg%3E)
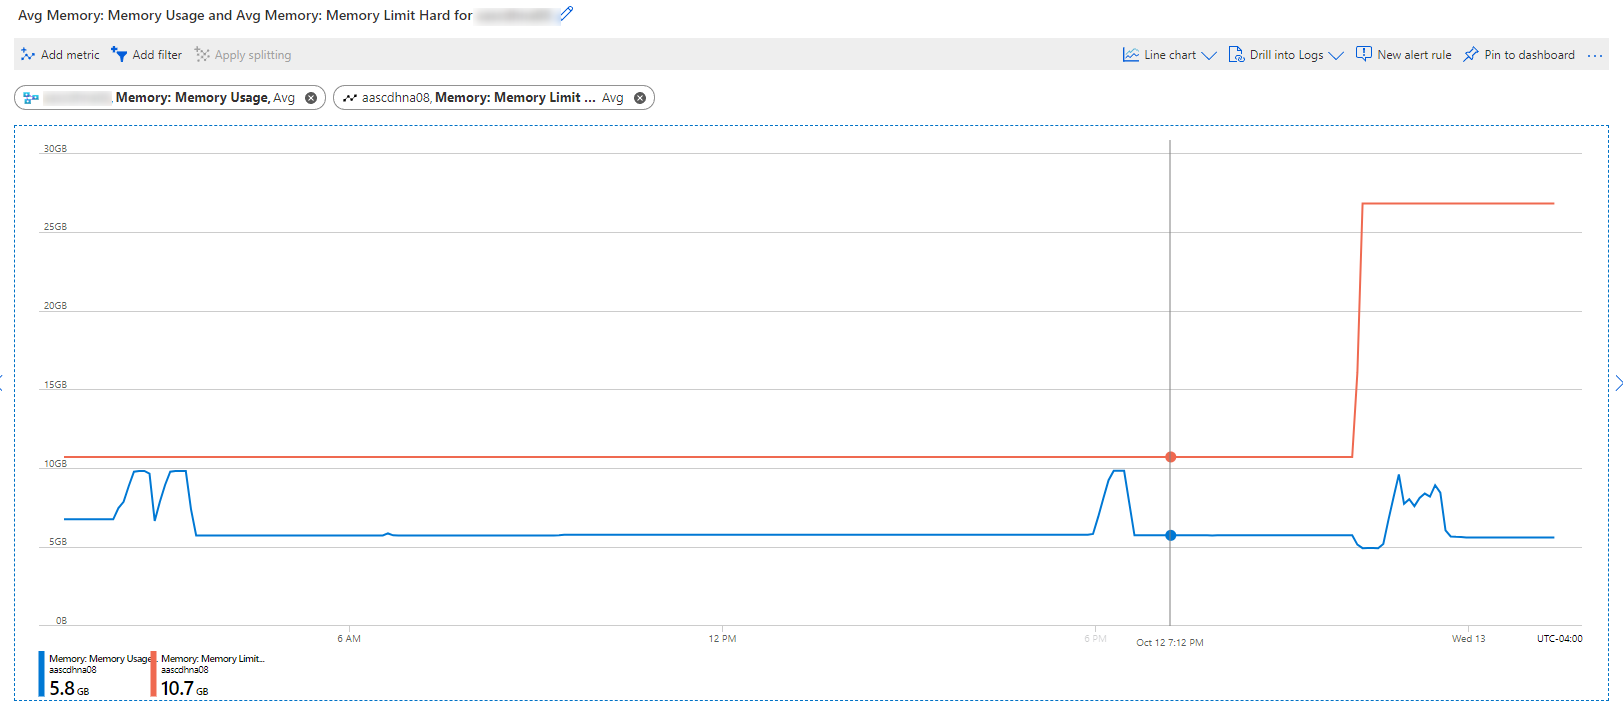
I'm trying to understand what the memory metric in Azure portal means for AAS.
~6:30pm I got an error (see Image 1) saying 'Memory error: You have reached the maximum allowable memory allocation for your tier. Consider upgrading to a tier with more available memory.' I then scaled up from S0 (10 GB) to S1 (25GB) ~10pmEST.
My questions are:
IMAGE 1 - Error
![140074-2021-10-12-22h10-04.png][1]
IMAGE 2 - Memory Dashboard in Azure Portal
I've found these links helpful:
' cx='32' cy='32' r='32' /%3E%3Ctext x='50%25' y='55%25' dominant-baseline='middle' text-anchor='middle' fill='%23FFF' %3EMM%3C/text%3E%3C/svg%3E)
Hello @Mariah and welcome to Microsoft Q&A.
When AAS does processing, it reads all the data into memory, does some work on it, and then afterwards writes the data back. This is the spike, holding all the data in memory and working on it.
The "at rest" memory level, is the cache AAS holds to answer queries.
It is like a gasoline-powered automobile. You turn it on, and the engine is running idle. Then when you accelerate, the engine works harder. When you stop accelerating, it returns to idle. Even at idle, the engine is running. Only when turn the car off does engine stop.
Does this make sense?
Yes! Your answer is very clear, concise, and the analogy is perfect. Thank you!
On a separate note, I'm wondering if you can speak to the AAS side of this question? Specifically: Does AAS allow data queries while refresh is happening? If so, is that data the old data, the new data, or both?
Here is my logic to the issue, @Mariah .
According to analysis-services-async-refresh , there is Post, Get, and Delete operations on refreshes.
The description under the delete option says
To cancel an in-progress refresh operation ...
The ability to cancel an in-progress referesh operation, and go back to the old data, implies that the old data is kept around until all of the refresh is completed. If the old data is kept around, then any queries submitted during refresh will work on the old data. I have 90% confidence in this statement. This is because returning a mix of old and new data goes against the database ideal of ACID. Also, a refresh is not complete unless all the new data is loaded.
So, I speculate that during the refresh operation, each table is duplicated. An old copy for read queries to work against, and a new copy in which the new data is loaded. Once all data is finished loading, the tables get swapped.