Azure App Service
Azure App Service is a service used to create and deploy scalable, mission-critical web apps.
8,965 questions
This browser is no longer supported.
Upgrade to Microsoft Edge to take advantage of the latest features, security updates, and technical support.
' cx='32' cy='32' r='32' /%3E%3Ctext x='50%25' y='55%25' dominant-baseline='middle' text-anchor='middle' fill='%23FFF' %3EJV%3C/text%3E%3C/svg%3E)
Hello,
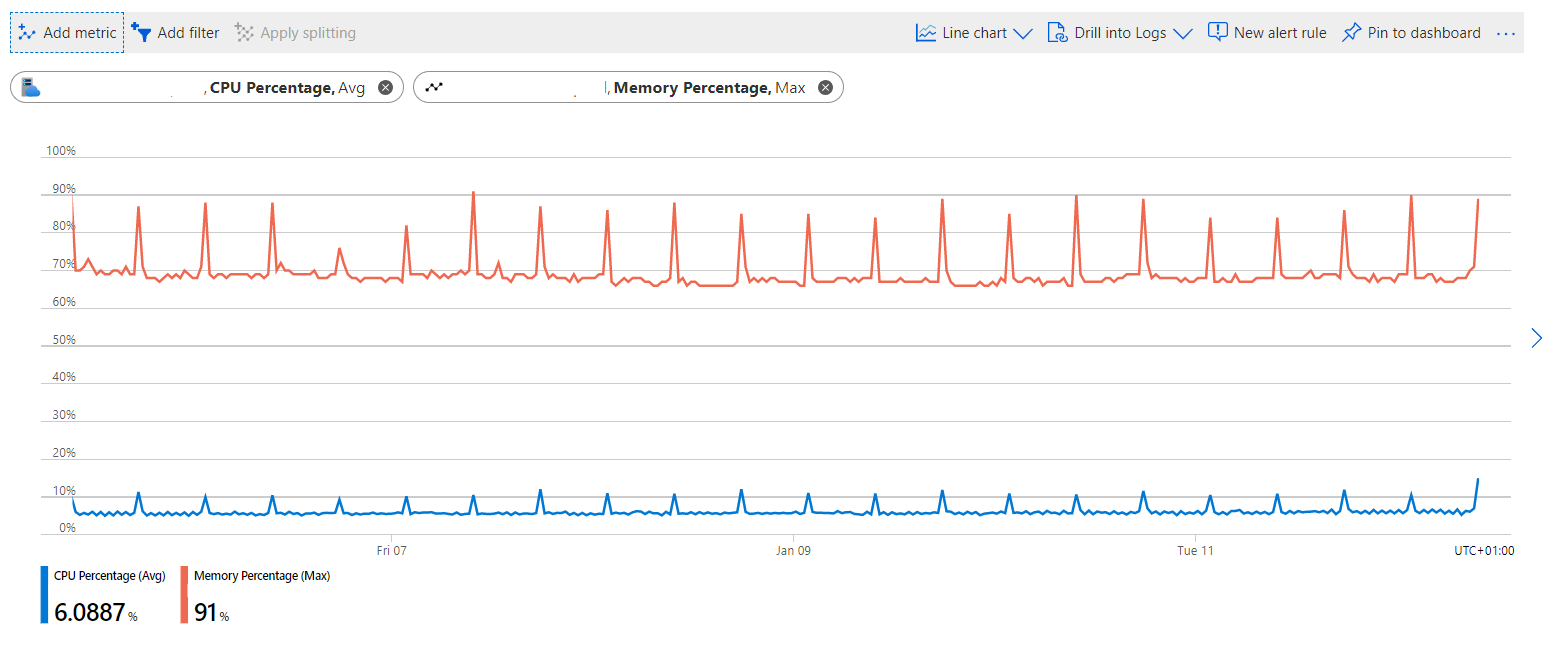
My Azure App Service Plan has unexplained memory and cpu spikes every 8 hours. There are several apps on the app service plan, but only one production application that has regular usage. The production app has fairly low utilization, and only during business hours. The memory and cpu spikes appear completely unrelated to the usage of the app.
I have looked at the cpu and private bytes charts of each individual app, but none of the apps show this periodic pattern, or high cpu or memory usage at all.
The spikes do not currently cause any issues, but they could in the future, and I would like to understand what is going on. Is this normal? What could be causing these spikes? How to diagnose?

I have somewhat the same problem. Our app is constantly on 80% memory usage while it is only being used by timer triggered functions which run once a day.
Couldn't find any answers to my question yet.
This is causing most of our functions to run out of memory and exit.

This issue isn't related @Erfan Nariman . Here, it was determined here that metrics were aggregated thereby showing higher than what the OP was expecting. Once they changed to average, they were seeing expected values.
' cx='32' cy='32' r='32' /%3E%3Ctext x='50%25' y='55%25' dominant-baseline='middle' text-anchor='middle' fill='%23FFF' %3ERF%3C/text%3E%3C/svg%3E)
Hi @Jeroen Vrijkorte ,
I have exactly the same spikes, also every 8 hours. I looked at the garbage collection metric of each of the app services in my service plan. Sure enough, one of the services was doing a garbage collection every 8 hours at the time of the spikes. In my case, it is a server which handles an Angular web application.
I haven't found out what exactly is responsible for triggering the garbage collection, perhaps the Angular system itself. Anyway, it is clear that garbage collection is necessary at intervals and that it is a CPU-intensive operation which temporarily reserves alot of memory. Garbage collection always runs at low priority, so it should not affect the performance of your application.
Regards, Bob
Hello @Robert Fitch
Thank you for sharing your discovery about garbage collection. I'm not able to verify at this time whether my issue was really caused by garbage collection. I've checked a few of our app services, and Gen 2 collections were happening much more frequently than once per 8 hours. I haven't checked all of them yet (we have a lot of app services).
So I can't really confirm your finding at this point, but I can say that we haven't had any issues related to the CPU and memory spikes.
Best regards,
Jeroen
Hi @Jeroen Vrijkorte ,
It's difficult to ascertain a root cause based on the graph you've shared. Furthermore, it's difficult to see how long the spikes last at the 8-hour interval. Troubleshoot performance degradation is great place to start to setup application insights and monitoring your application.
Since it occurs every 8-hours, here are some areas I would focus on. Are there any requests that hit your app at that time? In looking at the graph, your app is doing some sort of process that's causing the memory allocation. If your app isn't getting hit with requests, then the next place I would look is any background processing threads. If the issue is GC related, then that should show on any performance counter graphs. If your application is .NET based, you profile it to gain better understanding what's being allocated by what callers.
---
EDIT: 1/28/2022
Just to follow up with your offline discussion. You had the aggregation of your metrics set on max and by switching it to average, you felt more comfortable with what you were seeing. Should something appear out of place, the referenced links will guide you on how to determine the root cause.
Thank you for your fast reply. The periodic spikes last about 3 minutes each.
Sometimes the spikes happen when there have been no requests for hours. So the load on the app doesn't seem to matter for this. The app doesn't do any background processing either.
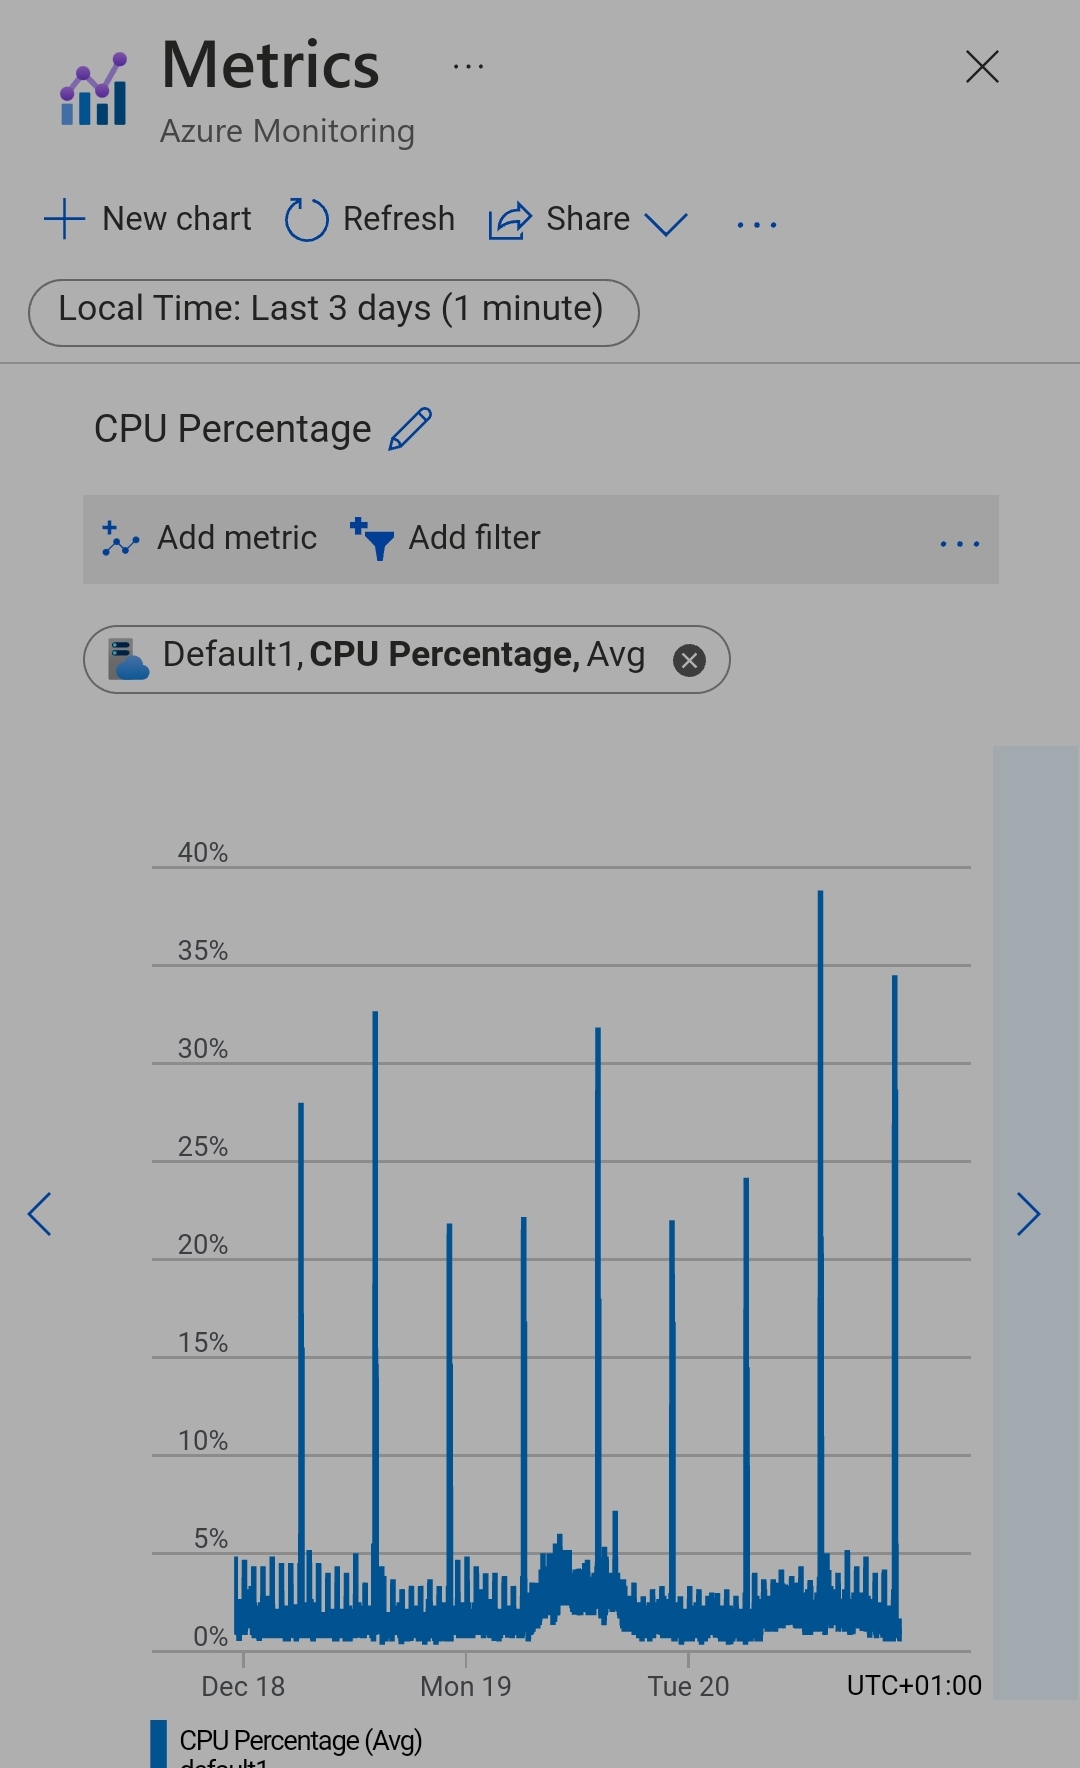
I've finally found the graph I was looking for. It's not available on the app service plan page, but via an individual app, then diagnose and solve problems, high cpu analysis, you can finally choose "CPU drilldown", which shows the CPU usage of each app service on the app service plan in a single graph. I spent hours trying to find a graph like this.
And it shows.... that none of the app services is using significant cpu. There are no spikes. There are also no spikes in memory that can be attributed to any particular app service.
This leads me to conclude, that whatever causes these cpu and memory spikes, it's something the Azure platform is doing in the background, for whatever reason. I'm pretty much lost trying to figure out what it is doing and why and what it means for the stability of my apps.
' cx='32' cy='32' r='32' /%3E%3Ctext x='50%25' y='55%25' dominant-baseline='middle' text-anchor='middle' fill='%23FFF' %3ETV%3C/text%3E%3C/svg%3E)
@Jeroen Vrijkorte Where you able to solve your issues?
We are seeing similar behavior on our app service plan, which is a low utilisation plan:
It happens exactly every 8 hours: 4:30/12:30/20:30 (UTC)
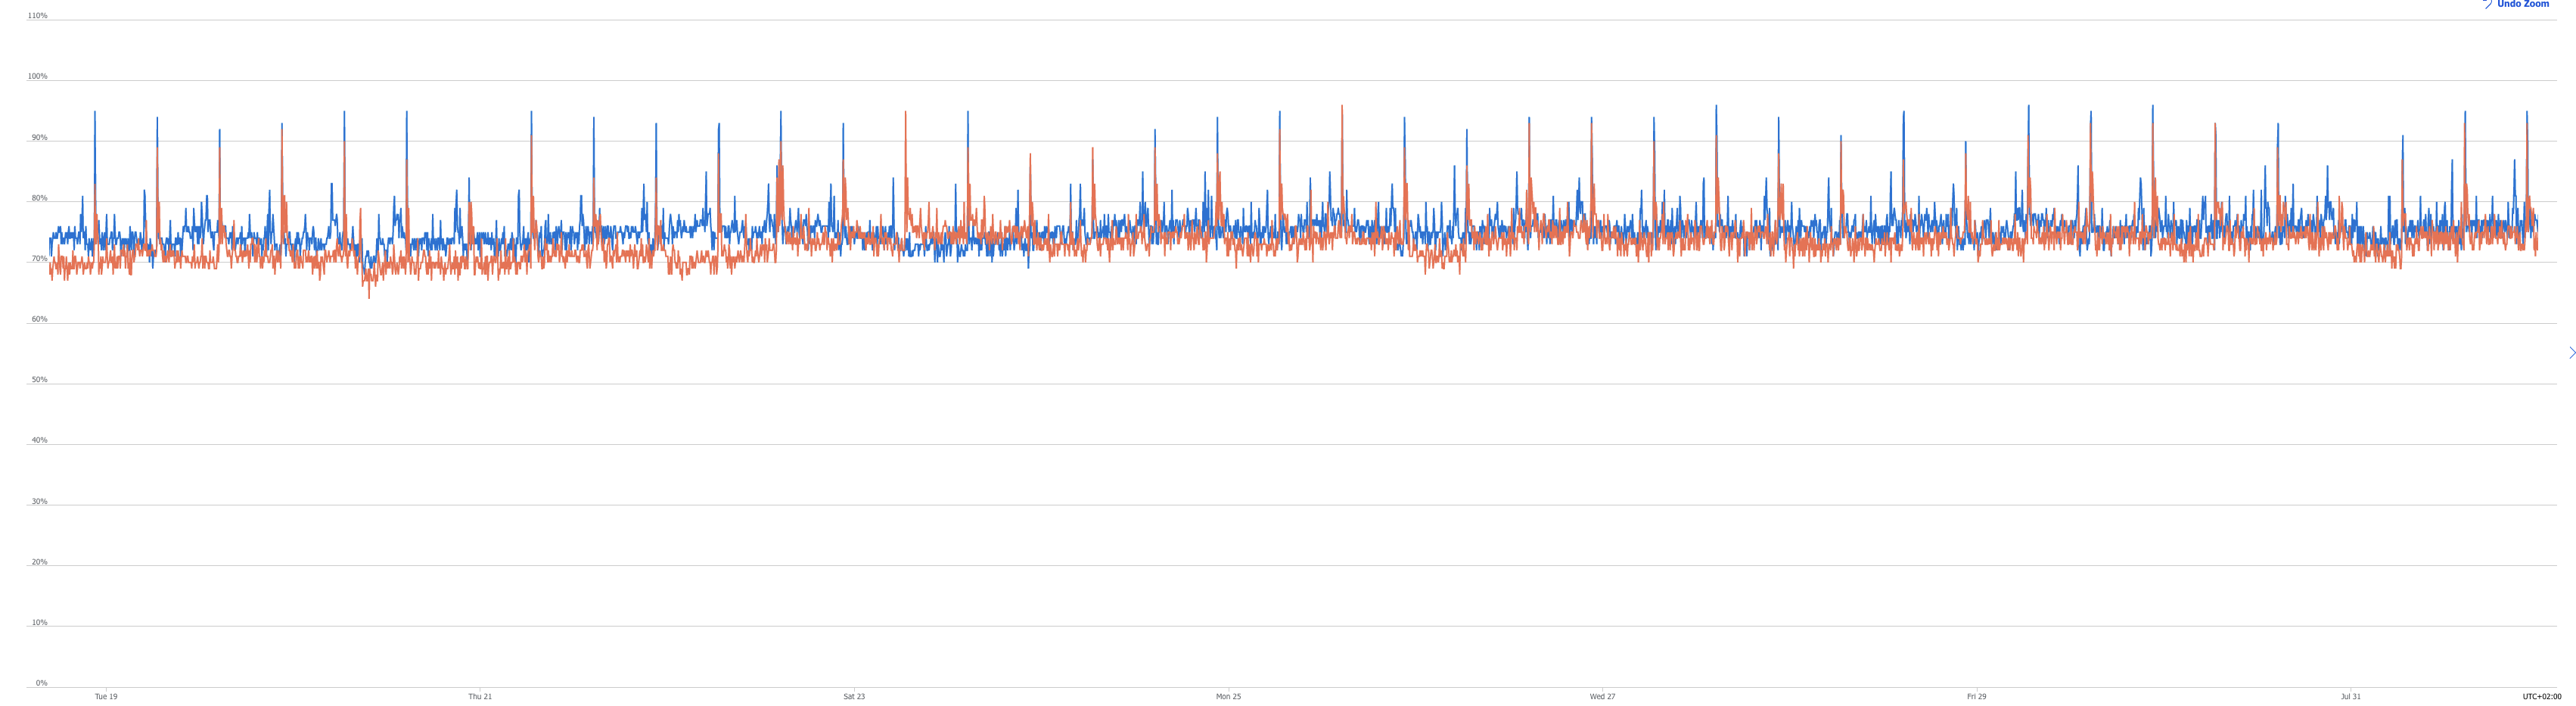
Memory usage, max, split by instance, granularity of 5 min
Yes, the peaks are heavier when set to 'max' but even on 'avg' the peaks are visible and trigger our 80% memory usage alert.
I did discover that on another app service plan, in a different subscription, same SKU, with same software, has the same pattern each 8 hours, but that the times are different by 12 hours: 16:30/00:30/08:30 (UTC).
Each individual app service and function does not show a memory peak, so I suspect that there is something happening inside the App Service Plan or the underlaying platform. Could there be some maintenance job running, where the timing is app service plan specific?
Hello @Tim vd H ,
It's reassuring to me that you see the exact same pattern. This strengthens my suspicion that this pattern of memory usage spikes is caused by the Azure platform, and not by the apps running on it.
Support told me they are only allowed to diagnose any patterns seen in an "avg" aggregation, and in our case the spikes were not visible in "avg" aggregation. Fortunately, our apps are still running fine without any noticeable memory-related issues.
' cx='32' cy='32' r='32' /%3E%3Ctext x='50%25' y='55%25' dominant-baseline='middle' text-anchor='middle' fill='%23FFF' %3EPG%3C/text%3E%3C/svg%3E)
We see the same peaks every 8 hours with avg aggregation. There is no job running and no requests during that time. Must be something else on Azure. Wen need to change the Autoscaling values, since the peak sometimes fires up an additional instance ...

This looks like maintenance tasks on the underlying Virtual Machine, probably the polling Defender does for updates. It's noticeable on smaller single core VM's and can affect your app for the duration of the polling/updating. Nothing you can (or even should) disable nor worry about. You can confirm this with support by opening a ticket.
' cx='32' cy='32' r='32' /%3E%3Ctext x='50%25' y='55%25' dominant-baseline='middle' text-anchor='middle' fill='%23FFF' %3EMA%3C/text%3E%3C/svg%3E)
I'm working for an IT company, facing the same issue with an Azure service plan (P1V3) shared by 12 APIs hosted on Azure app services. 100% Spikes are quite random. When the request responses are examined no major issue is found during the spike time, Now how do I explain and justify to the management, who are not too technical people and they trust the Azure Metrics graph more than anything