Plot vector tile on Bing map from Arcgis

Balasaheb Molawade 136 Reputation points
2022-02-16T11:55:02.573+00:00

Hi,

We have developed an application to read the vector tiles from ArcGIS and plot it on a Bing map.

We are able to fetch the vector tile layer from ArcGIS. We used the below REST URL. We are not able to plot it on a Bing map.

https://vectortileservices3.arcgis.com/g8yK2NdrHpegTrYY/arcgis/rest/services/ZIP_CODE_040114/VectorTileServer/tile/9/192/151.pbf?token=CmpXNZFYKO-KwTZJd6Xlvn468BDJO7Bldu_1DXDXiQCrxm0QZV0WzgPpMZetDQ63IoZHX9rbYT6Ea_hjeHPC04EY8S5bZbWwdfNlEHWiVj0dlwDH85ctFraSde8eRFykntNUnR6GKK2c23T-dQ3TR2uriYSzNZqAjJjH66ayiKgATanefXeIyDth7vKStby26UHPI4RV5lqM-A8PFs1dRrt9-IacS-X4DrJmBhW9oqKjay3MbOY5ny0ZeFfCyJ1gpOX2NdsIx_JyY3uYtbM7IRPr11YFlpOCEbnE5909hbE.

We tried the below code but it did not work.

wmsUrl = "https://vectortileservices3.arcgis.com/g8yK2NdrHpegTrYY/arcgis/rest/services/ZIP_CODE_040114/VectorTileServer/tile/9/192/151.pbf?token=CmpXNZFYKO-KwTZJd6Xlvn468BDJO7Bldu_1DXDXiQCrxm0QZV0WzgPpMZetDQ63IoZHX9rbYT6Ea_hjeHPC04EY8S5bZbWwdfNlEHWiVj0dlwDH85ctFraSde8eRFykntNUnR6GKK2c23T-dQ3TR2uriYSzNZqAjJjH66ayiKgATanefXeIyDth7vKStby26UHPI4RV5lqM-A8PFs1dRrt9-IacS-X4DrJmBhW9oqKjay3MbOY5ny0ZeFfCyJ1gpOX2NdsIx_JyY3uYtbM7IRPr11YFlpOCEbnE5909hbE.";

var NOAAWeatherRadar = new Microsoft.Maps.TileLayer({
mercator: new Microsoft.Maps.TileSource({
// uriConstructor: wmsUrl + '?REQUEST=GetMap&SERVICE=WMS&VERSION=1.3.0&LAYERS=1&STYLES=default&FORMAT=image/png&TRANSPARENT=TRUE&CRS=CRS:84&BBOX={bbox}&WIDTH=256&HEIGHT=256',
// uriConstructor: '/tile/{z}/{y}/{x}.pbf',
uriConstructor: wmsUrl,
minZoom: 3,
maxZoom: 10,
bounds: Microsoft.Maps.LocationRect.fromEdges(50.415613, -127.629361, 21.661516, -66.526907)
})
});

        map.layers.insert(NOAAWeatherRadar);

Anyone have sample code for the same.

Thanks!

Azure Maps
Azure Maps
An Azure service that provides geospatial APIs to add maps, spatial analytics, and mobility solutions to apps.
696 questions
0 comments No comments
{count} votes

3 answers

Sort by: Most helpful
  1. rbrundritt 17,181 Reputation points Microsoft Employee
    2022-02-16T16:25:58.447+00:00

    Vector tiles are a completely different beast from traditional map tiles/tile layers.

    • Traditional map tiles/tile layers are images that have been cut up into smaller images.
    • Vector tiles consist of geometry data that has been cropped to the area of a tile, encoded, then compressed. It's not an image and requires a completely different set of tools to render.

    Bing Maps does not support vector tiles (pbf), however, Azure Maps does (and actually uses it natively for the base maps). Here are details on how to use vector tiles with Azure Maps:

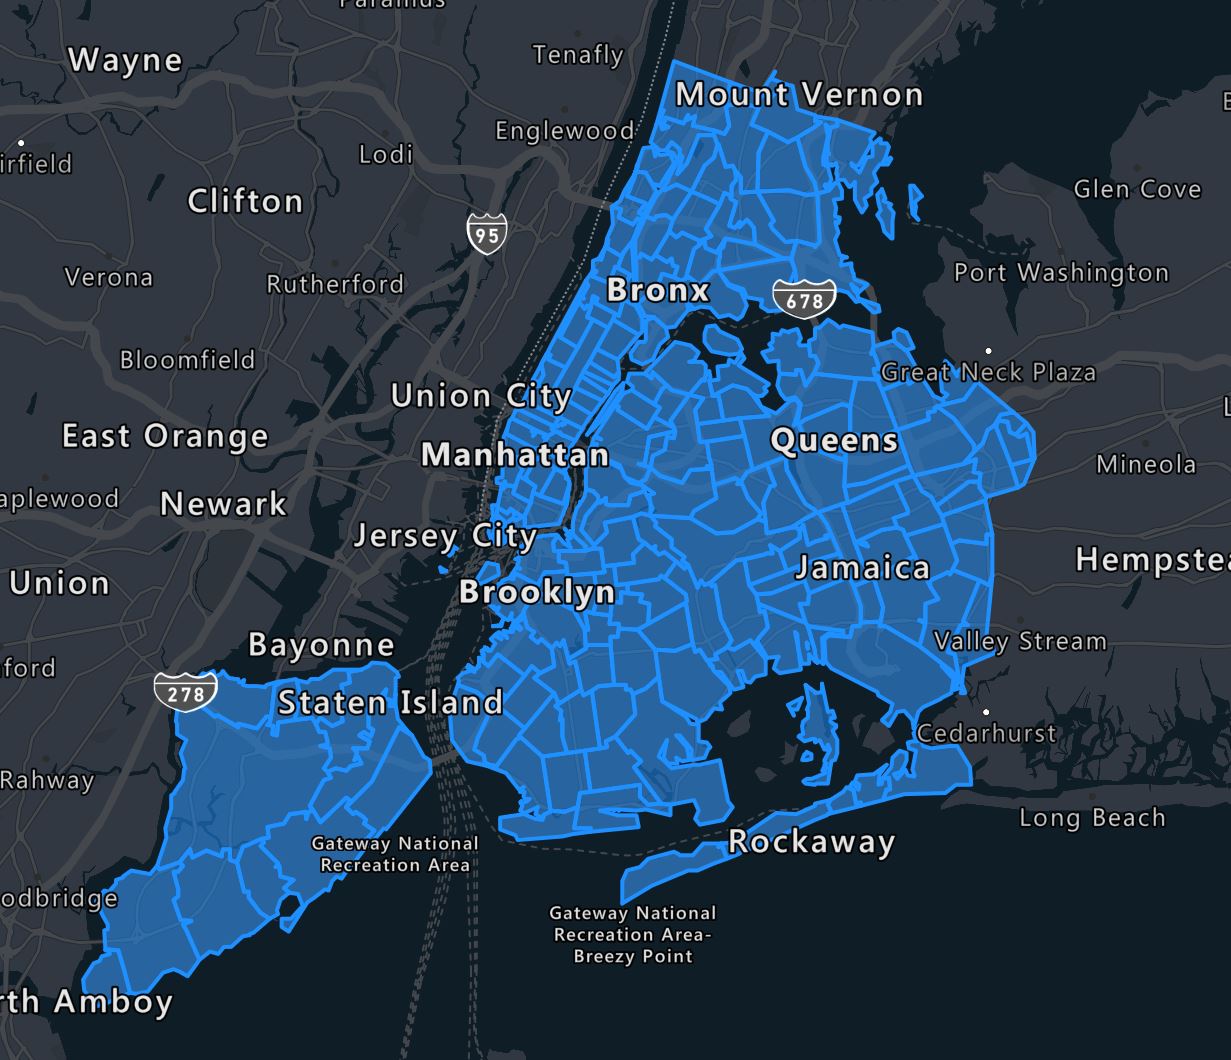
    I did some experimenting and got your vector tiles working in Azure Maps using this code:

       var map, datasource, popup;  
         
       function GetMap() {  
       	//Initialize a map instance.  
       	map = new atlas.Map('myMap', {  
       		center: [-74.2573258, 40.4957222],  
       		style: 'grayscale_dark',  
       		zoom: 8,  
       		view: 'Auto',  
         
       		authOptions: {  
       			authType: 'subscriptionKey',  
       			subscriptionKey: '<Your Azure Maps Key>'  
       		}  
       	});  
         
       	//Wait until the map resources are ready.  
       	map.events.add('ready', function () {  
       		//Create a reusable popup.  
       		popup = new atlas.Popup();  
         
       		//Create a vector tile source and add it to the map.  
       		datasource = new atlas.source.VectorTileSource(null, {  
       			tiles: ['https://vectortileservices3.arcgis.com/g8yK2NdrHpegTrYY/arcgis/rest/services/ZIP_CODE_040114/VectorTileServer/tile/{z}/{y}/{x}?token=CmpXNZFYKO-KwTZJd6Xlvn468BDJO7Bldu_1DXDXiQCrxm0QZV0WzgPpMZetDQ63IoZHX9rbYT6Ea_hjeHPC04EY8S5bZbWwdfNlEHWiVj0dlwDH85ctFraSde8eRFykntNUnR6GKK2c23T-dQ3TR2uriYSzNZqAjJjH66ayiKgATanefXeIyDth7vKStby26UHPI4RV5lqM-A8PFs1dRrt9-IacS-X4DrJmBhW9oqKjay3MbOY5ny0ZeFfCyJ1gpOX2NdsIx_JyY3uYtbM7IRPr11YFlpOCEbnE5909hbE'],  
       			  
       			minZoom: 7,  
       			  
       			maxZoom: 18,  
       			  
       			bounds: [-74.2573258, 40.4957222, -73.6988138, 40.9152099]  
       		});  
       		map.sources.add(datasource);  
         
       		//Create a layer to render the polygon data.  
       		var layer = new atlas.layer.PolygonLayer(datasource, null, {  
       			//The name of the data layer within the data source to pass into this rendering layer.  
       			sourceLayer: 'ZIP_CODE_040114',  
       			  
       			minZoom: 7,  
       			  
       			maxZoom: 18,  
         
       		   // color: 'blue'  
       		});  
       		  
       		var outlineLayer =  new atlas.layer.LineLayer(datasource, null, {  
       			//The name of the data layer within the data source to pass into this rendering layer.  
       			sourceLayer: 'ZIP_CODE_040114',  
       			  
       			minZoom: 7,  
       			  
       			maxZoom: 18,  
       			  
       			//strokeColor: 'red',  
       			  
       			strokeWidth: 2  
       			  
       		});  
         
       		//Add a click event to the layer to display details.  
       		map.events.add('click', layer, featureClicked);  
         
       		//Add the layers below the labels so that the labels are clearly readable.  
       		map.layers.add([layer, outlineLayer], 'labels');  
       	});  
       }  
         
       function featureClicked(e) {  
       	//Make sure the event occurred on a shape feature.  
       	if (e.shapes && e.shapes.length > 0) {  
       		//Since the data is coming from a vector tile source, it will be a raw GeoJSON feature and not a Shape class.  
       		var f = e.shapes[0];  
         
       		//If the shape is a Point, use its coordinates to position the popup, otherwise use the mouse location.  
       		var pos = (f.geometry.type === 'Point') ? f.geometry.coordinates : e.position;  
         
       		//Update the content and position of the popup.  
       		popup.setOptions({  
       			//Apply a template to the properties of the shape feature.   
       			content: atlas.PopupTemplate.applyTemplate(f.properties),  
       			position: pos  
       		});  
         
       		//Open the popup.  
       		popup.open(map);  
       	}  
       }  
    

    Here is a screenshot:
    175015-arcgisvectortiles.jpg

    0 comments No comments

  2. Balasaheb Molawade 136 Reputation points
    2022-02-17T07:06:17.42+00:00
    0 comments No comments

  3. rbrundritt 17,181 Reputation points Microsoft Employee
    2022-02-17T15:49:55.587+00:00

    In Azure Maps you can connect to both of these using the Spatial IO module: https://learn.microsoft.com/en-us/azure/azure-maps/how-to-use-spatial-io-module

    Here are a bunch of examples: https://samples.azuremaps.com/?search=Spatial%2520IO

    0 comments No comments

Your answer

Answers can be marked as Accepted Answers by the question author, which helps users to know the answer solved the author's problem.