Note
Access to this page requires authorization. You can try signing in or changing directories.
Access to this page requires authorization. You can try changing directories.
The Azure Maps Web SDK stores data in data sources. Using data sources optimizes the data operations for querying and rendering. Currently there are two types of data sources:
- GeoJSON source: Manages raw location data in GeoJSON format locally. Good for small to medium data sets (upwards of hundreds of thousands of shapes).
- Vector tile source: Loads data formatted as vector tiles for the current map view, based on the maps tiling system. Ideal for large to massive data sets (millions or billions of shapes).
GeoJSON data source
A GeoJSON based data source load and store data locally using the DataSource class. GeoJSON data can be manually created or created using the helper classes in the atlas.data namespace. The DataSource class provides functions to import local or remote GeoJSON files. Remote GeoJSON files must be hosted on a CORs enabled endpoint. The DataSource class provides functionality for clustering point data. And, data can easily be added, removed, and updated with the DataSource class. The following code shows how GeoJSON data can be created in Azure Maps.
//Create raw GeoJSON object.
var rawGeoJson = {
     "type": "Feature",
     "geometry": {
         "type": "Point",
         "coordinates": [-100, 45]
     },
     "properties": {
         "custom-property": "value"
     }
};

//Create GeoJSON using helper classes (less error prone and less typing).
var geoJsonClass = new atlas.data.Feature(new atlas.data.Point([-100, 45]), {
    "custom-property": "value"
});
Once created, data sources can be added to the map through the map.sources property, which is a SourceManager. The following code shows how to create a DataSource and add it to the map.
//Create a data source and add it to the map.
var source = new atlas.source.DataSource();
map.sources.add(source);
The following code shows the different ways GeoJSON data can be added to a DataSource.
//GeoJsonData in the following code can be a single or array of GeoJSON features or geometries, a GeoJSON feature collection, or a single or array of atlas.Shape objects.

//Add geoJSON object to data source.
source.add(geoJsonData);

//Load geoJSON data from URL. URL should be on a CORs enabled endpoint.
source.importDataFromUrl(geoJsonUrl);

//Overwrite all data in data source.
source.setShapes(geoJsonData);
Tip
Lets say you want to overwrite all data in a DataSource. If you make calls to the clear then add functions, the map might re-render twice, which might cause a bit of a delay. Instead use the setShapes function, which will remove and replace all data in the data source and only trigger a single re-render of the map.
Vector tile source
A vector tile source describes how to access a vector tile layer. Use the VectorTileSource class to instantiate a vector tile source. Vector tile layers are similar to tile layers, but they aren't the same. A tile layer is a raster image. Vector tile layers are a compressed file, in PBF format. This compressed file contains vector map data, and one or more layers. The file can be rendered and styled on the client, based on the style of each layer. The data in a vector tile contain geographic features in the form of points, lines, and polygons. There are several advantages of using vector tile layers instead of raster tile layers:
- A file size of a vector tile is typically much smaller than an equivalent raster tile. As such, less bandwidth is used. It means lower latency, a faster map, and a better user experience.
- Since vector tiles are rendered on the client, they adapt to the resolution of the device they're being displayed on. As a result, the rendered maps appear more well defined, with crystal clear labels.
- Changing the style of the data in the vector maps doesn't require downloading the data again, since the new style can be applied on the client. In contrast, changing the style of a raster tile layer typically requires loading tiles from the server then applying the new style.
- Since the data is delivered in vector form, there's less server-side processing required to prepare the data. As a result, the newer data can be made available faster.
Azure Maps adheres to the Mapbox Vector Tile Specification, an open standard. Azure Maps provides the following vector tiles services as part of the platform:
Tip
When using vector or raster image tiles from the Azure Maps Render service with the web SDK, you can replace atlas.microsoft.com with the placeholder {azMapsDomain}. This placeholder will be replaced with the same domain used by the map and will automatically append the same authentication details as well. This greatly simplifies authentication with the render service when using Microsoft Entra authentication.
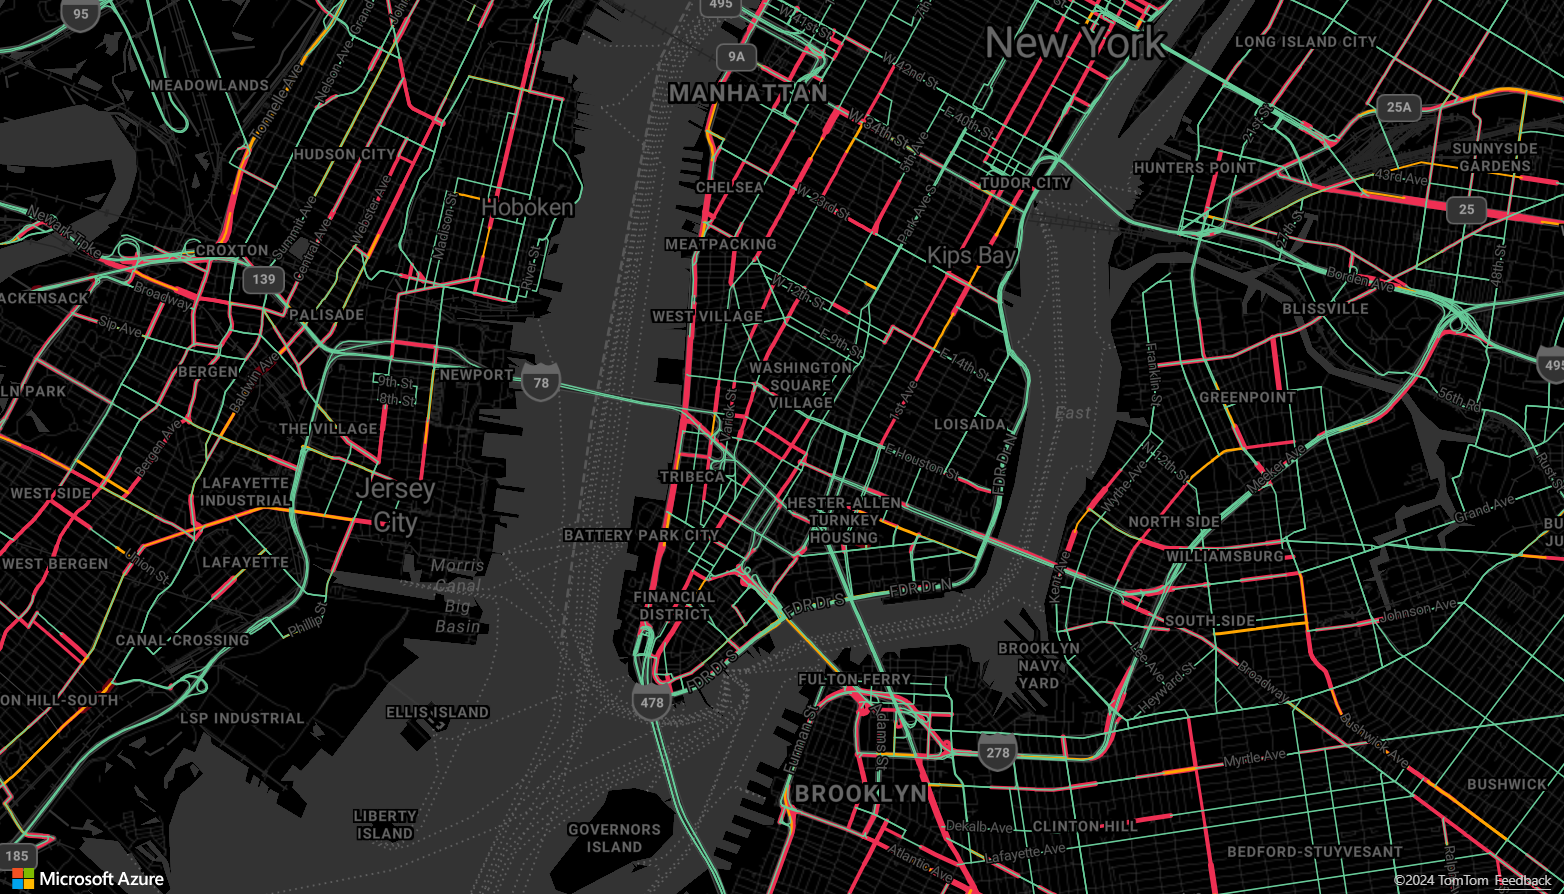
To display data from a vector tile source on the map, connect the source to one of the data rendering layers. All layers that use a vector source must specify a sourceLayer value in the options. The following code loads the Azure Maps traffic flow vector tile service as a vector tile source, then displays it on a map using a line layer. This vector tile source has a single set of data in the source layer called "Traffic flow". The line data in this data set has a property called traffic_level that is used in this code to select the color and scale the size of lines.
//Create a vector tile source and add it to the map.
var source = new atlas.source.VectorTileSource(null, {
    tiles: ['https://{azMapsDomain}/traffic/flow/tile/pbf?api-version=1.0&style=relative&zoom={z}&x={x}&y={y}'],
    maxZoom: 22
});
map.sources.add(source);

//Create a layer for traffic flow lines.
var flowLayer = new atlas.layer.LineLayer(source, null, {
    //The name of the data layer within the data source to pass into this rendering layer.
    sourceLayer: 'Traffic flow',

    //Color the roads based on the traffic_level property.
    strokeColor: [
        'interpolate',
        ['linear'],
        ['get', 'traffic_level'],
        0, 'red',
        0.33, 'orange',
        0.66, 'green'
    ],

    //Scale the width of roads based on the traffic_level property.
        strokeWidth: [
        'interpolate',
        ['linear'],
        ['get', 'traffic_level'],
        0, 6,
        1, 1
    ]
});

//Add the traffic flow layer below the labels to make the map clearer.
map.layers.add(flowLayer, 'labels');
For a complete working sample of how to display data from a vector tile source on the map, see Vector tile line layer in the Azure Maps Samples. For the source code for this sample, see Vector tile line layer sample code.
Connecting a data source to a layer
Data is rendered on the map using rendering layers. One or more rendering layers can reference a single data source. The following rendering layers require a data source:
- Bubble layer - renders point data as scaled circles on the map.
- Symbol layer- renders point data as icons or text.
- Heat map layer - renders point data as a density heat map.
- Line layer - render a line and or render the outline of polygons.
- Polygon layer - fills the area of a polygon with a solid color or image pattern.
The following code shows how to create a data source, add it to the map, and connect it to a bubble layer. And then, import GeoJSON point data from a remote location into the data source.
//Create a data source and add it to the map.
var source = new atlas.source.DataSource();
map.sources.add(source);

//Create a layer that defines how to render points in the data source and add it to the map.
map.layers.add(new atlas.layer.BubbleLayer(source));

//Load the earthquake data.
source.importDataFromUrl('https://earthquake.usgs.gov/earthquakes/feed/v1.0/summary/significant_month.geojson');
There are other rendering layers that don't connect to these data sources, but they directly load the data for rendering.
- Image layer - overlays a single image on top of the map and binds its corners to a set of specified coordinates.
- Tile layer - superimposes a raster tile layer on top of the map.
One data source with multiple layers
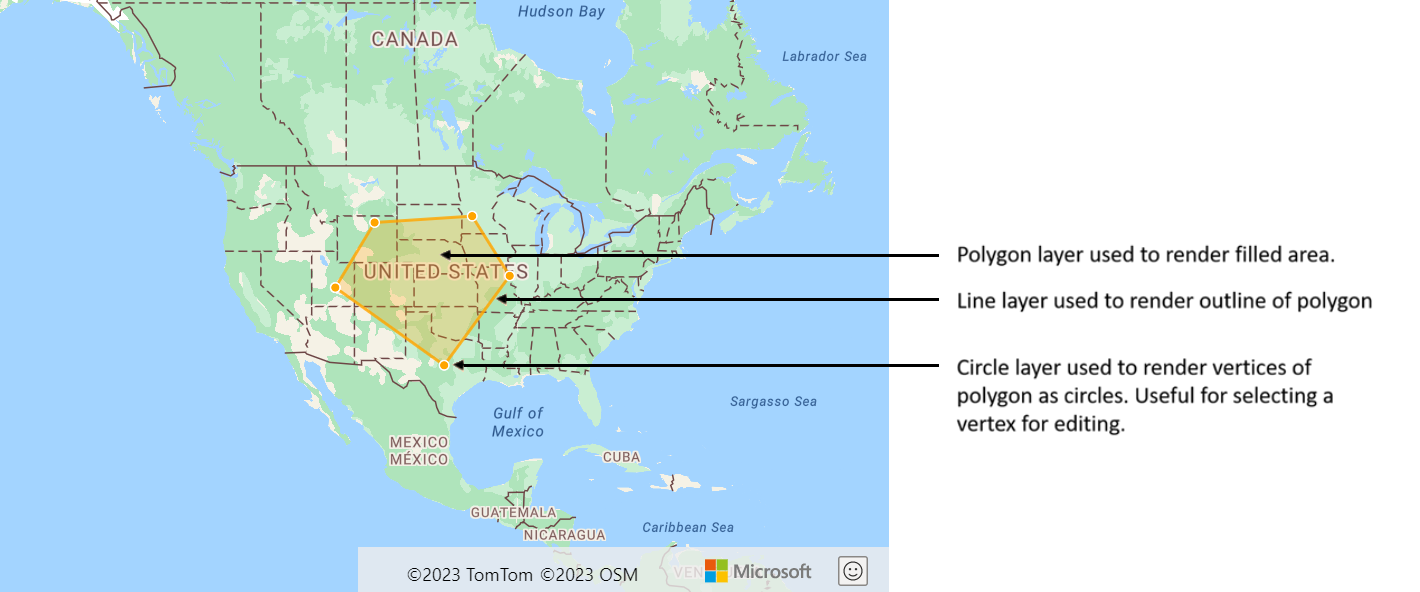
Multiple layers can be connected to a single data source. There are many different scenarios in which this option is useful. For example, consider the scenario in which a user draws a polygon. We should render and fill the polygon area as the user adds points to the map. Adding a styled line to outline the polygon makes it easier see the edges of the polygon, as the user draws. To conveniently edit an individual position in the polygon, we may add a handle, like a pin or a marker, above each position.
In most mapping platforms, you would need a polygon object, a line object, and a pin for each position in the polygon. As the polygon is modified, you would need to manually update the line and pins, which can quickly become complex.
With Azure Maps, all you need is a single polygon in a data source as shown in the following code.
//Create a data source and add it to the map.
var source = new atlas.source.DataSource();
map.sources.add(source);

//Create a polygon and add it to the data source.
source.add(new atlas.data.Feature(
        new atlas.data.Polygon([[[/* Coordinates for polygon */]]]));

//Create a polygon layer to render the filled in area of the polygon.
var polygonLayer = new atlas.layer.PolygonLayer(source, 'myPolygonLayer', {
     fillColor: 'rgba(255,165,0,0.2)'
});

//Create a line layer for greater control of rendering the outline of the polygon.
var lineLayer = new atlas.layer.LineLayer(source, 'myLineLayer', {
     strokeColor: 'orange',
     strokeWidth: 2
});

//Create a bubble layer to render the vertices of the polygon as scaled circles.
var bubbleLayer = new atlas.layer.BubbleLayer(source, 'myBubbleLayer', {
     color: 'orange',
     radius: 5,
     strokeColor: 'white',
     strokeWidth: 2
});

//Add all layers to the map.
map.layers.add([polygonLayer, lineLayer, bubbleLayer]);
Tip
When adding layers to the map using the map.layers.add function, the ID or instance of an existing layer can be passed in as a second parameter. This would tell that map to insert the new layer being added below the existing layer. In addition to passing in a layer ID this method also supports the following values.
"labels"- Inserts the new layer below the map label layers."transit"- Inserts the new layer below the map road and transit layers.
Next steps
Learn more about the classes and methods used in this article:
See the following articles for more code samples to add to your maps: