Azure Monitor
An Azure service that is used to collect, analyze, and act on telemetry data from Azure and on-premises environments.
3,673 questions
This browser is no longer supported.
Upgrade to Microsoft Edge to take advantage of the latest features, security updates, and technical support.
' cx='32' cy='32' r='32' /%3E%3Ctext x='50%25' y='55%25' dominant-baseline='middle' text-anchor='middle' fill='%23FFF' %3EH%3C/text%3E%3C/svg%3E)
I got alert about vulnerability check about NSG rule but that was created 90 days ago and not listed in logs or monitoring kql query, how to get NSG rules from created and active from past 1 year or more and who consume it using powershell or az cli or kql
' cx='32' cy='32' r='32' /%3E%3Ctext x='50%25' y='55%25' dominant-baseline='middle' text-anchor='middle' fill='%23FFF' %3ESS%3C/text%3E%3C/svg%3E)
anonymous user
Thank you for your patience with us on this thread. We tested this and would like to share our findings.
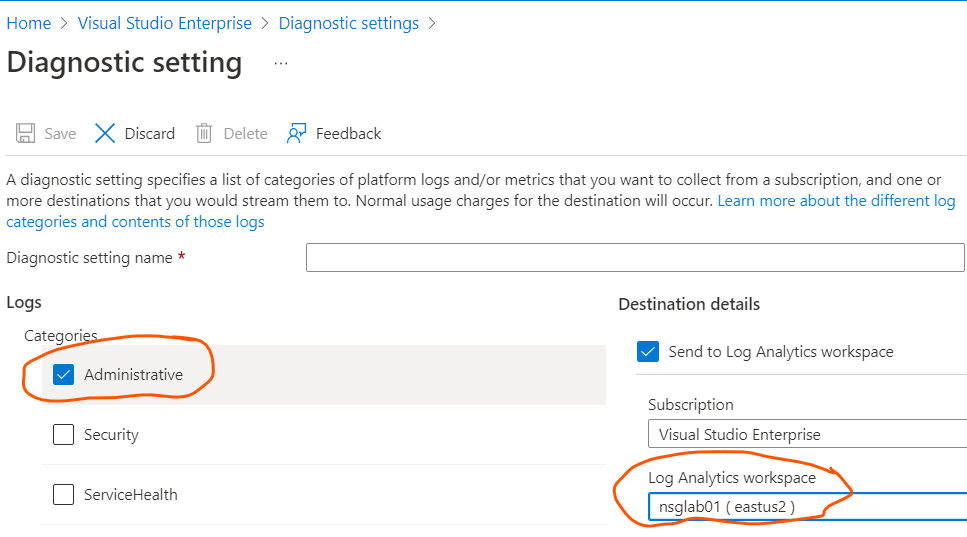
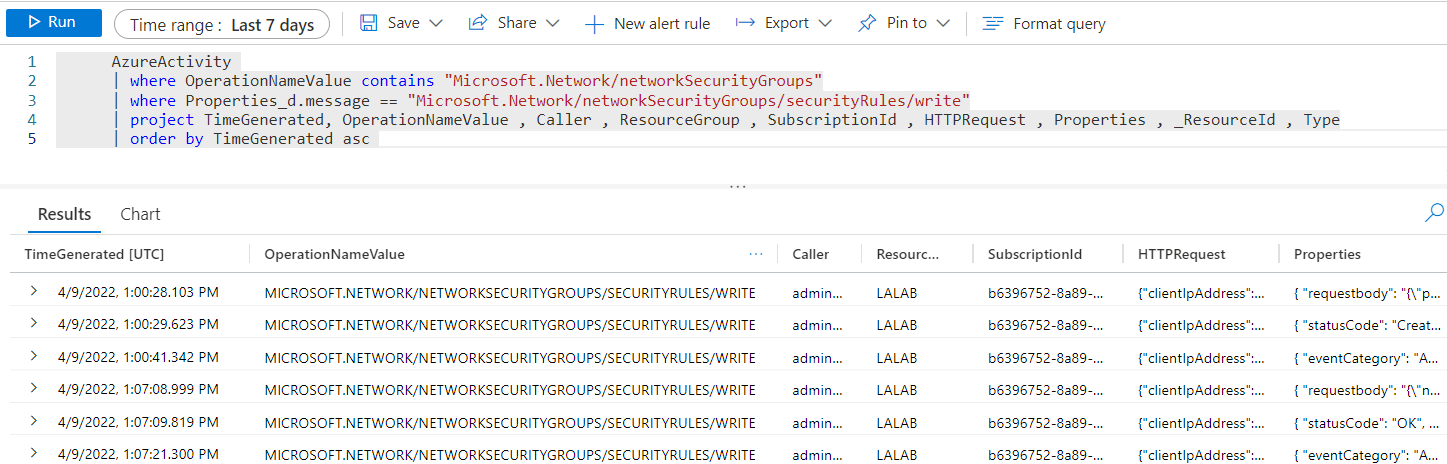
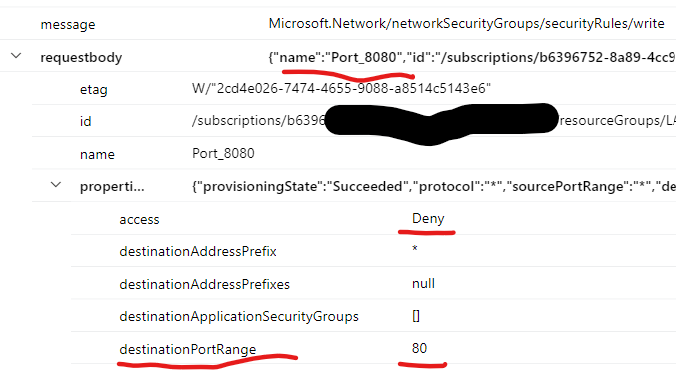
You required information on changes made to NSG rule and information about who updated/created a network security group. The data for any activity on azure ARM resources is stored in the Activity Log . This can be done by querying the platform logs within a log analytics workspace. Platform logs provide detailed diagnostic and auditing information for Azure resources . The data that we would require for this scenario would be present in the AzureActivity logs within a table with same name. For this, the data will first need to be ingested to a log analytics workspace and then analyzed.
Azure Activity logs are retained for 90 days and then they are deleted from the backend. In order to collect data older than 90 days , you would have to create a separate log analytics workspace and ingest the Activity Logs . For the first 90 days it wont be charged and after that the logs will be charged as per the standard azure monitor pricing .
As mentioned earlier , the Log Analytics workspace needs to be configured to collect All AzureActivity logs to the Log Analytics Workspace for the subscriptions that you would like to monitor. I tested this in my lab in a step-by-step fashion as mentioned below by enabling diagnostics settings on the subscription .
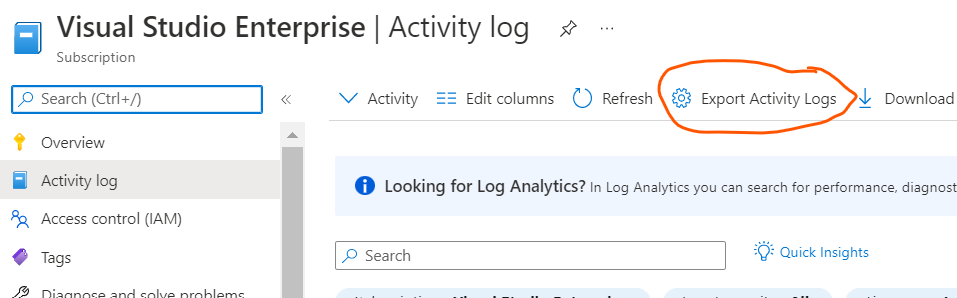
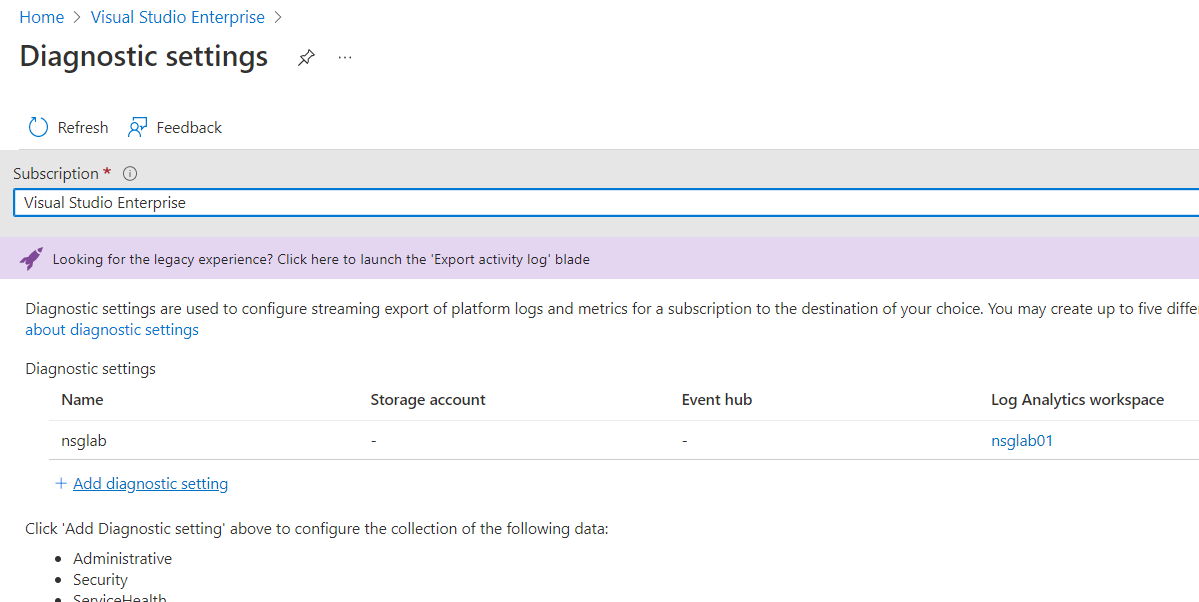
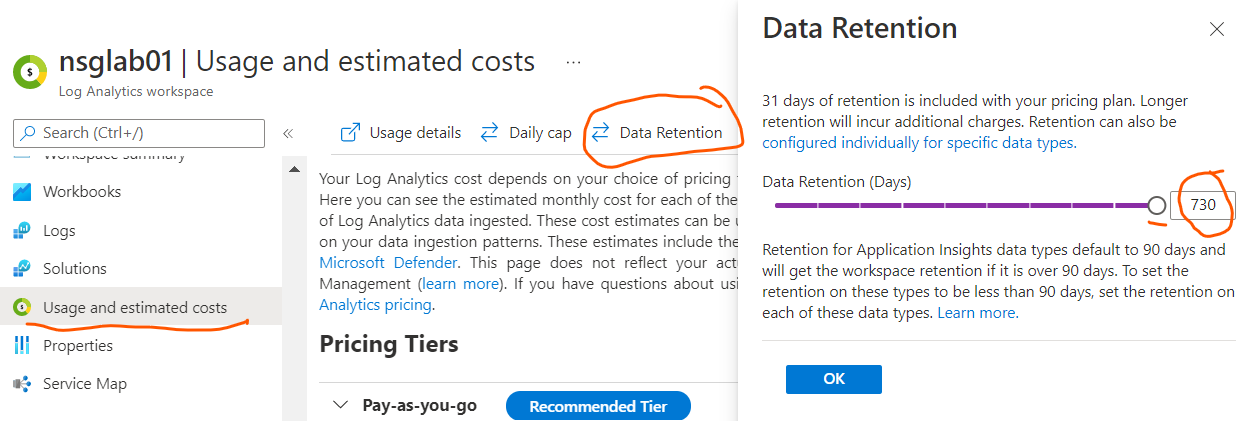
This will not show any old logs and only ingest the logs from the day you enable this . And it can be enabled for a maximum of 2 years. However you should consider the cost for this before going ahead with this. Exporting and storing these logs to a Azure storage account would be more cost effective however in that case you would have to download it you may not get the flexibility of KQL query from the portal's UI interface. You can enable the diagnostic settings for the sending logs to storage account and export it to similar to what is shown in this article. I would strongly suggest to understand how logs are stored in the storage account by reading this doc . You can download these logs using Storage explorer whenever its required to audit them. This can save overall cost of auditing NSGs in your scenario.
Hope this helps answer your query . I have included multiple links from our documentation and I would suggest you to go through them as they will help you understand more on the options for logs storage . In case the information provided is helpful , please do accept the post as answer in order to improve the relevancy of this answer for the community and other readers. In case you have any other query on this feel free to let us know and we will be happy to help you further.
Thank you .
----------------------------------------------------------------------------------------------------------------------------------------------------------
 whenever the information provided helps you. Original posters help the community find answers faster by identifying the correct answer. Here is how
anonymous user :
You can use the below mentioned powershell script to get all the NSG rules in your subscription and export it to a CSV file.
Connect-AzAccount

$azSubs = Get-AzSubscription -SubscriptionId 'xxxxx-9573-xxxx-886f-YourSubscriptionId'

foreach ( $azSub in $azSubs ) {
    Set-AzContext -Subscription $azSub | Out-Null
    $azSubName = $azSub.Name

    $azNsgs = Get-AzNetworkSecurityGroup

    foreach ( $azNsg in $azNsgs ) {

        # Export custom rules from NSGs in your subscription
        Get-AzNetworkSecurityRuleConfig -NetworkSecurityGroup $azNsg | `
            Select-Object @{label = 'NSG Name'; expression = { $azNsg.Name } }, `
            @{label = 'NSG Location'; expression = { $azNsg.Location } }, `
            @{label = 'Rule Name'; expression = { $_.Name } }, `
            @{label = 'Source'; expression = { $_.SourceAddressPrefix } }, `
            @{label = 'Source Application Security Group'; expression = { $_.SourceApplicationSecurityGroups.id.Split('/')[-1] } },
            @{label = 'Source Port Range'; expression = { $_.SourcePortRange } }, Access, Priority, Direction, `
            @{label = 'Destination'; expression = { $_.DestinationAddressPrefix } }, `
            @{label = 'Destination Application Security Group'; expression = { $_.DestinationApplicationSecurityGroups.id.Split('/')[-1] } }, `
            @{label = 'Destination Port Range'; expression = { $_.DestinationPortRange } }, `
            @{label = 'Resource Group Name'; expression = { $azNsg.ResourceGroupName } } | `
            Export-Csv -Path ".\$azSubName-nsg-rules.csv" -NoTypeInformation -Append -force

        # Export default rules from NSGs in your subscription
        Get-AzNetworkSecurityRuleConfig -NetworkSecurityGroup $azNsg -Defaultrules | `
            Select-Object @{label = 'NSG Name'; expression = { $azNsg.Name } }, `
            @{label = 'NSG Location'; expression = { $azNsg.Location } }, `
            @{label = 'Rule Name'; expression = { $_.Name } }, `
            @{label = 'Source'; expression = { $_.SourceAddressPrefix } }, `
            @{label = 'Source Port Range'; expression = { $_.SourcePortRange } }, Access, Priority, Direction, `
            @{label = 'Destination'; expression = { $_.DestinationAddressPrefix } }, `
            @{label = 'Destination Port Range'; expression = { $_.DestinationPortRange } }, `
            @{label = 'Resource Group Name'; expression = { $azNsg.ResourceGroupName } } | `
            Export-Csv -Path ".\$azSubName-nsg-rules.csv" -NoTypeInformation -Append -force

    }
}
' cx='32' cy='32' r='32' /%3E%3Ctext x='50%25' y='55%25' dominant-baseline='middle' text-anchor='middle' fill='%23FFF' %3ERD%3C/text%3E%3C/svg%3E)
Hi @Shashi Shailaj How the KQL Query to match NSG Inbound Rules with other Resource Group NSG Inbound Rules. If not match then fire alert
Regards,
Rahul