4,659 questions
Any news on this? @Dawid Oosthuizen
This browser is no longer supported.
Upgrade to Microsoft Edge to take advantage of the latest features, security updates, and technical support.
' cx='32' cy='32' r='32' /%3E%3Ctext x='50%25' y='55%25' dominant-baseline='middle' text-anchor='middle' fill='%23FFF' %3EDO%3C/text%3E%3C/svg%3E)
Intel® Ethernet Controller X550-AT2, 10G network interface on ASRock Rack ROMED8-2T with AMD EPYC 7232P processor.
Windows 10 Pro for Workstations, 2004.
Latest Windows updates and Intel drivers installed as of 09/09/2020.
This machine is a dual boot, the above Windows version, and Ubuntu 20.04.
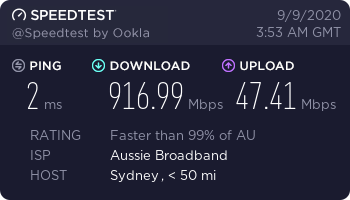
When doing a speed test, I get good performance from Ubuntu, but very poor uploads from Windows. This is on the same machine, the exact same hardware.
The WAN link is 1000Mbps down, 50Mbps up.
This is the Windows speedtest result:
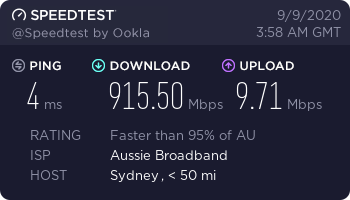
This is the Ubuntu speedtest result:
I have tried to tweak the adapter's advanced driver settings in Windows, such as disabling LSO, etc. No luck, performance remains poor.
I've also noticed it on another PC running Windows 10 Pro, and a laptop running Windows 10 Pro for Workstations, both give the same poor upload performance. Whereas my other Ubuntu 20.04 Server machine, and also my phone connected via Wi-Fi, is getting good upload speeds.
I have even taken the Windows laptop and plugged it straight into my incoming WAN connection (bypassing router), and it still gets poor upload speeds.
Incidentally, when the speed test is running, I can see that the upload looks bursty on Windows, like it is only getting chunks of data here and there, while in Linux and on Android it looks the same as the download, the graph is drawn at a consistent high rate and with consistent high values.
' cx='32' cy='32' r='32' /%3E%3Ctext x='50%25' y='55%25' dominant-baseline='middle' text-anchor='middle' fill='%23FFF' %3EFD%3C/text%3E%3C/svg%3E)
Hello,
Firewall / Antivirus in use on Windows machines?
Try running and maintaining a Clean Boot on Windows machines:
https://support.microsoft.com/en-us/help/929135/how-to-perform-a-clean-boot-in-windows
Thanks for the suggestions, unfortunately no luck:
I've added some more info in my original post, FWIW.
' cx='32' cy='32' r='32' /%3E%3Ctext x='50%25' y='55%25' dominant-baseline='middle' text-anchor='middle' fill='%23FFF' %3EM%3C/text%3E%3C/svg%3E)
Did you find a solution? I habe exactly the same problem :(
' cx='32' cy='32' r='32' /%3E%3Ctext x='50%25' y='55%25' dominant-baseline='middle' text-anchor='middle' fill='%23FFF' %3EGI%3C/text%3E%3C/svg%3E)
Hi,
Try with PDANET software. Must be installed in laptop with Windows and also in mobile. It works fine with this issue.
Guery
Hi,
Try with PDANET software. Must be installed in laptop with Windows and also in mobile. It works fine with this issue.
Guery
' cx='32' cy='32' r='32' /%3E%3Ctext x='50%25' y='55%25' dominant-baseline='middle' text-anchor='middle' fill='%23FFF' %3ELM%3C/text%3E%3C/svg%3E)
This problem has been bothering me for a long time, and I finally found out that it was a problem with speedtest.net. It limits the user-agent of edge. If you use the user-agent of edge, the upload speed is only about 5mbps.
After I used the extension to change it to the user-agent of chrome, the upload speed went up.... Fuck speedtest.net!!!
这个问题让我头疼很久, 最后发现是speedtest.net的问题. 它限制了edge的user-agent, 如果你使用edge的user-agent, 上传速度就只有5mbps左右.
在我使用扩展插件修改成chrome的user-agent以后上传速度就上去了.... 真是fuck speedtest.net !!!
Any news on this? @Dawid Oosthuizen

Hello All,
My suggestion would be to make a network trace of both scenarios and then compare them. For a problem like this, a short capture/snap length of each frame should be adequate (say 100 bytes per frame; tcpdump historically defaulted to a snaplen of 68 bytes but 96 is better when IPv6 might be in use). A trace covering a few seconds of transfer should be adequate.
It does not matter if different tools are used for the capture in the different environments and different trace file formats are used (e.g. pcap, pcapng, cap, etl); just use whatever tools are available.
One could then try to understand the differences; for example frame length, inter-frame gap, window size, etc.. Armed with that information, it would be easier to speculate about which settings might have an influence on the behaviour.
An additional help would be an Event Tracing for Windows (ETW) trace of the Microsoft-Windows-TCPIP provider covering the same period as the network trace; this should give some insight into the congestion avoidance behaviour. Some tools can collect both the network trace and the additional ETW source in a single file (Microsoft Message Analyzer, for example, could do this).
One way of creating a suitable trace is to use the following sequence of commands in a PowerShell window:
New-NetEventSession -LocalFilePath $Env:TEMP\SlowUp.etl -Name SlowUp
Add-NetEventPacketCaptureProvider -TruncationLength 100 -Level 255 -SessionName SlowUp
Add-NetEventProvider -Name "Microsoft-Windows-TCPIP" -Level 255 -SessionName SlowUp
Start-NetEventSession -Name SlowUp

[run performance test]

Stop-NetEventSession -Name SlowUp
Remove-NetEventSession
The %TEMP%\SlowUp.etl file contains the resulting trace data.
Network traces could be made available via services like Google Drive with the corresponding URL posted here...
Gary
I don't know how to do that.
Anyone else can do, who has the same problem?
I am really sure, that is currently a bug, which should be fixxed by MS.
' cx='32' cy='32' r='32' /%3E%3Ctext x='50%25' y='55%25' dominant-baseline='middle' text-anchor='middle' fill='%23FFF' %3EE%3C/text%3E%3C/svg%3E)
I am also dealing with the same issue. My download speed seem to hit max, but my upload speed stays at 1.0 mbps.
As @GaryNebbett-6715 suggested, we can benefit from a pcap trace file. I tried analyzing the files after doing so and it seems to be that the windows scaling goes flat too early.
upon googling to find if someone had similar problem, i found this post that exactly matches my scaling graph: https://serverfault.com/questions/608060/windows-tcp-window-scaling-hitting-plateau-too-early
a github issue describe similar behavior that happens with curl: https://github.com/curl/curl/issues/1485
I am still searching for a solution to this random issue, but i am afraid there might not be one at the moment.
Hello Egoist,
The receive window (in this upload scenario) is managed by the server; the Windows client has no influence over how the receive window is managed - it only has influence over its "congestion window" (and direct information about that window size is not available from a simple network trace).
My nominal upload speed is 25 Mbps and the browser-based Speedtest reports 24.51 Mbps, so there is not much that needs explanation or tuning in my case.
Looking at my network trace, Speedtest (browser version) used 4 TCP connections in parallel during the "upload" test. Reviewing the TCP Connection Summary for these connections shows something like this:
Tcb = 0xFFFFDB87419D5AA0 // Transport Control Block address
DataBytesOut = 12875970 // The number of octets of data contained in transmitted segments, including retransmitted data
DataBytesIn = 5430 // The number of octets contained in received data segments, including retransmitted data
DataSegmentsOut = 8830 // The number of segments sent containing a positive length data segment
DataSegmentsIn = 102 // The number of segments received containing a positive length data segment
SegmentsOut = 8837 // The total number of segments sent
SegmentsIn = 3158 // The total number of segments received
NonRecovDa = 0 // The number of duplicate acks (or SACKS) that did not trigger a Fast Retransmit
NonRecovDaEpisodes = 0 // The number of duplicate acknowledgment episodes that did not trigger a Fast Retransmit
DupAcksIn = 214 // The number of duplicate ACKs received
BytesRetrans = 199140 // The number of bytes retransmitted
Timeouts = 2 // The number of times the retransmit timeout has expired when the retransmission timer backoff multiplier is equal to one
SpuriousRtoDetections = 0 // The number of acknowledgments reporting segments that have already been retransmitted due to a Retransmission Timeout
FastRetran = 16 // The number of invocations of the Fast Retransmit algorithm
MaxSsthresh = 273548 // The maximum size, in bytes, of the slow start threshold, excluding the initial value
MaxSsCwnd = 390784 // The maximum size, in bytes, of the congestion window size used during "Slow Start"
MaxCaCwnd = 310079 // The maximum size, in bytes, of the congestion window used during "Congestion Avoidance"
SndLimTransRwin = 0 // The number of transitions into the "Receiver Limited" state
SndLimTimeRwin = 0 // The cumulative time, in milliseconds, spent in the "Receiver Limited" state
SndLimBytesRwin = 0 // The total number of bytes sent in the "Receiver Limited" state
SndLimTransCwnd = 76 // The number of transitions into the "Congestion Limited" state
SndLimTimeCwnd = 8838 // The cumulative time, in milliseconds, spent in the "Congestion Limited" state
SndLimBytesCwnd = 6286884 // The total number of bytes sent in the "Congestion Limited" state
SndLimTransSnd = 77 // The number of transitions into the "Sender Limited" state
SndLimTimeRSnd = 6264 // The cumulative time, in milliseconds, spent in the "Sender Limited" state
SndLimBytesRSnd = 5859134 // The total number of bytes sent in the "Sender Limited" state
ConnectionTimeMs = 15157
TimestampsEnabled = FALSE
RttUs = 38644
MinRttUs = 9623 // The minimum sampled round trip time, in microseconds
MaxRttUs = 130243 // The maximum sampled round trip time, in microseconds
SynRetrans = 0
CongestionAlgorithm = CUBIC
State = ClosedState
LocalAddressLength = 16
LocalAddress = 192.168.0.10:63097
RemoteAddressLength = 16
RemoteAddress = 195.49.6.4:8080
CWnd = 52436
SsThresh = 27798
RcvWnd = 130438
RcvBuf = 131400
SndWnd = 390784
Looking at the raw captured packets and correlating them with the ETW data, one can easily spot the 77 occasions when there was no data to send (the application had not called "send" fast enough) and the 76 bouts of congestion.
Gary