Azure Virtual Machines
An Azure service that is used to provision Windows and Linux virtual machines.
9,040 questions
This browser is no longer supported.
Upgrade to Microsoft Edge to take advantage of the latest features, security updates, and technical support.
' cx='32' cy='32' r='32' /%3E%3Ctext x='50%25' y='55%25' dominant-baseline='middle' text-anchor='middle' fill='%23FFF' %3EAM%3C/text%3E%3C/svg%3E)
I need to query all the VMs metrics that Monitor has at the same time (CPU, memory etc) to obtain utilization by hour.
I can accomplish this in AWS with Cloudwatch metric math but I'm having difficulty doing the same in Azure. The only way I have been able to identify is going resource by resource but that creates a high number of calls.
thank you

If you are trying to export the metrics via the metrics API, then the answer is no. This request is done per resource.
If you are sending the metrics to Log Analytics, then you can query the logs via the query API. The results of this can be shaped to your requirements. Please note that there is still limits, such as
I hope this answers your question.
Alistair

1 pint of beer to this gentleman for the right answer :)
' cx='32' cy='32' r='32' /%3E%3Ctext x='50%25' y='55%25' dominant-baseline='middle' text-anchor='middle' fill='%23FFF' %3EKM%3C/text%3E%3C/svg%3E)
Hello, @Alberto Mijares (Tantius) !
Outside of using the metrics API as mentioned by @Alistair Ross , there are a number of options available for viewing VM metrics (including CPU and memory) at once that may work for you.
How do I view or export Azure Monitor metrics (CPU utilization, Memory, etc.) for all VMs at once?
There are a good number of options when it comes to viewing Azure Monitor metrics for your VMs. These are just a couple:
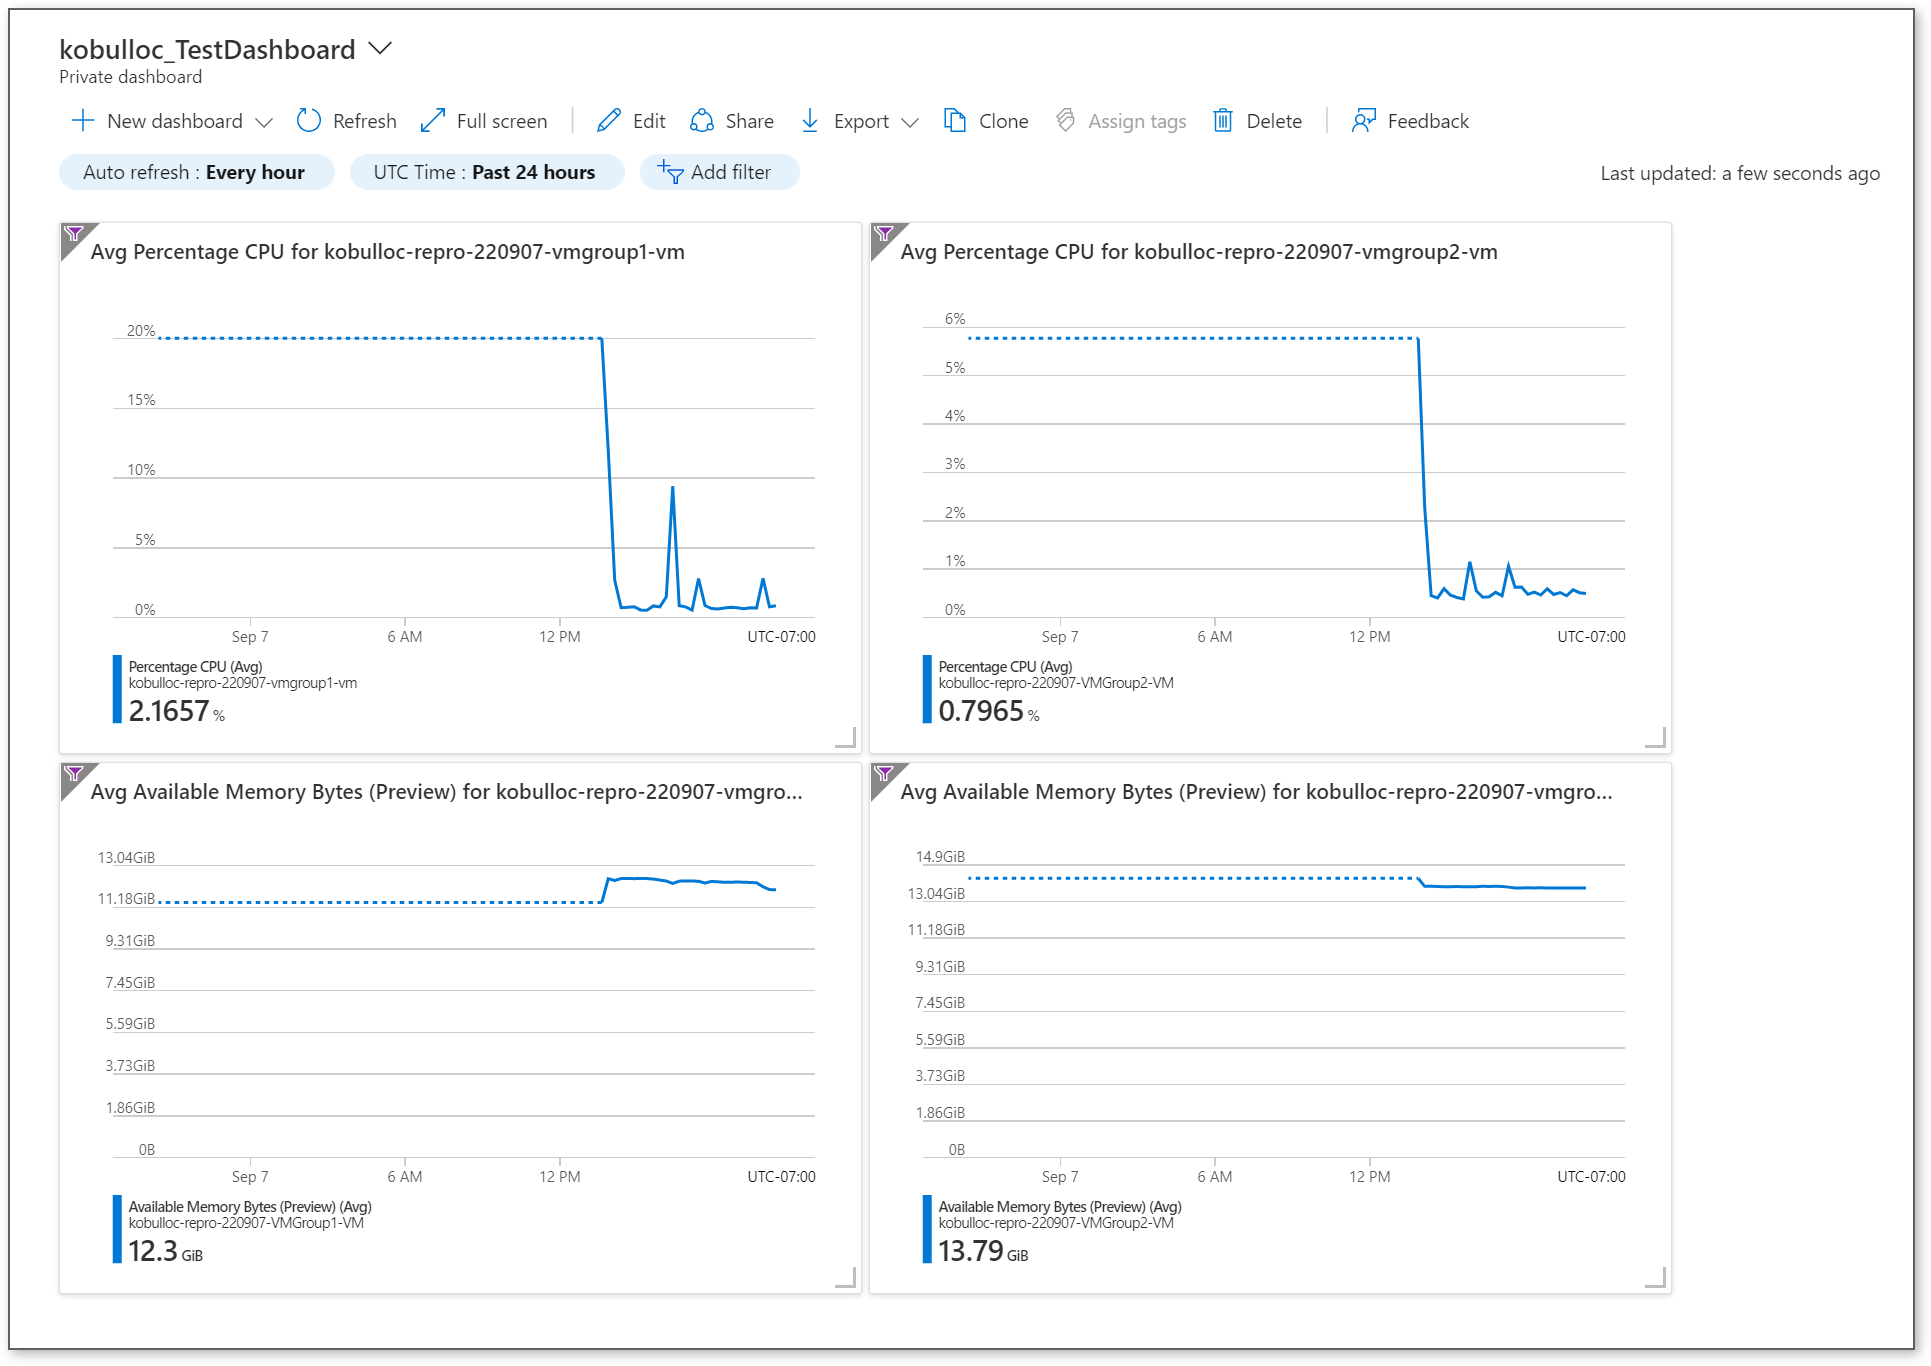
1. Custom Dashboards and Azure Metrics Explorer
Dashboards are extremely helpful when collecting data and creating your own custom dashboard is a good way to get exactly the information you are interested in, especially if you pin a custom query. Here I've created a custom dashboard to show Average CPU Percentage as well as Average Available Memory for two VMs that are in different regions (and in separate scopes):
Create a dashboard in the Azure portal
View multiple resources in the Azure metrics explorer
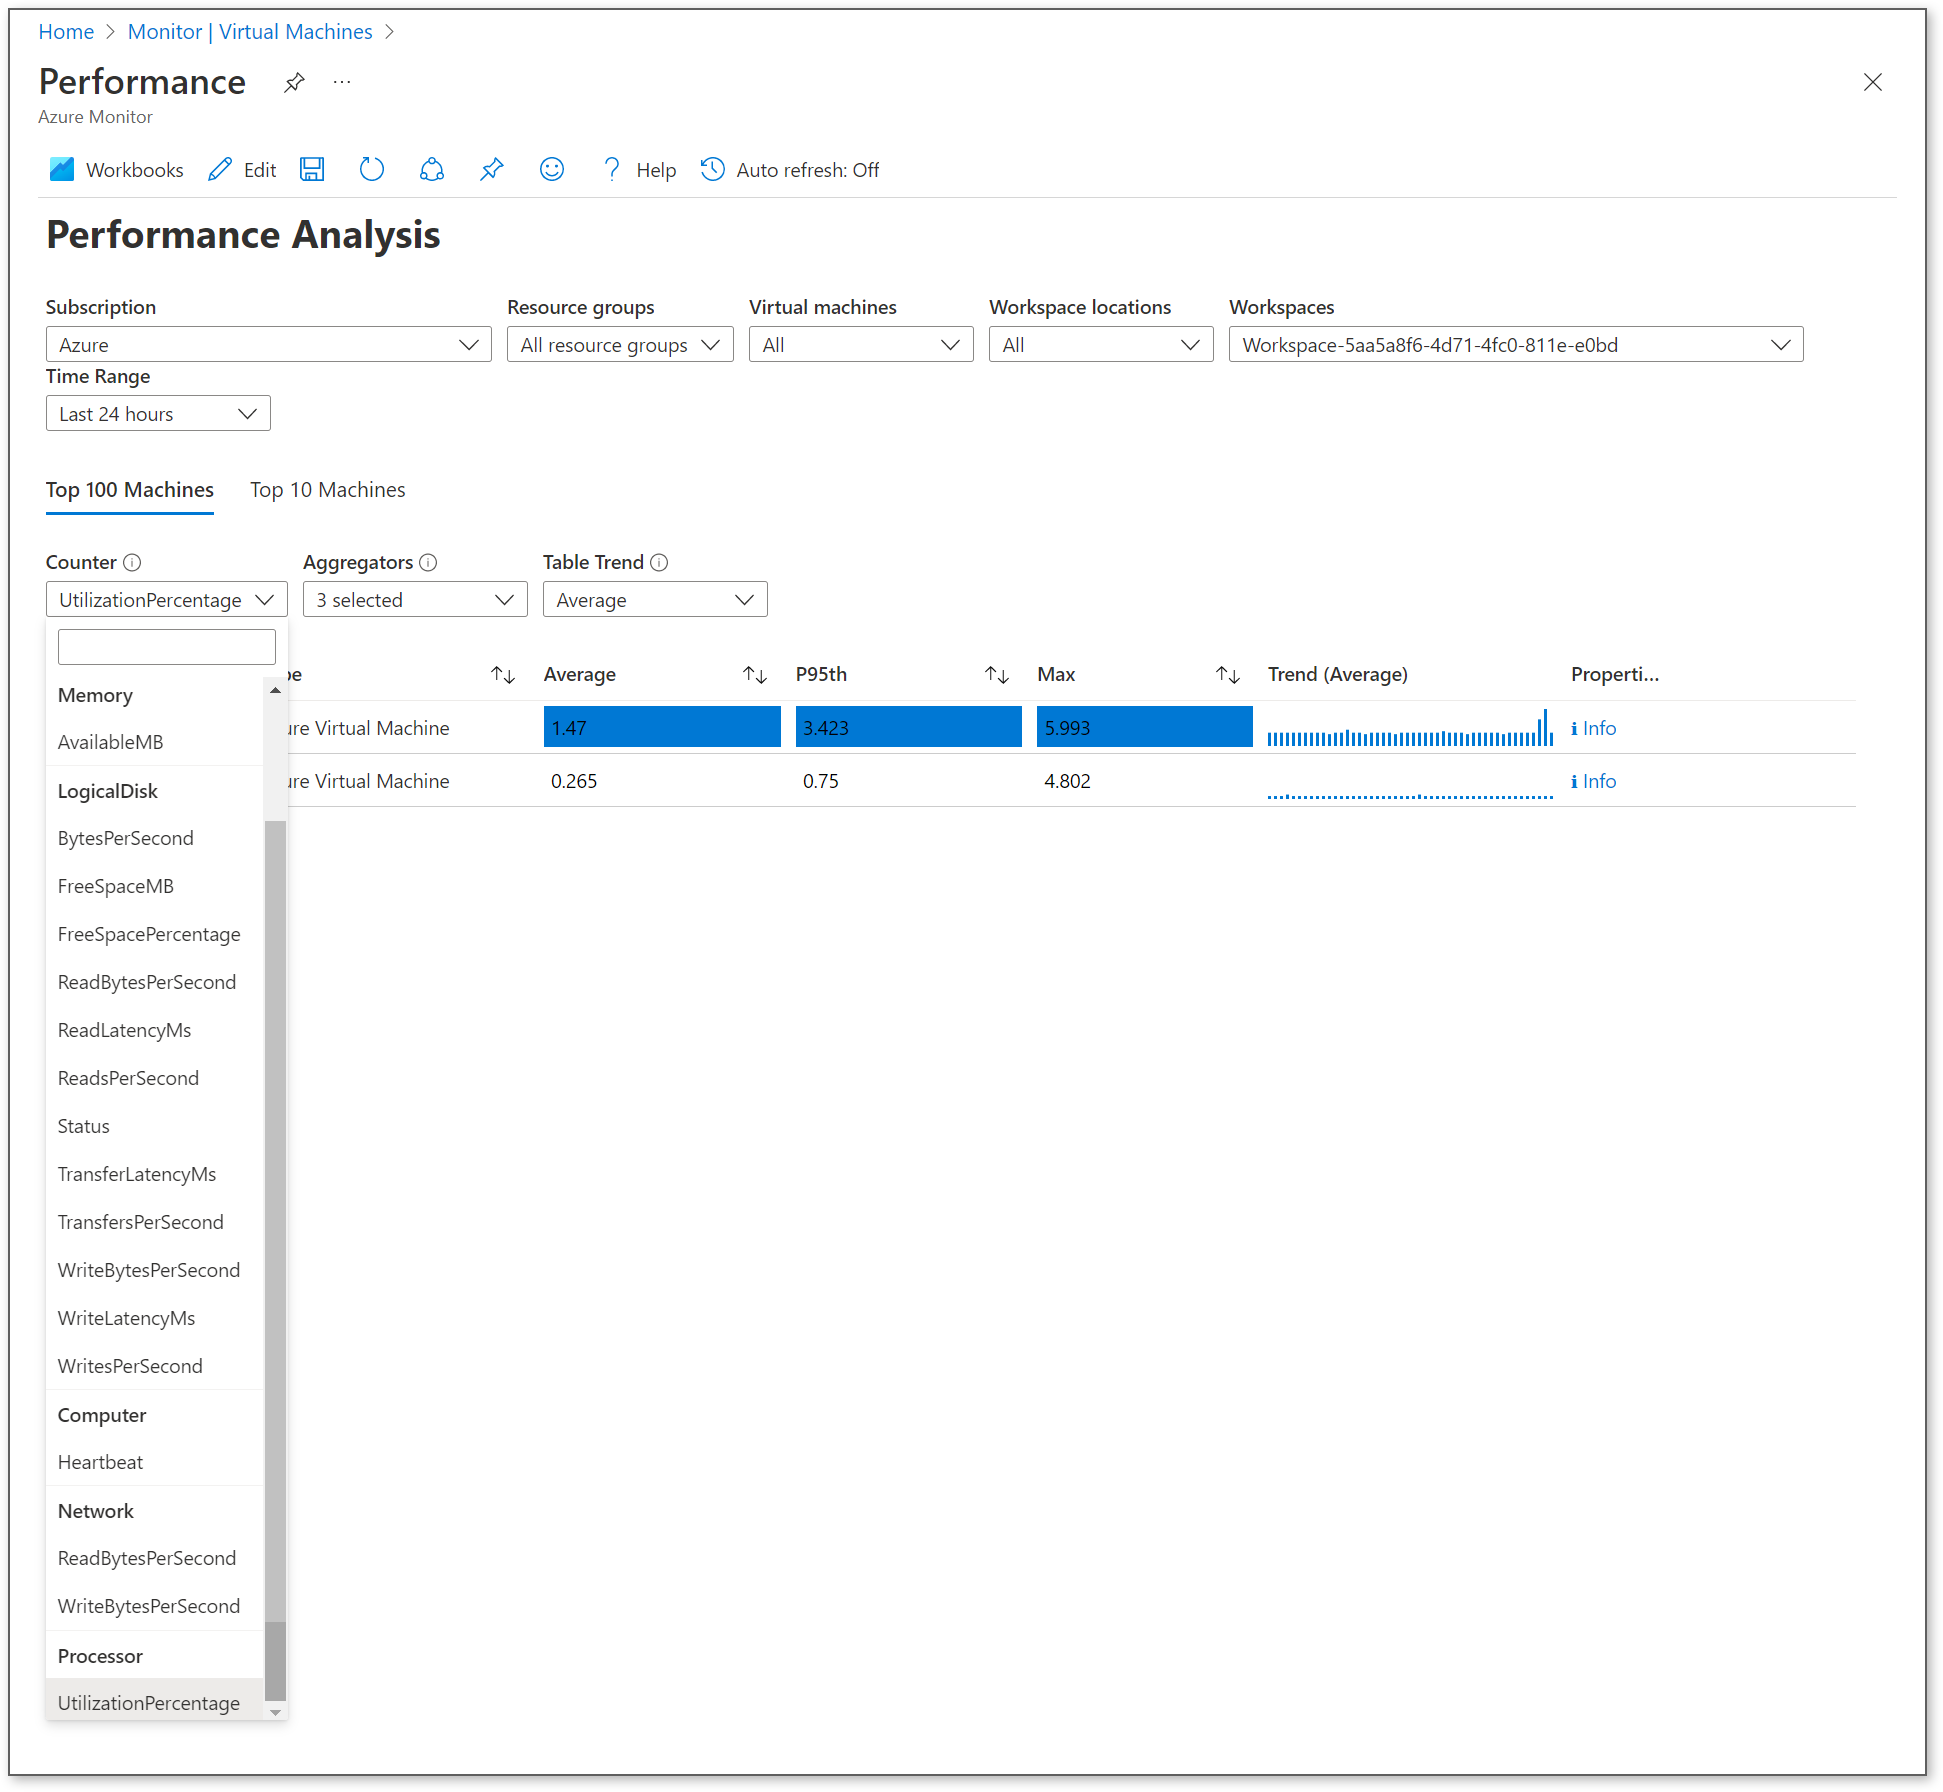
2. VM Insights
VM Insights includes pre-built workbooks that allow you to monitor your entire set of Azure and hybrid virtual machines in a single interface. While there is no direct cost for VM insights, you are charged for its activity in the Log Analytics workspace. Here I've added two VMs from two separate resource groups into a workspace and I'm showing data for each VM's CPU utilization percentage. Note that I can filter by subscription, resource group, specific VMs, workspace locations, or workspaces as I am in this example:
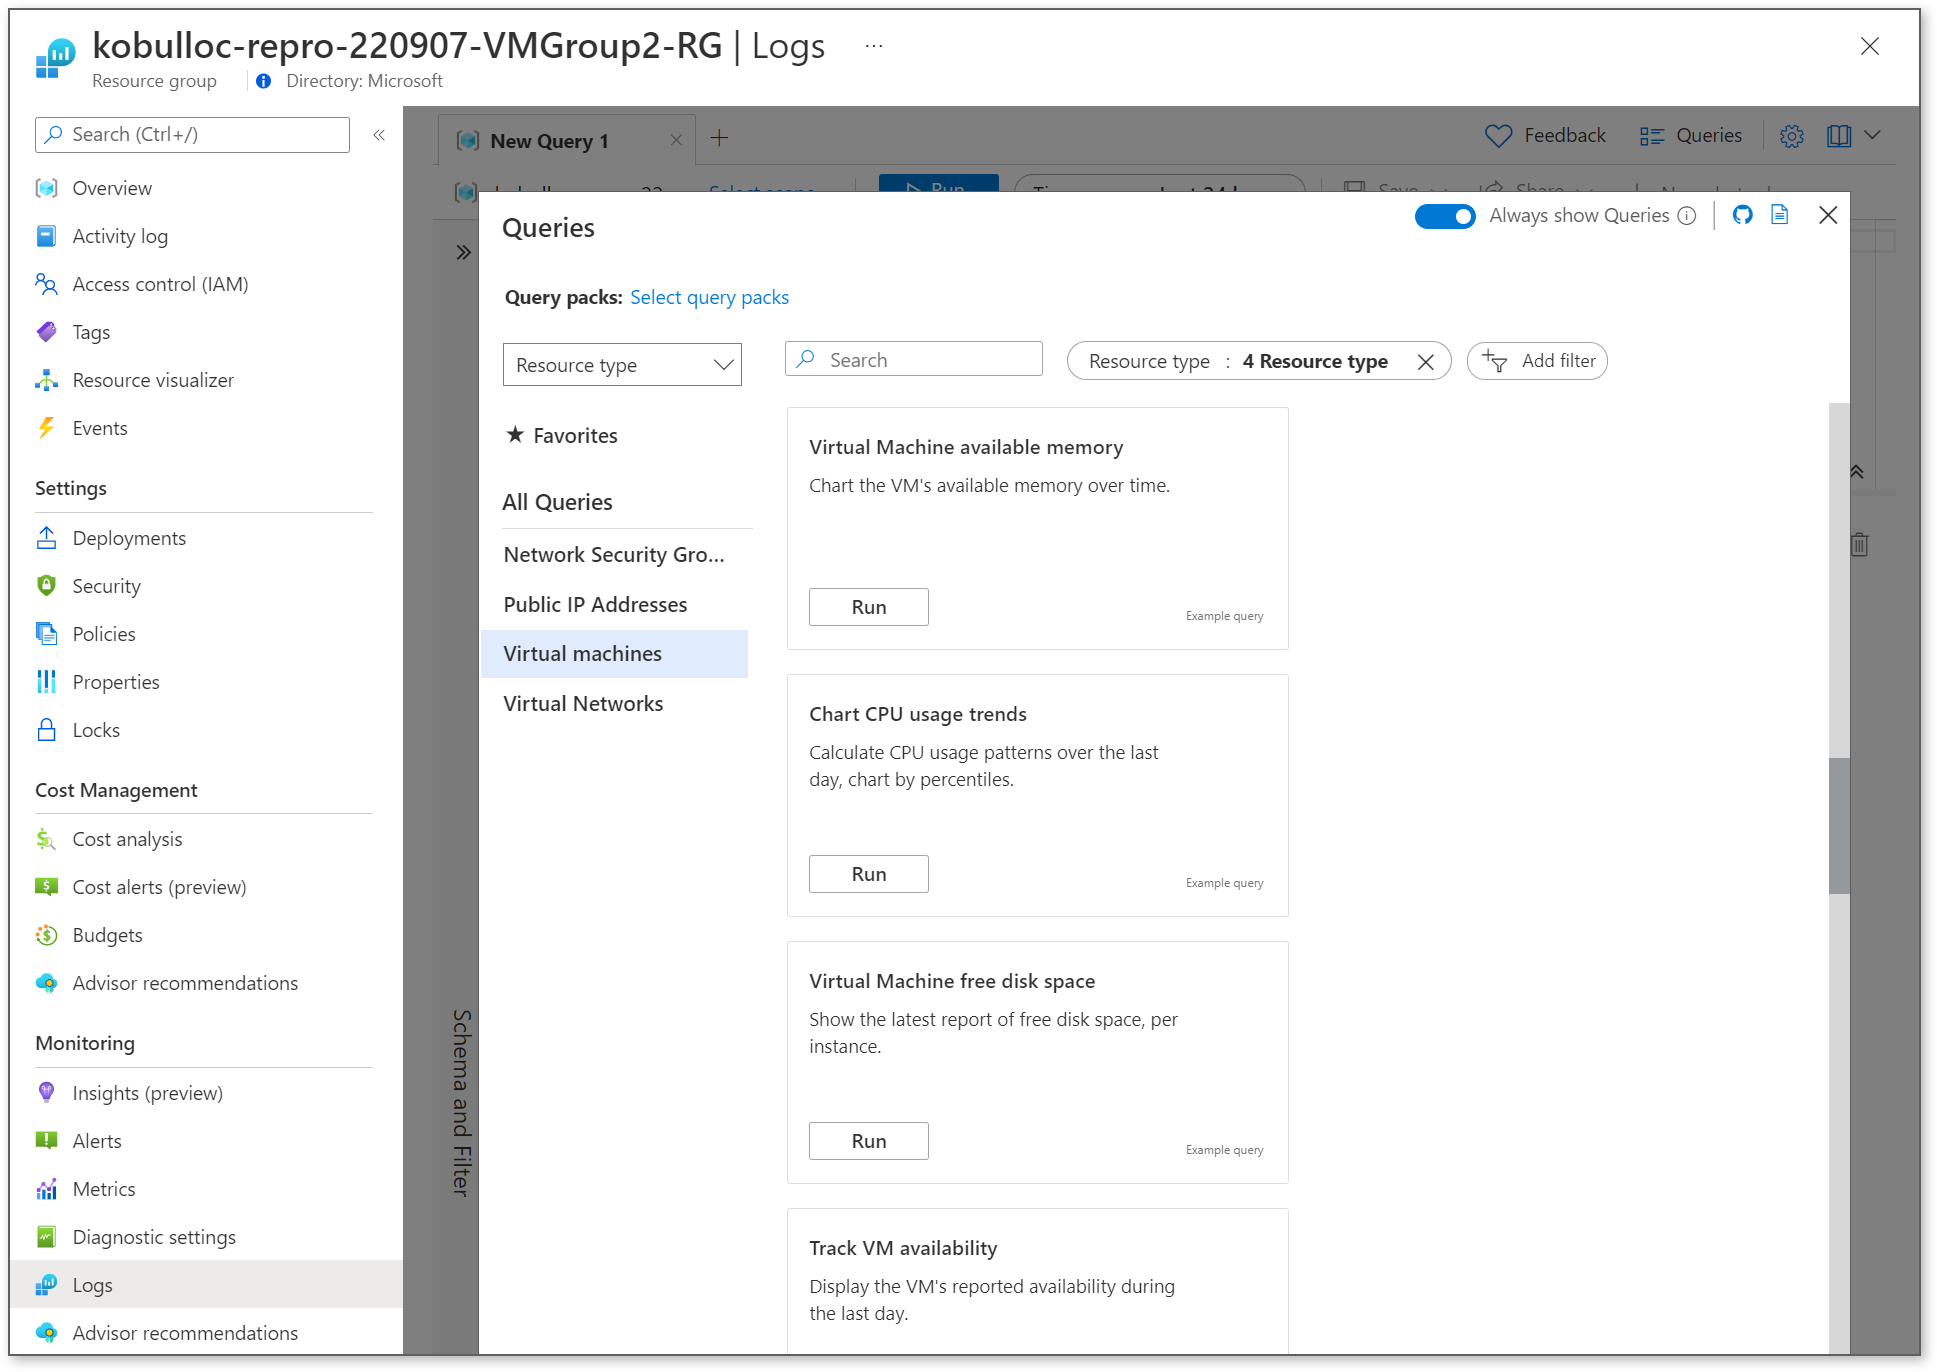
3. Log Analytics and Custom Queries
This is probably the best option for what you are looking for but it does require a bit more query knowledge to fully take advantage of although the built in queries will address things like CPU usage and memory. If you are looking for a custom query, let us know so we can assist you with the Kusto (KQL) needed.
Additional Reading: