Note
Access to this page requires authorization. You can try signing in or changing directories.
Access to this page requires authorization. You can try changing directories.
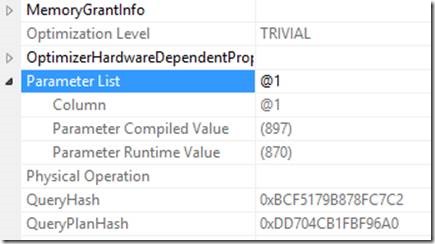
In Denzil’s recent post about correlating XE query_hash he alluded to a relatively common issue. Most of the time a proc will run just fine, but sometimes it will run very slow. This is an issue that I tend to be seeing often as of late. A common cause for this type of situation is parameter sniffing. Parameter sniffing is when the parameter values with the cached plan vary enough from the actual parameters passed that the cached plan is inefficient for the actual parameters sent (though it is efficient for the cached parameters). This is often due to uneven data distribution which I will show in the below example. While I am just showing data skew in this demp, there are many other contributing factors to parameter sniffing such as variable values not known at compile time, code branching, etc. The key point here is that it is not always easy to pinpoint when a particular proc goes awry, but once you are able to catch it, it is typically pretty easy to tell if parameter sniffing is a possible suspect. You can simply look at the actual execution plan to see the runtime vs compiled parameter values:
Right click and select properties on the plan
Or look at the parameter list in the XML
A very common cause for this is data skew. For example, in the AdventureWorks2012 database, let’s create a proc to help us illustrate:
CREATE PROCEDURE Sales.usp_GetSalesOrders
(
@ProductID INT
)
AS
BEGIN
SELECT *
FROM Sales.SalesOrderDetail
WHERE ProductID = @ProductID
END
GO
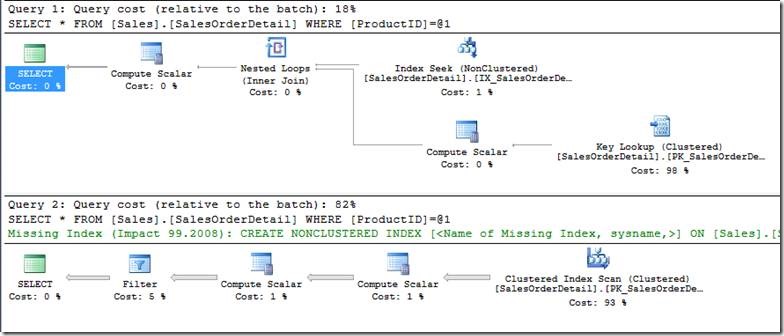
Consider 2 possible input parameter values of 897 and 870. ProductID = 897 yields 2 records while ProductID 870 yields 4688. They would also ideally yield separate execution plans which you can see by running the selects showing the actual execution plans:
SELECT *
FROM Sales.SalesOrderDetail
WHERE ProductID = 897
GO
SELECT *
FROM Sales.SalesOrderDetail
WHERE ProductID = 870
GO
There are 2 different plans that are the most efficient for each of these. For the first one, performing an index seek on a nonclustered index on ProductID and key lookup is the best choice, but in the second one, it is cheaper to simply to a clustered index scan. This is due to data skew. You can see the data skew by looking at DBCC SHOW_STATISTICS where I have pasted the output below. You will notice that the number of rows equal to 870 is 4688 while there are only 227 records within the range of 895-897. I have circled these in the screenshot below.
Now if I run the stored procedure that we created, depending on which one of these two you run first, the plan for those compiled values will be what is in the plan cache. Let’s run the proc and see the actual execution plans and the statistics io output. Note that I am freeing the proc cache to clear out cached plans. This can have adverse performance impact on a production system, so please run this test in a non-prod environment.
SET STATISTICS IO ON
GO
DBCC FREEPROCCACHE
GO
EXECUTE Sales.usp_GetSalesOrders
@ProductID = 897
GO
EXECUTE Sales.usp_GetSalesOrders
@ProductID = 870
GO
You will see they both use the same plan because it is cached with 897 as the compile time parameter.
Parameters for the second plan:
Note the statistics IO for the two executions respectively we will revisit that again shortly:
(2 row(s) affected)
Table 'SalesOrderDetail'. Scan count 1, logical reads 10, physical reads 0, read-ahead reads 0, lob logical reads 0, lob physical reads 0, lob read-ahead reads 0.
(4688 row(s) affected)
Table 'SalesOrderDetail'. Scan count 1, logical reads 14379, physical reads 0, read-ahead reads 0, lob logical reads 0, lob physical reads 0, lob read-ahead reads 0.
Now we will simply run them in the opposite order (clearing out the proc cache first). You will see the exact opposite effect here as the previous run.
SET STATISTICS IO ON
GO
DBCC FREEPROCCACHE
GO
EXECUTE Sales.usp_GetSalesOrders
@ProductID = 870
GO
EXECUTE Sales.usp_GetSalesOrders
@ProductID = 897
GO
You will see that we are now doing a clustered index scan as that is the most efficient for the ProductID of 870
Parameters for the second plan:
Since we are scanning the clustered index, the statistics IO output is identical for both calls:
Table 'SalesOrderDetail'. Scan count 1, logical reads 1240, physical reads 0, read-ahead reads 0, lob logical reads 0, lob physical reads 0, lob read-ahead reads 0.
As you can see, for ProductID 897, the 1240 reads is much less efficient than the 10 reads it was able to do when 897 was the compile time parameter. The converse is true for ProductID 870 as it definitely benefits from doing a table scan with 1240 reads instead of 14379 reads required for the nonclustered index seek and all the key lookups.
This is a very simple way to identify parameter sniffing, especially if you are able to run the stored procedures in a production-like test environment with the parameter values in question. I know you will now ask “how to I solve this”. There are really a number of possible solutions that will depend on your specific scenario. Ideally, there can be index or query changes to produce a plan that is best for all parameter value scenarios. This is not always a possibility, so some other options are as follows:
· OPTION (RECOMPILE)
· Create the procedure WITH RECOMPILE
· Plan Guide
· Create separate stored procedures (more on this option below)
One of the biggest culprits I see is the all in one search proc where you have a WHERE clause that looks like the following:
WHERE
@Param1 is null or @Param1= Field1 AND
@Param2 is null or @Param2= Field2 AND
@Param3 is null or @Param3= Field3 AND…
In a case such as this one, you may even want to consider using separate stored procedures or building a dynamic SQL statement and executing it with sp_executeSQL. When I mention using “Separate stored procedures”, what I mean is that you have a parent stored proc that evaluates the input parameters and calls another stored procedure optimized for a particular set of parameters. You would typically have a few optimized stored procedures that can be called for the most common scenarios as well as a catch-all within the main proc for the rest. Another option for this is to use the OPTION (RECOMPILE) as well. It is always best to test out multiple solutions to see what will be the best for your scenario.
Lisa Gardner – Premier Field Engineer
@SQLGardner
Comments
Anonymous
September 11, 2013
Great post! Going to be passing this around to folks a lot. One thing - I wish we wouldn't use the "Back to Basics" phrase, because when somebody reads this, it's not basics to them. It's kinda mean to people who are getting started on their journey, heh. I'll give you an example - I usually work in rooms full of people ranging from developers to DBAs to management. When I find a parameter sniffing problem, and I want to pull up a link explaining the issue, I don't want it to say "Back to Basics" at the top of the screen. Managers see that and say, "My staff doesn't even understand the basics." While that might be true (man, I wish I had a buck for every time I saw auto-shrink - oh wait, I do), it's not the message I want to convey to the reader. Someone reading this isn't going back to basics - they're unlocking a new achievement of understanding. :-D But great post! I wouldn't have mentioned this if I didn't plan on referring back to it a lot.Anonymous
September 11, 2013
Thanks for the feedback Brent, am glad you enjoyed the article, Lisa did a good job. There is no slight meant against anyone who is new to parameter sniffing, we were all new to SQL at some point of time - it was meant to reflect that there wasn't a gotcha per say here like some of the others that have some twist or edge case. But will definitely keep that feedback in mind in future.Anonymous
September 11, 2013
I greatly appreciate the constructive feedback, Brent. The "back to basics" point is meant that this is not a new issue and an extremely common and overlooked problem, but I can understand your interpretation. Please do pass along the post as this is such a common issue!Anonymous
September 13, 2013
The comment has been removedAnonymous
September 13, 2013
The comment has been removedAnonymous
September 15, 2013
The comment has been removedAnonymous
September 17, 2013
Great Post! It might be helpful to clarify the data skew. I think this text "...while there are only 227 records within the range of 895-897" should be "...while there are only 227 records within the range of 895-898" and maybe even note that 9 records are for 898. Which column is the clustered index on this table? Does the optimizer choose the clustered index because it decides a large percentage of the table's rows will need to be read anyway since 4688 rows is more than some percentage of the rows in the table (and also because the data retrieved is all the columns in the table, not just columns that are part of an index)?Anonymous
September 19, 2013
Great comments Kevin! Rob - this is AdventureWorks works DB so go ahead and check it out and test some different options! You are correct on the select list being very important as if the index is covering it will not need to use the clustered index at all. Thanks for the comments!Anonymous
June 02, 2014
Really useful Post, thank you for taking time to write this!


