Note
Access to this page requires authorization. You can try signing in or changing directories.
Access to this page requires authorization. You can try changing directories.
AKS desktop includes an integrated troubleshooting suite called Insights, powered by Inspektor Gadget, an open-source eBPF (extended Berkeley Packet Filter)-based debugging tool. Without modifying your code or restarting anything, it lets you understand network traffic between pods, trace DNS failures, and explore running processes to spot unexpected or resource-heavy activity, all through an intuitive UI with a few clicks.
This article walks you through enabling Insights and using it to diagnose common application issues in your AKS cluster.
Important
AKS preview features are available on a self-service, opt-in basis. Previews are provided "as is" and "as available," and they're excluded from the service-level agreements and limited warranty. AKS previews are partially covered by customer support on a best-effort basis. As such, these features aren't meant for production use. For more information, see the following support articles:
Prerequisites
- AKS desktop installed and signed in to your AKS cluster. See Set up an AKS cluster for AKS desktop or Deploy applications with AKS Automatic using AKS desktop.
- Cluster admin or equivalent Role-Based Access Control (RBAC) permissions on the target AKS cluster. Installing Inspektor Gadget requires creating a
ClusterRole,ClusterRoleBinding, and a privilegedDaemonSet. - Your cluster nodes must run Linux with kernel version ≥ 5.4. Windows node pools aren't supported.
- If your cluster uses Azure Policy or OPA Gatekeeper with restricted pod security, add an exemption for the
gadgetnamespace to allow privileged pods. - The target cluster must be an AKS Standard cluster.
Enable Insights in AKS desktop
Launch the AKS Desktop application and ensure you're signed in and connected to your AKS cluster.
From the left-hand navigation, select Settings.
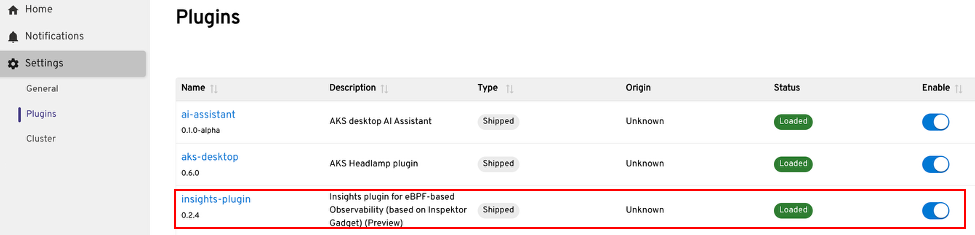
From the Settings menu, select Plugins.
Locate the Insights plugin in the list, and select the Enable toggle.
Access Insights for your Project
In the left-hand navigation, select the Project you want to use Insights with. The Insights tab will now be visible in the Project view.
Deploy Inspektor Gadget to the cluster
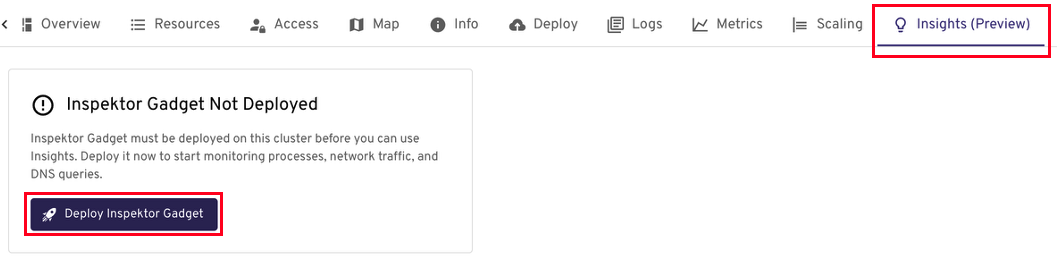
On the Insights tab, you're prompted to deploy Inspektor Gadget to your cluster if it isn't already installed.
- Select Deploy Inspektor Gadget. AKS desktop deploys the Inspektor Gadget DaemonSet to the
gadgetnamespace on your cluster. - Wait for the deployment to complete. A status indicator confirms when Inspektor Gadget is ready.
View Insights data
Once Inspektor Gadget is deployed, the Insights tab populates with live observability data from your cluster. See What you can do with Insights for the full set of capabilities.
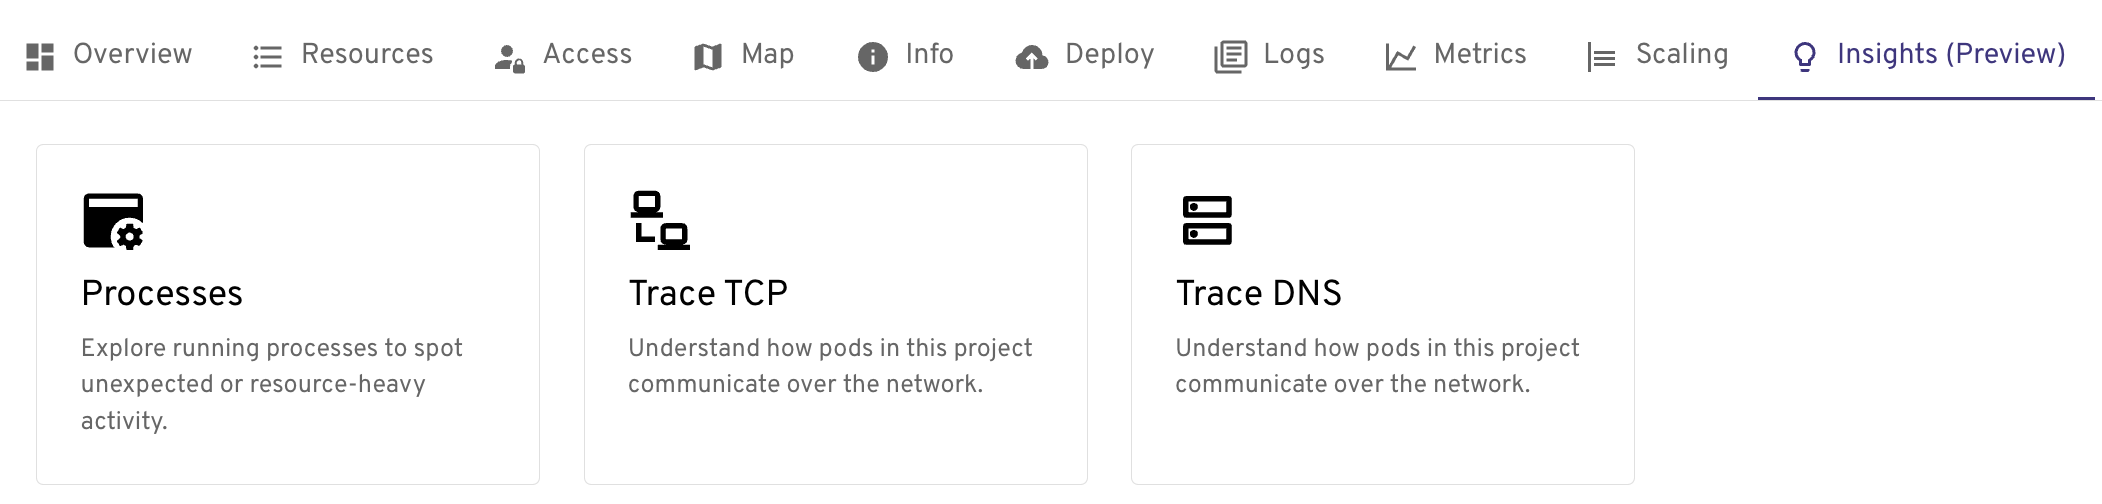
What you can do with Insights
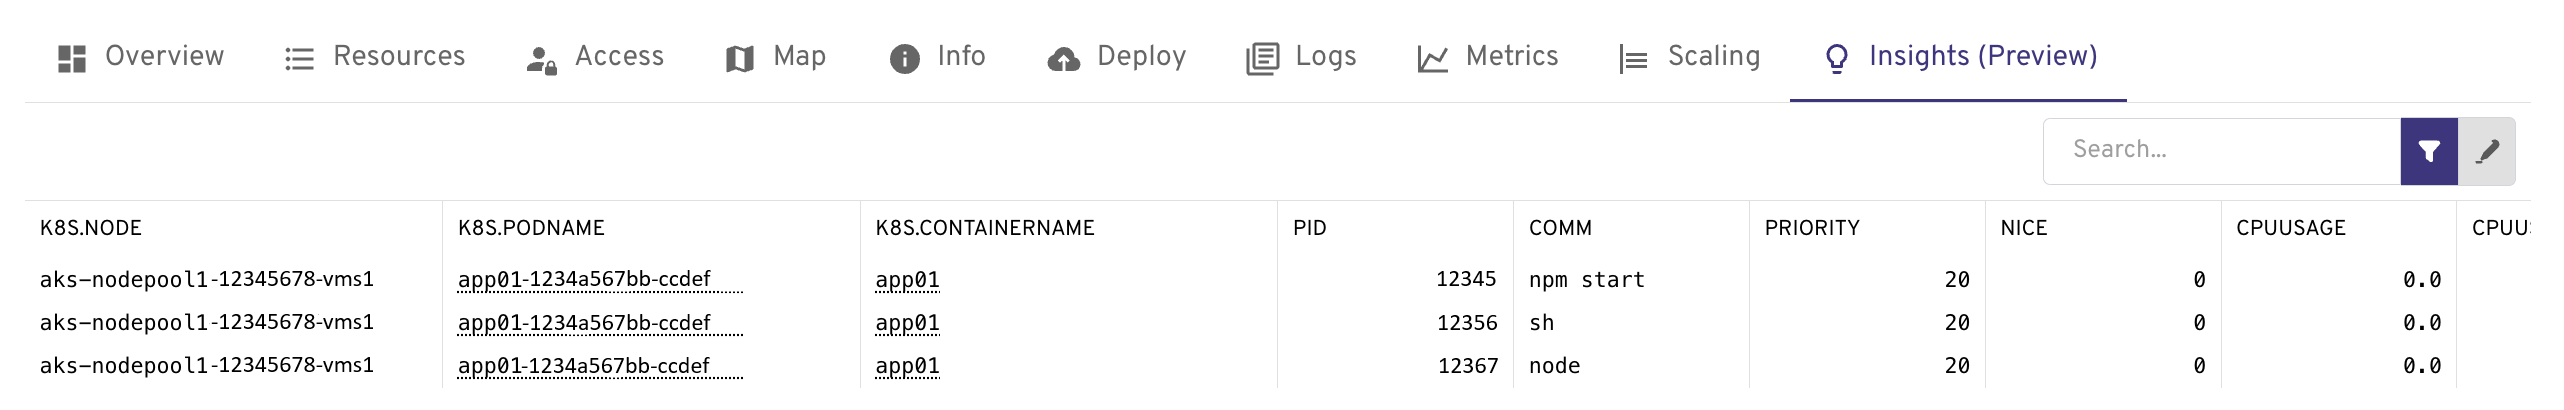
Performance troubleshooting with Processes
The Processes view shows you every running process across your cluster's pods in real time, along with CPU, memory, and disk I/O usage. Use it to:
- Identify which pods are consuming excessive CPU or memory.
- Spot abnormal block I/O activity, for example, unusually high disk reads or writes that can indicate a misconfigured app, a runaway log writer, or a storage bottleneck.
- Detect unexpected processes that shouldn't be running in a container.
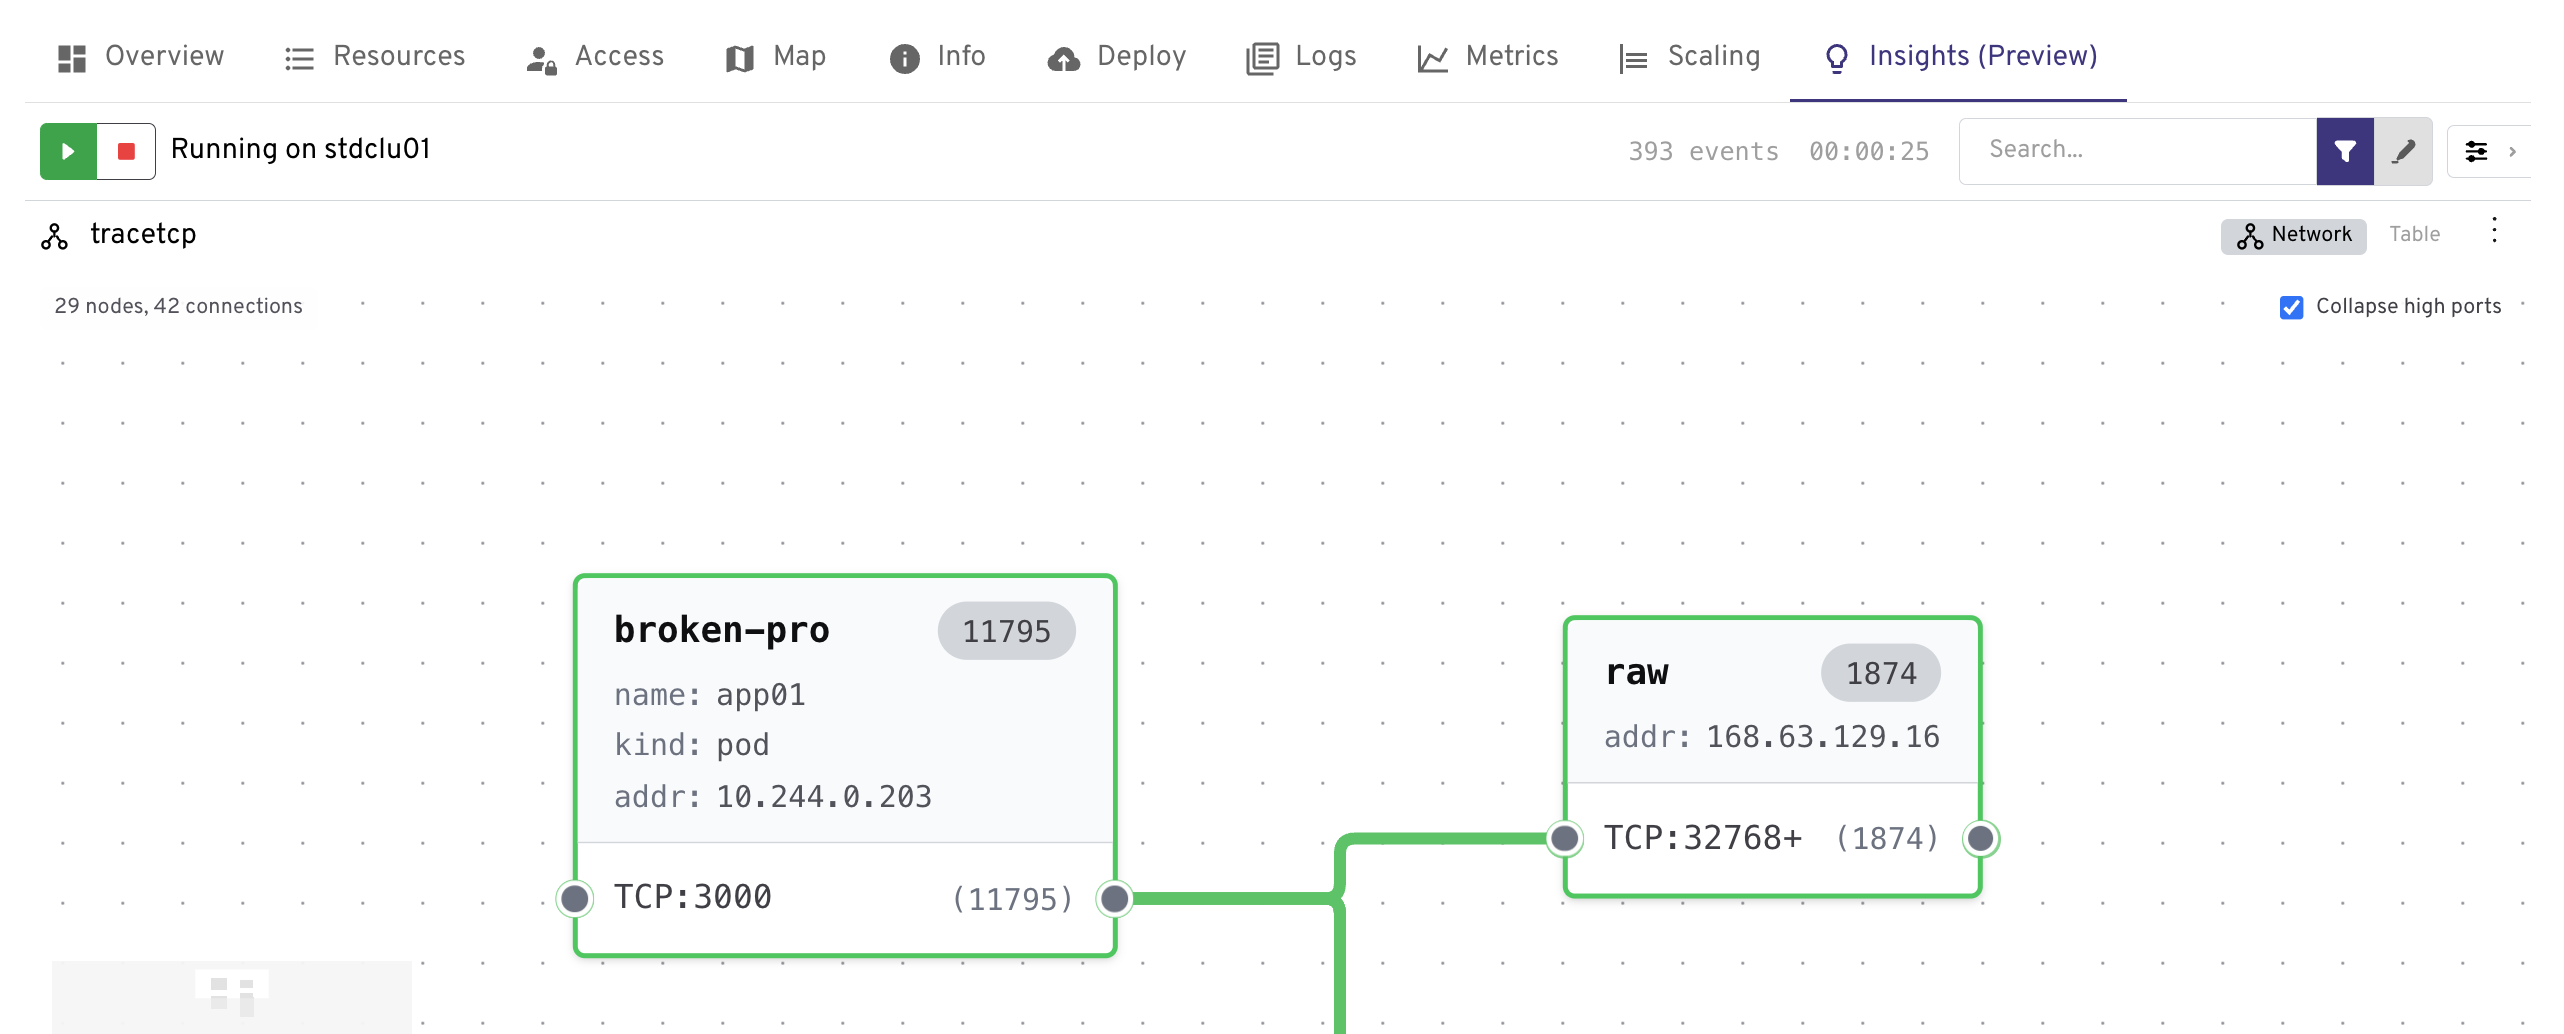
Network visibility with Trace Transmission Control Protocol (TCP)
Trace TCP captures live TCP connection events at the kernel level using eBPF, without a proxy or sidecar. Use it to:
- See which pods are opening outbound connections and to which destination IPs and ports.
- Detect unexpected or unauthorized connections that might indicate a misconfiguration or security issue.
- Correlate network anomalies with specific pods or workloads.
Note
You must stop the trace when finished, select the red stop button in the top-right of the trace.
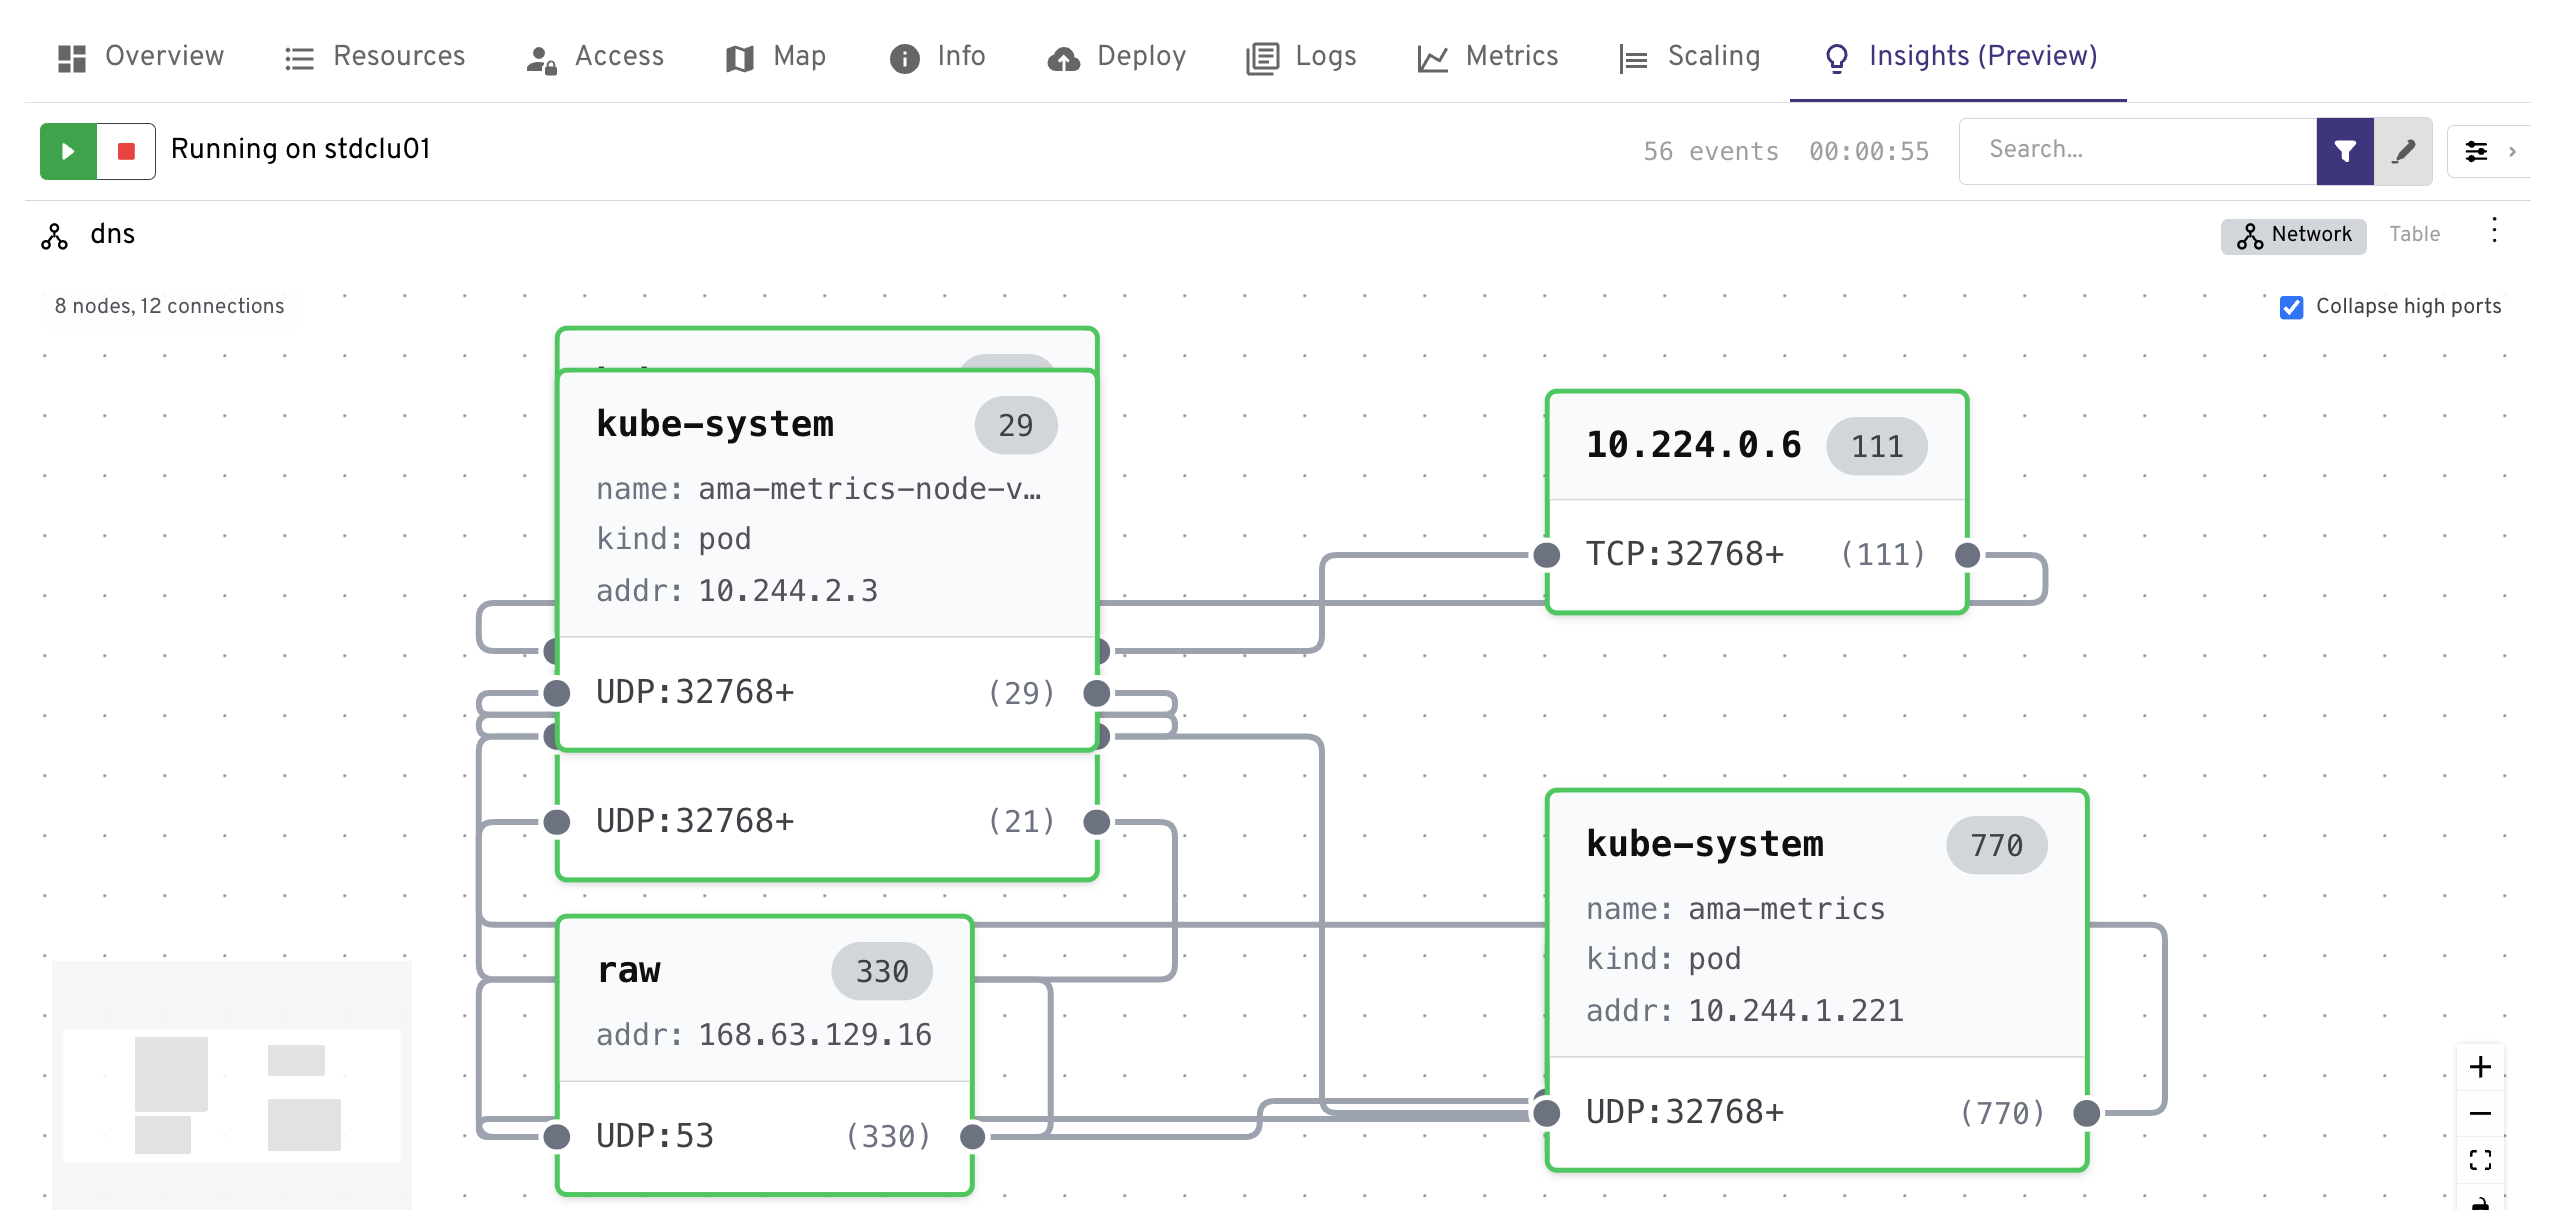
Solve DNS issues with Trace DNS
Trace DNS captures every DNS query and response made by pods in your cluster. Use it to:
- Identify DNS queries that are failing to resolve, a common cause of pod-to-service connectivity failures.
- Measure DNS latency to determine whether CoreDNS (the in-cluster DNS server) or an upstream DNS resolver is slow.
- Check the health of CoreDNS and whether external DNS resolution is working correctly.
Note
You must stop the trace when finished, select the red stop button in the top-right of the trace.
Uninstall Inspektor Gadget
Remove Inspektor Gadget from your cluster by deleting the gadget namespace. This removes all Insights data and functionality, so only do this when you no longer need any of the Insights features.
kubectl delete ns gadget
Warning
This command removes all resources in the gadget namespace, not only those created by Inspektor Gadget.
Troubleshooting issues with Insights
The following table outlines common issues you might encounter when using Insights along with their resolutions:
| Issue | Resolution |
|---|---|
| Insights tab isn't visible | Ensure the Insights plugin is enabled. Go to Settings > Plugins and toggle Insights on. |
| Deployment of Inspektor Gadget fails | Verify you have sufficient RBAC permissions to create DaemonSets and ClusterRoles in the cluster. |
| No data appears after deployment | Confirm the cluster nodes are running a supported Linux kernel (≥ 5.4). Check the Inspektor Gadget pod logs for errors. |