Note
Access to this page requires authorization. You can try signing in or changing directories.
Access to this page requires authorization. You can try changing directories.
Container network logs in Advanced Container Networking Services for Azure Kubernetes Service (AKS) give you visibility into every network flow within your cluster. Metrics tell you what is happening in your network (bandwidth usage, error rates). Logs tell you why: who initiated a connection, what protocols were used, and whether traffic was allowed or blocked.
These logs capture metadata for every network flow:
- Source and destination IP addresses, pod names, and service names
- Namespaces, ports, and protocols
- Traffic direction and policy verdicts
With this context, you can correlate network behavior with specific workloads, troubleshoot connectivity, validate security policies, and perform forensic analysis. Container network logs cover Layer 3 (IP), Layer 4 (TCP/UDP), and Layer 7 (HTTP/gRPC/Kafka) traffic.
To manage data volume and cost, container network logs support flow log aggregation, which groups similar flows into summarized records instead of storing one record per connection event. You keep the operational patterns you need while cutting storage and ingestion costs. For more information, see Flow log aggregation.
Container network logs offer two modes:
- Stored logs - Continuous collection with custom filters and flow aggregation. Best for long-term monitoring and analysis.
- On-demand logs - Real-time capture through the Hubble CLI and Hubble UI. Best for ad-hoc troubleshooting.
Use stored logs when you need persistent records for compliance, trend analysis, or automated alerting. Use on-demand logs when you're actively debugging a connectivity or performance issue and need immediate visibility into live traffic.
Stored logs
Stored logs mode is enabled automatically whenever Advanced Container Networking Services is enabled on a cluster. The capability is in place, but no logs are generated until you tell ACNS what to capture.
To start collecting logs, define ContainerNetworkLog custom resources that specify which traffic to monitor: by namespace, pod, service, protocol, or verdict. Once a CRD is applied, the Cilium agent begins generating flows that match its filters and writes them to each node. Collection stays active until you remove the CRDs or disable ACNS.
Because you control exactly which traffic is logged through CRD filters, you can focus on the flows that matter and avoid collecting unnecessary data. Combined with flow log aggregation, this approach keeps storage costs predictable and analysis focused.
How stored logs mode works
Advanced Container Networking Services uses eBPF technology with Cilium to capture network flows on each node. Once ACNS is enabled and a ContainerNetworkLog custom resource is applied, the Cilium agent collects traffic that matches the filter and writes logs in JSON format to /var/log/acns/hubble/events.log on each host. Log generation runs entirely inside the cluster and doesn't depend on Azure Monitor.
For production use, we recommend enabling the Azure Monitor add-on. When enabled, Container Insights agents collect host-local logs, apply throttling limits, and send them to a Log Analytics workspace, where you get long-term retention, KQL queries, and the built-in Azure portal and Grafana dashboards. This is the most integrated path and the one most customers should choose.
If your team has an existing observability pipeline, you can instead forward the same host-local logs to any OpenTelemetry-compatible collector or logging service — either alongside Azure Monitor or in place of it.

For more information about throttling and Container Insights, see the Container Insights documentation.
Using container network logs with or without Azure Monitor
You can consume container network logs in two ways. The right choice depends on whether you want an integrated Azure-native experience or you already have an observability pipeline you want to keep using.
| Path | What you get | When to choose it |
|---|---|---|
| Azure Monitor add-on (recommended) | Container Insights collects host-local logs into a Log Analytics workspace. You get long-term retention, KQL, the built-in Azure portal dashboards, and managed Grafana dashboards out of the box. | You want the most integrated, production-ready experience on AKS with minimal setup. |
| Host-local files with your own pipeline | ACNS writes JSON logs to /var/log/acns/hubble/events.log on each node. You forward them to any OpenTelemetry-compatible collector or logging service — alongside Azure Monitor or in place of it. |
You already have a centralized observability platform and want network logs to land there. |
For most customers, we recommend enabling Azure Monitor. It's the fastest way to get retention, query, and dashboard capabilities without building your own pipeline.
Key capabilities of stored logs mode
Customizable filters. Define
ContainerNetworkLogcustom resources to filter by namespace, pod, service, port, protocol, verdict, or traffic direction. Only matching traffic is logged, so you get precise control over what's collected and what it costs.Flow log aggregation. Similar flows are automatically grouped into summarized records every 30 seconds, cutting data volume while preserving operational signals like service communication patterns, error rates, and security verdicts. Paired with targeted filters, aggregation lets you maintain broad visibility without excessive ingestion costs. For more information, see Flow log aggregation.
Log storage options. ACNS always writes logs locally on each node. From there, you can choose how to consume them:
Host-local files (always on): Logs are stored on host nodes at
/var/log/acns/hubble. Files auto-rotate at 50 MB, and older logs are overwritten. Use this directly for short-term, real-time monitoring, or forward the files to any OpenTelemetry-compatible collector or logging service for additional log management.Azure Monitor (recommended): Enable the Azure Monitor add-on to collect and store logs in a Log Analytics workspace. You get secure, compliant storage with long-term retention, KQL queries, anomaly detection, historical analysis, and alerting through the managed service for Prometheus. Log generation still runs through the Cilium agent and the
ContainerNetworkLogCRD; Azure Monitor adds the consumption layer on top.The
ContainerNetworkLogstable uses the Analytics tier by default. You can switch to the Basic tier for lower ingestion and retention costs while maintaining a similar observability experience. Each tier has a dedicated Azure portal dashboard optimized for its query capabilities. For more information about table plans, see Log Analytics table plans. To learn how to set the table plan, see Set the table plan.
Visualization in the Azure portal. Query and analyze logs directly in Log Analytics, or use the built-in Azure portal dashboards. A dedicated dashboard is available for each table tier, so you get the same observability experience regardless of which tier you choose. For details, see Visualize logs in the Azure portal.
Visualize logs in the Azure portal
You can visualize, query, and analyze flow logs in the Azure portal in the Log Analytics workspace for your cluster.

Container network logs include built-in Azure portal dashboards for visualizing flow data. A separate dashboard is available for each Log Analytics table tier:
| Dashboard | Path | Table tier |
|---|---|---|
| Flow Logs - Basic Tier (ID: 23155) | Azure > Insights > Containers > Networking > Flow Logs - Basic Tier | Basic |
| Flow Logs - Analytics Tier (ID: 23156) | Azure > Insights > Containers > Networking > Flow Logs - Analytics Tier | Analytics (default) |
Both dashboards show which AKS workloads are communicating with each other, including network requests, responses, drops, and errors. Use the dashboard that matches the table tier configured for your ContainerNetworkLogs table.
Tip
The ContainerNetworkLogs table defaults to the Analytics tier. If you want to reduce costs, you can switch to the Basic tier and use the corresponding Basic Tier dashboard without losing observability coverage. For more information, see Log Analytics table plans.
The Azure portal dashboards have the following major components:
Network health overview. The top section shows summary metrics (total flow logs, unique requests, dropped requests, and forwarded requests) so you can quickly spot anomalies. Statistics are broken down by protocol: DNS dropped requests, HTTP 2xx responses, Layer 4 request and response rates, and drop counts. A service dependency graph shows which services communicate with each other, making it easier to identify bottlenecks and unexpected traffic paths.

Flow logs and error logs. The dashboard separates flow logs from error logs into distinct views, so you can focus on errors without sifting through normal traffic. Use the built-in filters to narrow results by protocol, namespace, or verdict. For example, to troubleshoot DNS resolution failures, filter error logs by the DNS protocol.

Each log entry includes labels, timestamps, and source/destination details to help you pinpoint specific events during an investigation.

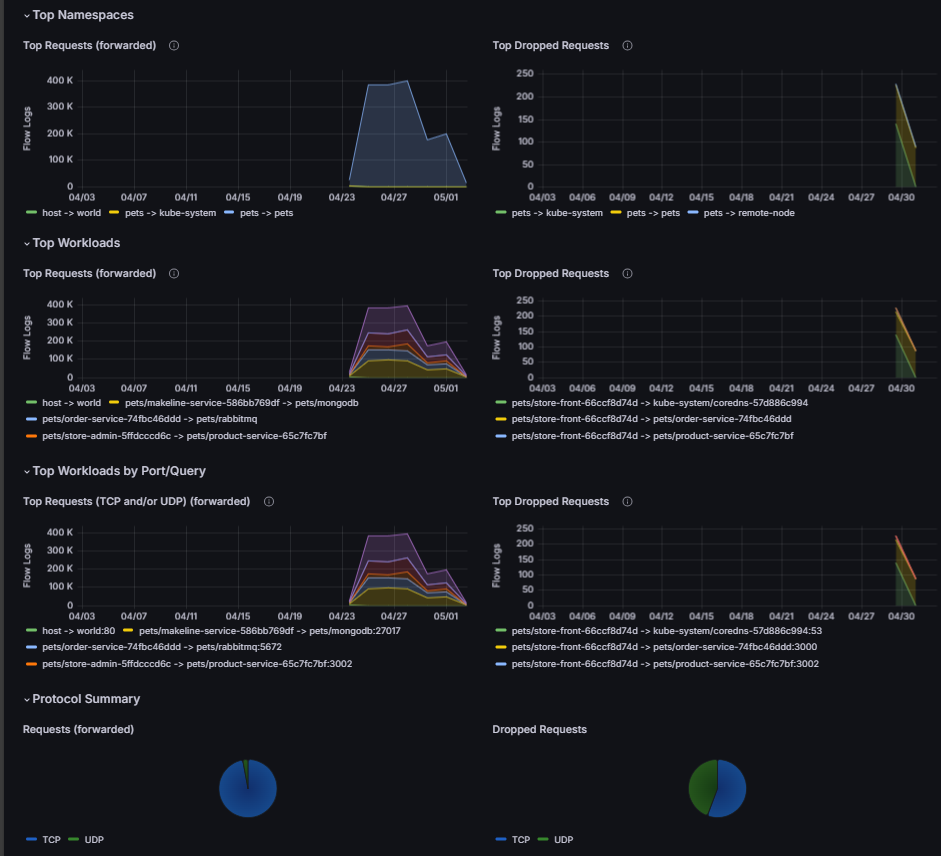
Top namespaces, workloads, and DNS errors. This section surfaces the most active namespaces, highest-traffic workloads, port usage, and most frequent DNS errors. Use it to identify which workloads generate the most traffic, spot dropped requests, and compare protocol distribution (for example, TCP versus UDP). Unusual patterns here, such as unexpected spikes or unfamiliar destinations, can indicate misconfigurations or security concerns.


Flow log aggregation
Network flows add up fast. A cluster with 200 microservices can generate hundreds of thousands of flow records every 30 seconds. Storing all that raw data gets expensive.
For example, say client-1 and client-2 both talk to a server pod over TCP. Over a 30-second window, raw flow records on the node look like this:
| Source | Source port | Destination | Destination port | Protocol | Flag |
|---|---|---|---|---|---|
| client-1 | 12345 | server | 80 | TCP | SYN |
| server | 80 | client-1 | 12345 | TCP | SYN-ACK |
| client-1 | 12345 | server | 80 | TCP | ACK |
| client-1 | 12345 | server | 80 | TCP | PSH |
| server | 80 | client-1 | 12345 | TCP | ACK |
| client-2 | 23456 | server | 80 | TCP | SYN |
| server | 80 | client-2 | 23456 | TCP | SYN-ACK |
| client-2 | 23456 | server | 80 | TCP | ACK |
| client-2 | 23456 | server | 80 | TCP | PSH |
| server | 80 | client-2 | 23456 | TCP | ACK |
With aggregation, those 10 records become two:
| Source | Source port | Destination | Destination port | Protocol | Flows sent | Flows received |
|---|---|---|---|---|---|---|
| client-1 | 12345 | server | 80 | TCP | 4 | 6 |
| client-2 | 23456 | server | 80 | TCP | 4 | 6 |
Flow log aggregation tackles this by grouping similar flows into summarized records. During each 30-second window, flows that share the same aggregation key fields are combined into a single record with a count of how many flows it represents.
The following fields make up the aggregation key:
| Field | Description |
|---|---|
verdict |
FORWARDED, DROPPED, or ERROR |
is_reply |
Whether the flow is a request (false) or response (true) |
drop_reason_desc |
Reason packets were dropped |
source.namespace |
Source pod namespace |
destination.namespace |
Destination pod namespace |
source.workloads |
Source workload (Deployment, StatefulSet, or DaemonSet) |
destination.workloads |
Destination workload (Deployment, StatefulSet, or DaemonSet) |
source.identity |
Source security identity (always present as a fallback) |
destination.identity |
Destination security identity (always present as a fallback) |
l4.TCP.destination_port |
TCP destination port |
l4.UDP.destination_port |
UDP destination port |
l7.http.code |
HTTP response code (200, 404, 500, etc.) |
l7.dns.rcode |
DNS response code (NOERROR, NXDOMAIN, etc.) |
IP.ipVersion |
IPv4 or IPv6 |
IP.encrypted |
Whether the flow is encrypted (WireGuard/IPsec) |
source.cluster_name |
Source cluster name |
destination.cluster_name |
Destination cluster name |
Flows that match on all these fields within a 30-second window are merged into one record. This preserves the signals you need (which services communicate, how often, what errors occur, whether traffic was allowed or blocked) while cutting data volume significantly. Unlike sampling, which randomly discards flows and can miss rare security events, aggregation retains 100% of the pattern information.
Key points:
- Aggregation is enabled and configured by default. This reduces log storage and ingestion costs without any manual tuning.
- You control which traffic is captured through
includeFiltersin theContainerNetworkLogCRD. - Narrower filters (specific namespace or service pairs) typically achieve better compression because the captured flows are more similar.
- Aggregated logs skip high-cardinality and per-flow attributes (for example, individual timestamps, pod IPs, HTTP URLs, DNS query names) to minimize ingestion volume and storage cost. They're designed for high-level issue detection. Use on-demand logs for fine-grained flow analysis and investigation.
Note
Actual storage reduction varies based on your filter configuration, workload diversity, and traffic patterns.
On-demand logs
On-demand logs let you capture and inspect flow logs in real time, without prior configuration or persistent storage. Use on-demand logs when you're actively troubleshooting a connectivity or performance issue and need immediate visibility.
ACNS provides two tools for on-demand capture. To set up either tool, see Configure on-demand logs mode.
Hubble CLI
The Hubble CLI lets you query, filter, and analyze flow logs directly from your terminal. It's especially useful when you need fine-grained filters, for example isolating traffic by namespace, pod label, or verdict during an active debugging session.

Hubble UI
The Hubble UI provides a graphical view of service-to-service communication. It's a good fit when you want to visually trace traffic paths, identify which services are communicating, and spot anomalies without writing CLI commands.

Key benefits of on-demand logs
- No prior configuration required. Start capturing flows immediately without defining custom resources or setting up storage.
- Real-time visibility. Inspect live traffic and view packet metadata as issues happen.
- Fast troubleshooting. Filter flows interactively through the Hubble CLI, or view service maps visually in the Hubble UI.
- Low overhead. No persistent storage required, so there's no ongoing cost for ad-hoc investigations.
Recommendations for stored logs
Start with broad filters, then narrow down. When you first enable flow logs, use wide filters to capture traffic across your key namespaces. Run the configuration for a few days and review the collected data in Log Analytics. Look at data volume, cost, and whether the captured flows match what you actually need. Then tighten your
includeFiltersto focus on high-value traffic and cut out the noise.Use the pre-built dashboards first. The built-in Azure portal dashboards cover common use cases like service communication patterns, error rates, and DNS failures. Start there. Add custom panels or Log Analytics queries only if you need visibility the pre-built dashboards don't provide.
Review periodically. As workloads and traffic patterns change, your filters may need updating. Check data volume and flow coverage periodically to make sure you're still capturing the right traffic at a reasonable cost.
Limitations
Data plane and feature requirements:
- Stored logs mode works only with the Cilium data plane.
- Layer 7 flow logs are captured only when Layer 7 policy support is enabled. For more information, see Configure a Layer 7 policy.
- DNS flows and metrics are captured only when a Cilium Fully Qualified Domain Name (FQDN) network policy is applied. For more information, see Configure an FQDN policy.
Aggregation trade-offs:
- Flow log aggregation doesn't preserve individual flow timestamps, per-pod IP addresses, or high-cardinality fields like HTTP URLs and DNS query names. Use on-demand logs for per-flow investigation.
Storage and platform:
- The host-local file at
/var/log/acns/hubble/is capped at 50 MB per node and auto-rotates. If you need long-term retention, enable Azure Monitor (recommended) or forward the file to your own logging service. - The Auxiliary logs table plan isn't supported.
Pricing
Important
Advanced Container Networking Services is a paid offering.
For more information about pricing, see Advanced Container Networking Services - Pricing.
Related content
- Set up container network logs
- Advanced Container Networking Services for AKS
- Container Network Observability in Advanced Container Networking Services
- Container Network Security in Advanced Container Networking Services