Note
Access to this page requires authorization. You can try signing in or changing directories.
Access to this page requires authorization. You can try changing directories.
APPLIES TO: Developer | Basic | Basic v2 | Standard | Standard v2 | Premium | Premium v2
API Management provides Azure Monitor metrics to detect use of system capacity, helping you troubleshoot gateway problems and make informed decisions whether to scale or upgrade an API Management instance to accommodate more load.
This article explains the capacity metrics and how they behave, shows how to access capacity metrics in the Azure portal, and suggests when to consider scaling or upgrading your API Management instance.
Important
This article introduces how to monitor and scale your Azure API Management instance based on capacity metrics. However, when an instance reaches its capacity, it won't throttle to prevent overload. Instead, it will act like an overloaded web server: increased latency, dropped connections, and time-out errors. API clients should be ready to handle these issues as they do with other external services, for example by using retry policies.
Tip
API teams can use this feature in workspaces. Workspaces provide isolated administrative access to APIs and their own API runtime environments.
Prerequisites
To follow the steps in this article, you must have an API Management instance in one of the tiers that supports capacity metrics. For more information, see Create an Azure API Management instance.
Available capacity metrics
Different capacity metrics are available in the v2 service tiers, classic tiers, and workspace gateways.
In the v2 tiers, the following metrics are available:
CPU Percentage of Gateway - The percentage of CPU capacity used by the gateway units.
Memory Percentage of Gateway - The percentage of memory capacity used by the gateway units.
Available aggregations for these metrics are as follows.
- Avg - Average percentage of capacity used across gateway processes in every unit of an API Management instance.
- Max - Percentage of capacity in gateway process with the greatest consumption.
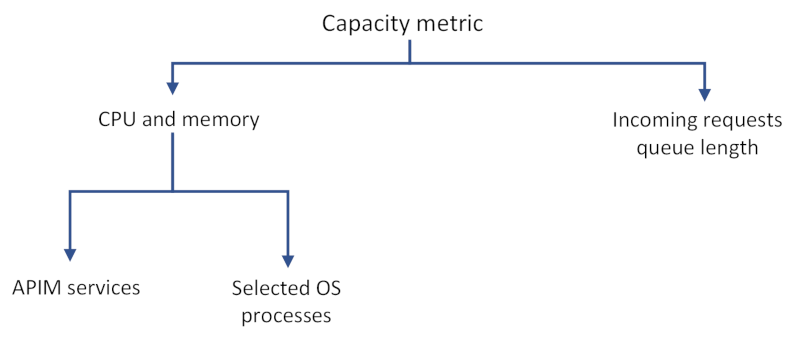
CPU and memory usage reveals consumption of resources by:
- API Management data plane services, such as request processing, which can include forwarding requests or running a policy.
- API Management management plane services, such as management actions applied via the Azure portal or Azure Resource Manager, or load coming from the developer portal.
- Selected operating system processes, including processes that involve cost of TLS handshakes on new connections.
- Platform updates, such as OS updates on the underlying compute resources for the instance.
- Number of APIs deployed, regardless of activity, which can consume additional capacity.
Capacity metric behavior
In real life capacity metrics can be impacted by many variables, for example:
- connection patterns (new connection on a request versus reusing the existing connection)
- size of a request and response
- policies configured on each API or number of clients sending requests.
The more complex operations on the requests are, the higher the capacity consumption is. For example, complex transformation policies consume much more CPU than a simple request forwarding. Slow backend service responses increase it, too.
Important
Capacity metrics are not direct measures of the number of requests being processed.
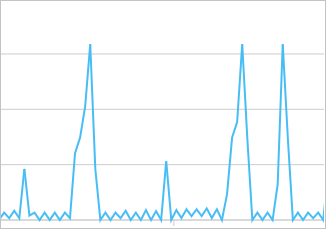
Capacity metrics can also spike intermittently or be greater than zero even if no requests are being processed. It happens because of system- or platform-specific actions and should not be taken into consideration when deciding whether to scale an instance.
Although capacity metrics are designed to surface problems with your API Management instance (or workspace gateway), there are cases when problems won't be reflected in changes in these metrics. Additionally, low capacity metrics don't necessarily mean that your API Management instance isn't experiencing any problems.
Use the Azure portal to examine capacity metrics
Access metrics in the portal to understand how much capacity is used over time.
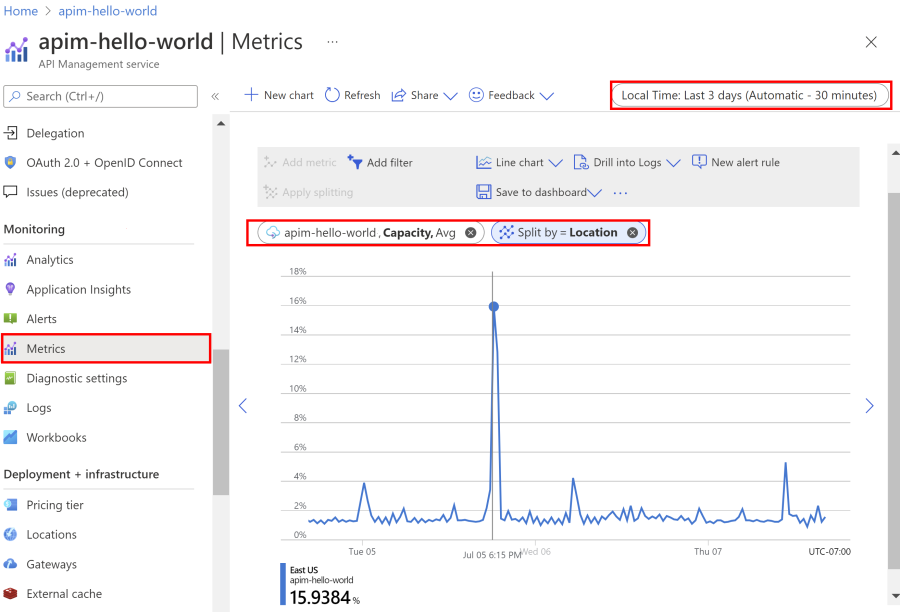
- Navigate to your API Management instance in the Azure portal.
- In the left menu, under Monitoring, select Metrics.
- Select the CPU Percentage of Gateway or Memory Percentage of Gateway metric from the available metrics. Choose the default Avg aggregation or select the Max aggregation to see the peak usage.
- Pick a desired timeframe from the top bar of the section.
Important
Currently, the Capacity metric also appears in the portal for instances in v2 tiers. However, it's not supported for use in the v2 tiers and shows a value of 0.
Note
You can set a metric alert to let you know when something unexpected is happening. For example, get notifications when your API Management instance has exceeded its expected peak CPU or Memory usage for more than 20 minutes.
Use capacity for scaling decisions
Use capacity metrics for making decisions whether to scale an API Management instance (or workspace gateway) to accommodate more load. The following are general considerations:
- Look at a long-term trend and average.
- Ignore sudden spikes that are most likely not related to an increase in load (see Capacity metric behavior section for explanation).
- As a general rule, upgrade or scale your instance when a capacity metric value exceeds 60% - 70% for a long period of time (for example, 30 minutes). Different values may work better for your service or scenario.
- If your instance or workspace gateway is configured with only 1 unit, upgrade or scale it when a capacity metric value exceeds 40% for a long period. This recommendation is based on the need to reserve capacity for guest OS updates in the underlying service platform.
- Use available diagnostics to monitor the response times of API calls. Consider adjusting scaling thresholds if you notice degraded response times with increasing value of capacity metric.
- For classic tiers, discard the most recent 1‑minute data point when reading raw Azure API Management capacity metrics because the derived value can be invalid if source data isn’t available at aggregation time; do not base operational or scaling decisions on 1‑minute values — for autoscaling use average aggregation windows of 30 minutes or longer, evaluate sustained conditions before scaling, and annotate dashboards to exclude the final 1‑minute point so trends reflect reliable data.
Tip
If you are able to estimate your traffic beforehand, test your API Management instance or workspace gateway on workloads you expect. You can increase the request load gradually and monitor the value of the capacity metric that corresponds to your peak load. Follow the steps from the previous section to use Azure portal to understand how much capacity is used at any given time.
Important
When defining autoscaling rules, make sure to avoid autoscaling flapping that will cause a scale in/scale out loop. To learn more, we recommend reading Azure Monitor Autoscale's guidance around flapping.