Visibility helps manufacturers gain insight and drive decision making to improve quality, safety, and efficiency. It involves visualizing and correlating IoT data with multiple other business systems including process historians, manufacturing execution systems (MES), enterprise resource planning (ERP), and quality management systems. This data directly impacts the business value of metrics like overall equipment effectiveness (OEE), energy costs, machine downtime, and labor efficiency.
The following section includes common visibility patterns for industrial solutions.
Grafana is a trademark of its respective company. No endorsement is implied by the use of this mark.
Download a PowerPoint file for the following patterns.
Time series analysis
Analyze IoT telemetry data by using time series techniques.
Download a PowerPoint file of this pattern.
Dataflow
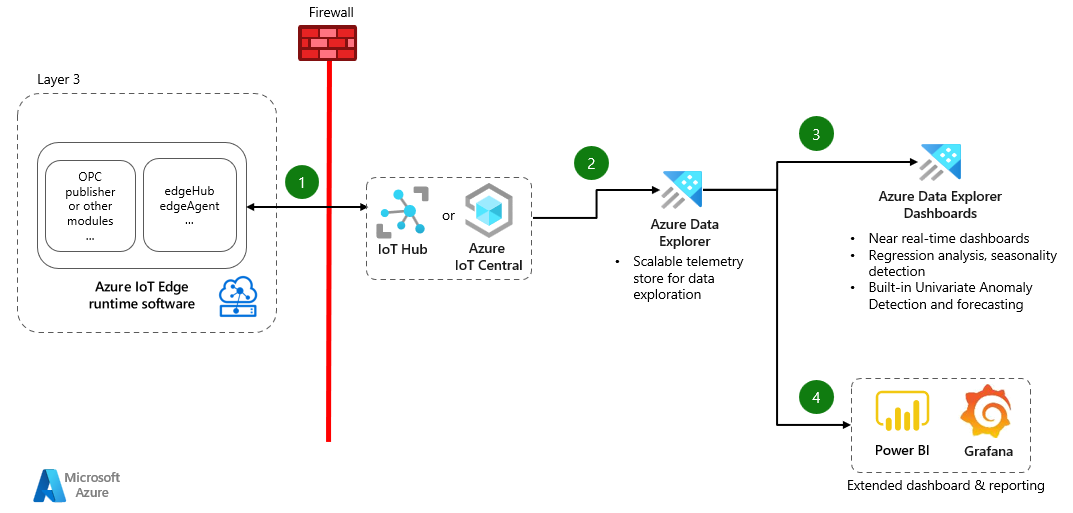
- The edgeHub module sends the data to Azure IoT Hub or Azure IoT Central by using advanced message queuing protocol (AMQP) or MQTT.
- IoT Hub or Azure IoT Central uses data connection or data export to send data to Azure Data Explorer.
- Azure Data Explorer dashboards use Kusto Query Language (KQL) to fetch data from the clusters and build near real-time dashboards.
- Power BI or Grafana is used to build custom dashboards with query builder and integrate with other data sources.
Potential use cases
- Use this pattern when you:
- Need a time series analysis for large scale Industrial IoT (IIoT) telemetry data.
- Need real-time dashboards and querying capabilities on the factory floor.
- Perform univariate anomaly detection and correlation between sensors.
Considerations
- IoT Central includes dashboards for basic time series analysis on the last 30 days of data. For analysis on datasets beyond 30 days, use Azure Data Explorer.
- Azure Data explorer is an append-only platform, which isn't suitable for data that requires updates or deletions.
- For more information on time series analysis, see Time series analysis in Azure Data Explorer.
- For more information on streaming ingestion considerations, see Configure streaming ingestion on your Azure Data Explorer cluster.
- For more information on disaster recovery, see Disaster recovery configurations for Azure Data Explorer.
- For more information on Time Series Insights, see Migrating to Azure Data Explorer.
Deploy this scenario
- Deployment sample:
Anomaly detection and root cause analysis
Detect anomalies and identify a root cause for anomaly incidents.
Download a PowerPoint file of this pattern.
Dataflow
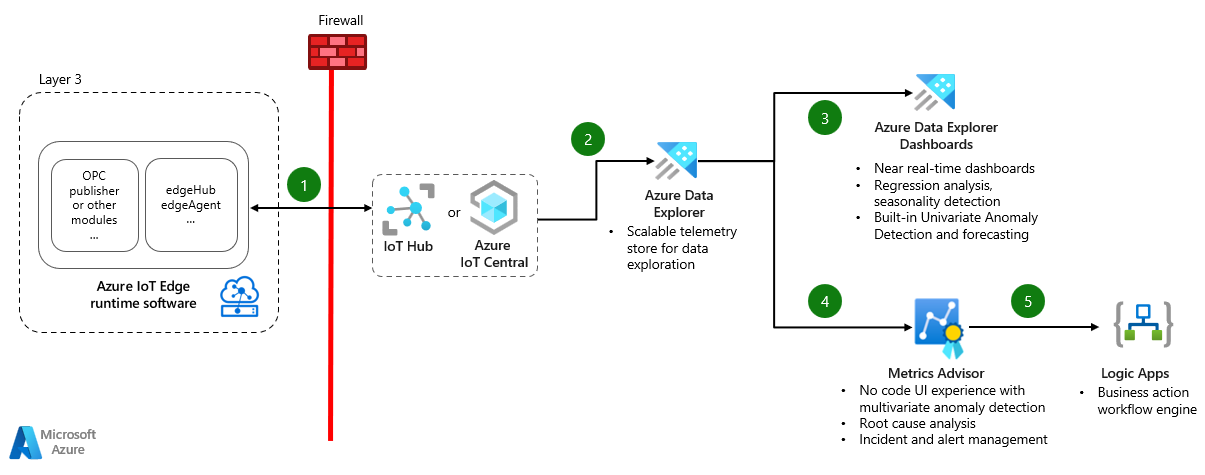
- The edgeHub module sends the data to IoT Hub or Azure IoT Central by using AMQP or MQTT.
- IoT Hub or Azure IoT Central uses data connection or data export to send data to Azure Data Explorer.
- Azure Data Explorer dashboards use KQL to fetch data from the clusters and build near real-time dashboards.
- Azure Metrics Advisor fetches data from Azure Data Explorer by using a data feed configuration. It configures the metrics level configuration for anomaly detection and creates an alert that links to a webhook.
- The Metrics Advisor web hook connects to an HTTP-triggered logic app. The logic app is called when an anomaly is detected.
Potential use cases
- Use this pattern when you:
- Need automatic anomaly detection based on machine learning algorithms and range thresholds.
- Need a no-code or low-code way to build time series machine learning models.
- Need anomaly incident management and business action alerts.
- Perform root cause analysis and correlation mapping.
Considerations
- How-to: Onboard your metric data to Metrics Advisor
- How to: Manage your data feeds
- Data requirements for Metrics Advisor anomaly detection
- Key points about cost management and pricing for Metrics Advisor
Deploy this scenario
- Deployment sample
Contributors
This article is maintained by Microsoft. It was originally written by the following contributors.
Principal author:
- Jomit Vaghela | Principal Program Manager
To see non-public LinkedIn profiles, sign in to LinkedIn.
Next steps
- Explore Time Series Insights integration
- Identify abnormal time-series data with Anomaly Detector
- Introduction to Azure Data Explorer

