This reference architecture illustrates how to use Microsoft Defender for Cloud and Microsoft Sentinel to monitor the security configuration and telemetry of on-premises, Azure, and Azure Stack workloads.

Download a Visio file of this architecture.
- Microsoft Defender for Cloud. This is an advanced, unified security-management platform that Microsoft offers to all Azure subscribers. Defender for Cloud is segmented as a cloud security posture management (CSPM) and cloud workload protection platform (CWPP). CWPP is defined by workload-centric security protection solutions, which are typically agent-based. Microsoft Defender for Cloud provides threat protection for Azure workloads, both on-premises and in other clouds, including Windows and Linux virtual machines (VMs), containers, databases, and Internet of Things (IoT). When activated, the Log Analytics agent deploys automatically into Azure Virtual Machines. For on-premises Windows and Linux servers and VMs, you can manually deploy the agent, use your organization's deployment tool, such as Microsoft Endpoint Protection Manager, or utilize scripted deployment methods. Defender for Cloud begins assessing the security state of all your VMs, networks, applications, and data.
- Microsoft Sentinel. Is a cloud-native Security Information and Event Management (SIEM) and security orchestration automated response (SOAR) solution that uses advanced AI and security analytics to help you detect, hunt, prevent, and respond to threats across your enterprise.
- Azure Stack. Is a portfolio of products that extend Azure services and capabilities to your environment of choice, including the datacenter, edge locations, and remote offices. Azure Stack implementations typically utilize racks of four to sixteen servers that are built by trusted hardware partners and delivered to your datacenter.
- Azure Monitor. Collects monitoring telemetry from a variety of on-premises and Azure sources. Management tools, such as those in Microsoft Defender for Cloud and Azure Automation, also push log data to Azure Monitor.
- Log Analytics workspace. Azure Monitor stores log data in a Log Analytics workspace, which is a container that includes data and configuration information.
- Log Analytics agent. The Log Analytics agent collects monitoring data from the guest operating system and VM workloads in Azure, from other cloud providers, and from on-premises. The Log Analytics Agent supports Proxy configuration and, typically in this scenario, a Microsoft Operations Management Suite (OMS) Gateway acts as proxy.
- On-premises network. This is the firewall configured to support HTTPS egress from defined systems.
- On-premises Windows and Linux systems. Systems with the Log Analytics Agent installed.
- Azure Windows and Linux VMs. Systems on which the Microsoft Defender for Cloud monitoring agent is installed.
Typical uses for this architecture include:
- Best practices for integrating on-premises security and telemetry monitoring with Azure-based workloads
- Integrating Microsoft Defender for Cloud with Azure Stack
- Integrating Microsoft Defender for Cloud with Microsoft Sentinel
The following recommendations apply for most scenarios. Follow these recommendations unless you have a specific requirement that overrides them.
This reference architecture uses Microsoft Defender for Cloud to monitor on-premises systems, Azure VMs, Azure Monitor resources, and even VMs hosted by other cloud providers. Details about Microsoft Defender for Cloud pricing can be found here.
Microsoft Sentinel needs access to a Log Analytics workspace. In this scenario, you can't use the default Defender for Cloud Log Analytics workspace with Microsoft Sentinel. Instead, you create a customized workspace. Data retention for a customized workspace is based on the workspace pricing tier, and you can find pricing models for Monitor Logs here.
Note
Microsoft Sentinel can run on workspaces in any general availability (GA) region of Log Analytics except the China and Germany (Sovereign) regions. Data that Microsoft Sentinel generates, such as incidents, bookmarks, and alert rules, which may contain some customer data sourced from these workspaces, is saved either in Europe (for Europe-based workspaces), in Australia (for Australia-based workspaces), or in the East US (for workspaces located in any other region).
These considerations implement the pillars of the Azure Well-Architected Framework, which is a set of guiding tenets that can be used to improve the quality of a workload. For more information, see Microsoft Azure Well-Architected Framework.
Security provides assurances against deliberate attacks and the abuse of your valuable data and systems. For more information, see Overview of the security pillar.
A security policy defines the set of controls that are recommended for resources within a specified subscription. In Microsoft Defender for Cloud, you define policies for your Azure subscriptions according to the security requirements of your company and the type of applications or data sensitivity for each subscription.
The security policies that you enable in Microsoft Defender for Cloud drive security recommendations and monitoring. To learn more about security policies, refer to Strengthen your security policy with Microsoft Defender for Cloud. You can assign security policies in Microsoft Defender for Cloud only at the management or subscription group levels.
Note
Part one of the reference architecture details how to enable Microsoft Defender for Cloud to monitor Azure resources, on-premises systems, and Azure Stack systems.
Cost optimization is about looking at ways to reduce unnecessary expenses and improve operational efficiencies. For more information, see Overview of the cost optimization pillar.
As previously described, costs beyond your Azure subscription can include:
- Microsoft Defender for Cloud costs. For more information, refer to Defender for Cloud pricing.
- Azure Monitor workspace offers granularity of billing. For more information, refer to Manage Usage and Costs with Azure Monitor Logs.
- Microsoft Sentinel is a paid service. For more information, refer to Microsoft Sentinel pricing.
Operational excellence covers the operations processes that deploy an application and keep it running in production. For more information, see Overview of the operational excellence pillar.
Defender for Cloud assesses the configuration of your resources to identify security issues and vulnerabilities, and displays information related to a resource when you are assigned the role of owner, contributor, or reader for the subscription or resource group to which a resource belongs.
In addition to these roles, there are two specific Defender for Cloud roles:
Security Reader. A user that belongs to this role has read only rights to Defender for Cloud. The user can observe recommendations, alerts, a security policy, and security states, but can't make changes.
Security Admin. A user that belongs to this role has the same rights as the Security Reader, and also can update security policies, and dismiss alerts and recommendations. Typically, these are users that manage the workload.
The security roles, Security Reader and Security Admin, have access only in Defender for Cloud. The security roles don't have access to other Azure service areas, such as storage, web, mobile, or IoT.
- To enable Microsoft Sentinel, you need contributor permissions to the subscription in which the Microsoft Sentinel workspace resides.
- To use Microsoft Sentinel, you need contributor or reader permissions on the resource group to which the workspace belongs.
- Microsoft Sentinel is a paid service. For more information, refer to Microsoft Sentinel pricing.
Performance efficiency is the ability of your workload to scale in an efficient manner to meet the demands that users place on it. For more information, see Performance efficiency pillar overview.
The Log Analytics Agent for Windows and Linux is designed to have very minimal impact on the performance of VMs or physical systems.
Microsoft Defender for Cloud operational process won't interfere with your normal operational procedures. Instead, it passively monitors your deployments and provides recommendations based on the security policies you enable.
- Sign into the Azure portal as a user with Security Admin privileges.
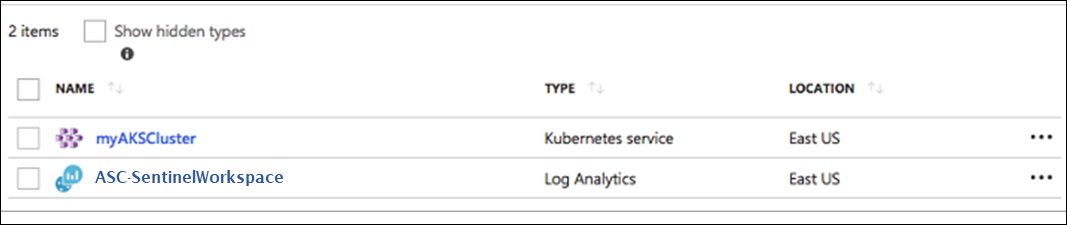
- In the Azure portal, select All services. In the list of resources, enter Log Analytics. As you begin entering, the list filters based on your input. Select Log Analytics workspaces.
- Select Add on the Log Analytics page.
- Provide a name for the new Log Analytics workspace, such as Defender for Cloud-SentinelWorkspace. This name must be globally unique across all Azure Monitor subscriptions.
- Select a subscription by selecting from the drop-down list if the default selection is not appropriate.
- For Resource Group, choose to use an existing resource group or create a new one.
- For Location, select an available geolocation.
- Select OK to complete the configuration.
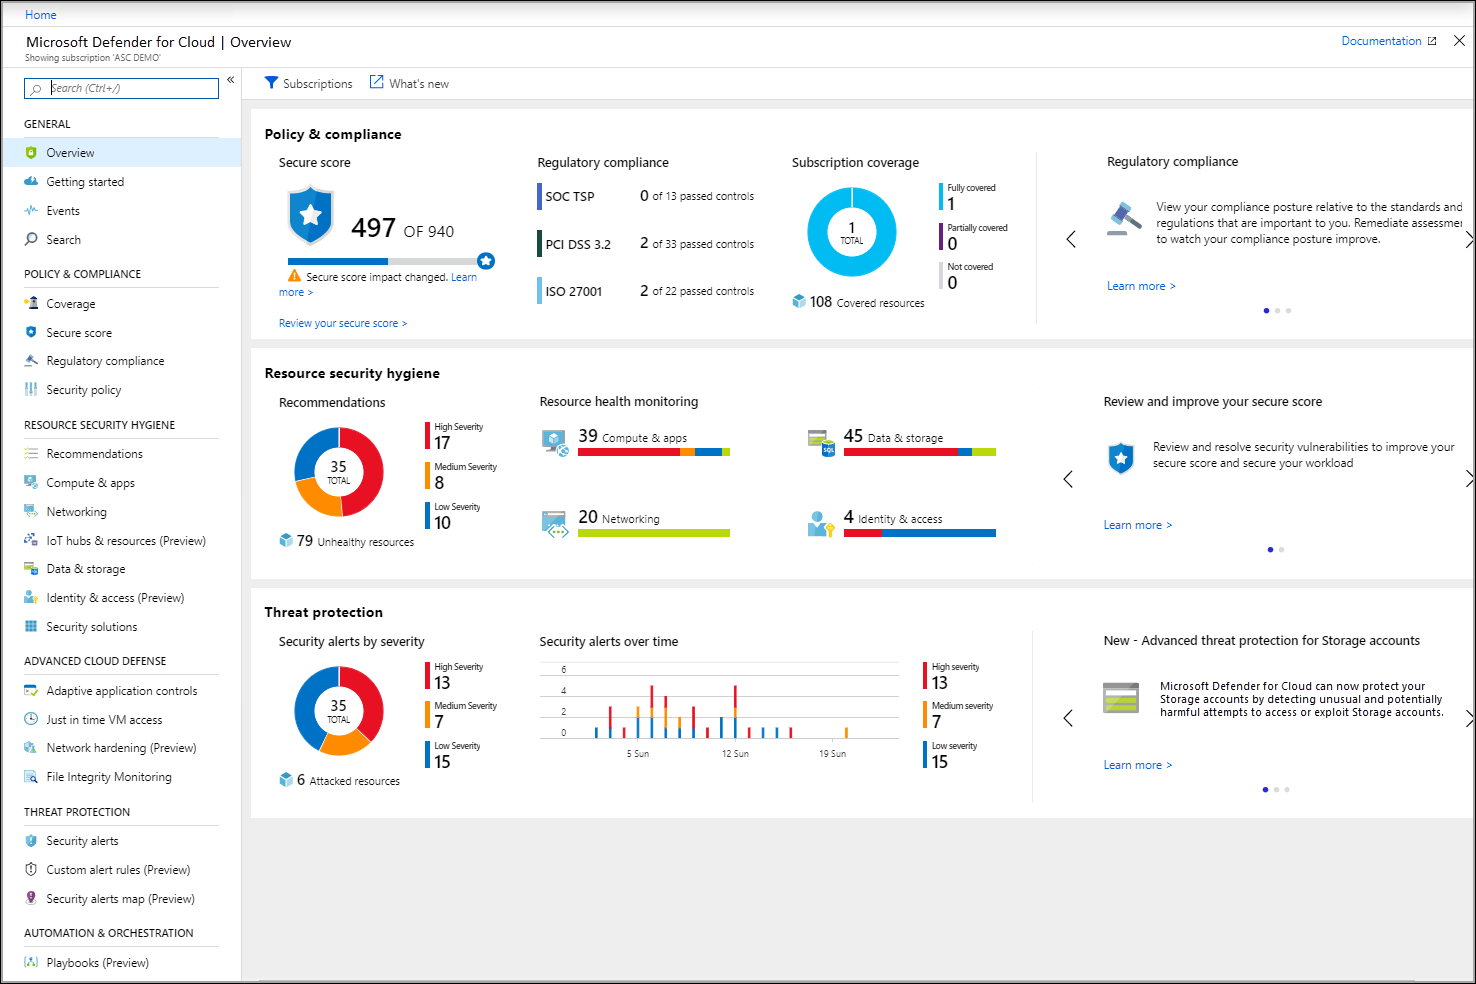
While you're still signed into the Azure portal as a user with Security Admin privileges, select Defender for Cloud in the panel. Defender for Cloud - Overview opens:
Defender for Cloud automatically enables the Free tier for any of the Azure subscriptions not previously onboarded by you or another subscription user.
- On the Defender for Cloud main menu, select Getting Started.
- Select the Upgrade Now button. Defender for Cloud lists your subscriptions and workspaces that are eligible for use.
- You can select eligible workspaces and subscriptions to start your trial. Select the previously created workspace, ASC-SentinelWorkspace. from the drop-down menu.
- In the Defender for Cloud main menu, select Start trial.
- The Install Agents dialog box should display.
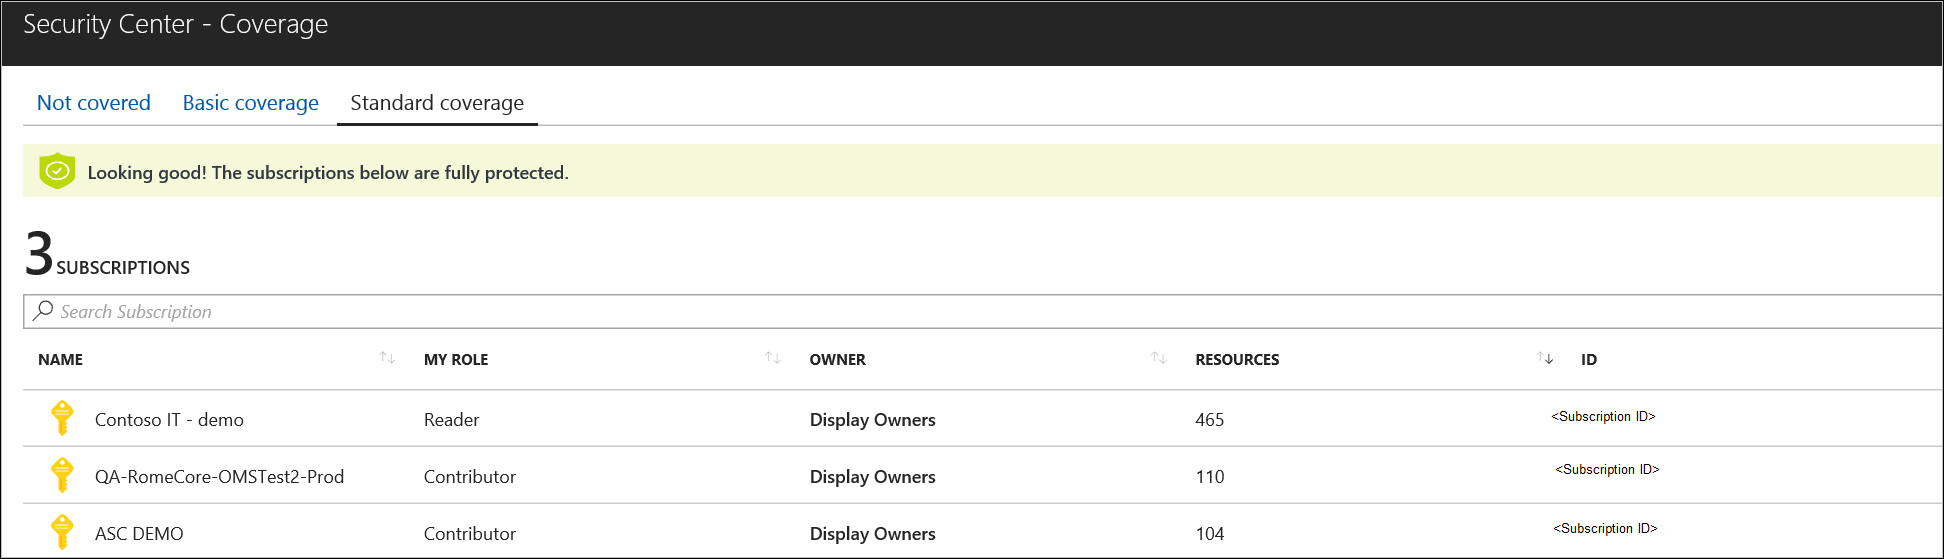
- Select the Install Agents button. The Defender for Cloud - Coverage blade displays and you should observe your selected subscription.
You've now enabled automatic provisioning and Defender for Cloud will install the Log Analytics Agent for Windows (HealthService.exe) and the omsagent for Linux on all supported Azure VMs and any new ones that you create. You can turn off this policy and manually manage it, although we strongly recommend automatic provisioning.
To learn more about the specific Defender for Cloud features available in Windows and Linux, refer to Feature coverage for machines.
- In the Azure portal on the Defender for Cloud - Overview blade, select the Get Started tab.
- Select Configure under Add new non-Azure computers. A list of your Log Analytics workspaces displays, and should include the Defender for Cloud-SentinelWorkspace.
- Select this workspace. The Direct Agent blade opens with a link for downloading a Windows agent and keys for your workspace identification (ID) to use when you configure the agent.
- Select the Download Windows Agent link applicable to your computer processor type to download the setup file.
- To the right of Workspace ID, select Copy, and then paste the ID into Notepad.
- To the right of Primary Key, select Copy, and then paste the key into Notepad.
To install the agent on the targeted computers, follow these steps.
- Copy the file to the target computer and then Run Setup.
- On the Welcome page, select Next.
- On the License Terms page, read the license and then select I Agree.
- On the Destination Folder page, change or keep the default installation folder and then select Next.
- On the Agent Setup Options page, choose to connect the agent to Azure Log Analytics and then select Next.
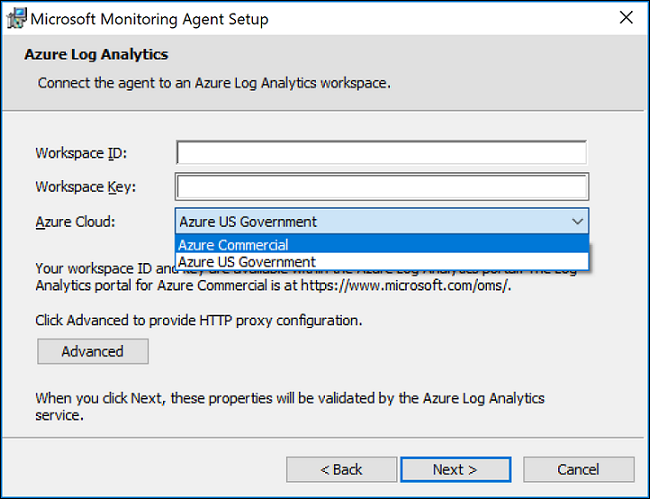
- On the Azure Log Analytics page, paste the Workspace ID and Workspace Key (Primary Key) that you copied into Notepad in the previous procedure.
- If the computer should report to a Log Analytics workspace in Azure Government cloud, select Azure US Government from the Azure Cloud drop-down list. If the computer needs to communicate through a proxy server to the Log Analytics service, select Advanced, and then provide the proxy server's URL and port number.
- After you provide the necessary configuration settings, select Next.
- On the Ready to Install page, review your choices and then select Install.
- On the Configuration completed successfully page, select Finish.
When complete, the Log Analytics agent appears in Windows Control Panel, and you can review your configuration and verify that the agent is connected.
For further information about installing and configuring the agent, refer to Install Log Analytics agent on Windows computers.
The Log Analytics Agent service collects event and performance data, executes tasks, and other workflows defined in a management pack. Defender for Cloud extends its cloud workload protection platforms by integrating with Microsoft Defender for Servers. Together, they provide comprehensive endpoint detection and response (EDR) capabilities.
For more information about Microsoft Defender for Servers, refer to Onboard servers to the Microsoft Defender for Servers service.
- Return to the Getting Started tab as previously described.
- Select Configure under Add new non-Azure computers. A list of your Log Analytics workspaces displays. The list should include the Defender for Cloud-SentinelWorkspace that you created.
- On the Direct Agent blade under DOWNLOAD AND ONBOARD AGENT FOR LINUX, select copy to copy the wget command.
- Open Notepad and then paste this command. Save this file to a location that you can access from your Linux computer.
Note
On Unix and Linux operating systems, wget is a tool for non-interactive file downloading from the web. It supports HTTPS, FTPs, and proxies.
The Linux agent uses the Linux Audit Daemon framework. Defender for Cloud integrates functionalities from this framework within the Log Analytics agent, which enables audit records to be collected, enriched, and aggregated into events by using the Log Analytics Agent for Linux. Defender for Cloud continuously adds new analytics that use Linux signals to detect malicious behaviors on cloud and on-premises Linux machines.
For a list of the Linux alerts, refer to the Reference table of alerts.
To install the agent on the targeted Linux computers, follow these steps:
- On your Linux computer, open the file that you previously saved. Select and copy the entire content, open a terminal console, and then paste the command.
- Once the installation finishes, you can validate that the omsagent is installed by running the pgrep command. The command will return the omsagent process identifier (PID). You can find the logs for the agent at: /var/opt/microsoft/omsagent/"workspace id"/log/.
It can take up to 30 minutes for the new Linux computer to display in Defender for Cloud.
After you onboard your Azure subscription, you can enable Defender for Cloud to protect your VMs running on Azure Stack by adding the Azure Monitor, Update and Configuration Management VM extension from the Azure Stack marketplace. To do this:
- Return to the Getting Started tab as previously described.
- Select Configure under Add new non-Azure computers. A list of your Log Analytics workspaces displays, and it should include the Defender for Cloud-SentinelWorkspace that you created.
- On the Direct Agent blade there is a link for downloading the agent and keys for your workspace ID to use during agent configuration. You don't need to download the agent manually. It'll be installed as a VM extension in the following steps.
- To the right of Workspace ID, select Copy, and then paste the ID into Notepad.
- To the right of Primary Key, select Copy, and then paste the key into Notepad.
Microsoft Defender for Cloud uses the Azure Monitor, Update and Configuration Management VM extension bundled with Azure Stack. To enable the Azure Monitor, Update and Configuration Management extension, follow these steps:
- In a new browser tab, sign into your Azure Stack portal.
- Refer to the Virtual machines page, and then select the virtual machine that you want to protect with Defender for Cloud.
- Select Extensions. The list of VM extensions installed on this VM displays.
- Select the Add tab. The New Resource menu blade opens and displays the list of available VM extensions.
- Select the Azure Monitor, Update and Configuration Management extension and then select Create. The Install extension configuration blade opens.
- On the Install extension configuration blade, paste the Workspace ID and Workspace Key (Primary Key) that you copied into Notepad in the previous procedure.
- When you finish providing the necessary configuration settings, select OK.
- Once the extension installation completes, its status will display as Provisioning Succeeded. It might take up to one hour for the VM to appear in the Defender for Cloud portal.
For more information about installing and configuring the agent for Windows, refer to Install the agent using setup wizard.
For troubleshooting issues for the Linux agent, refer to How to troubleshoot issues with the Log Analytics agent for Linux.
Now you can monitor your Azure VMs and non-Azure computers in one place. Azure Compute provides you with an overview of all VMs and computers along with recommendations. Each column represents one set of recommendations, and the color represents the VMs or computers and the current security state for that recommendation. Defender for Cloud also provides any detections for these computers in security alerts.
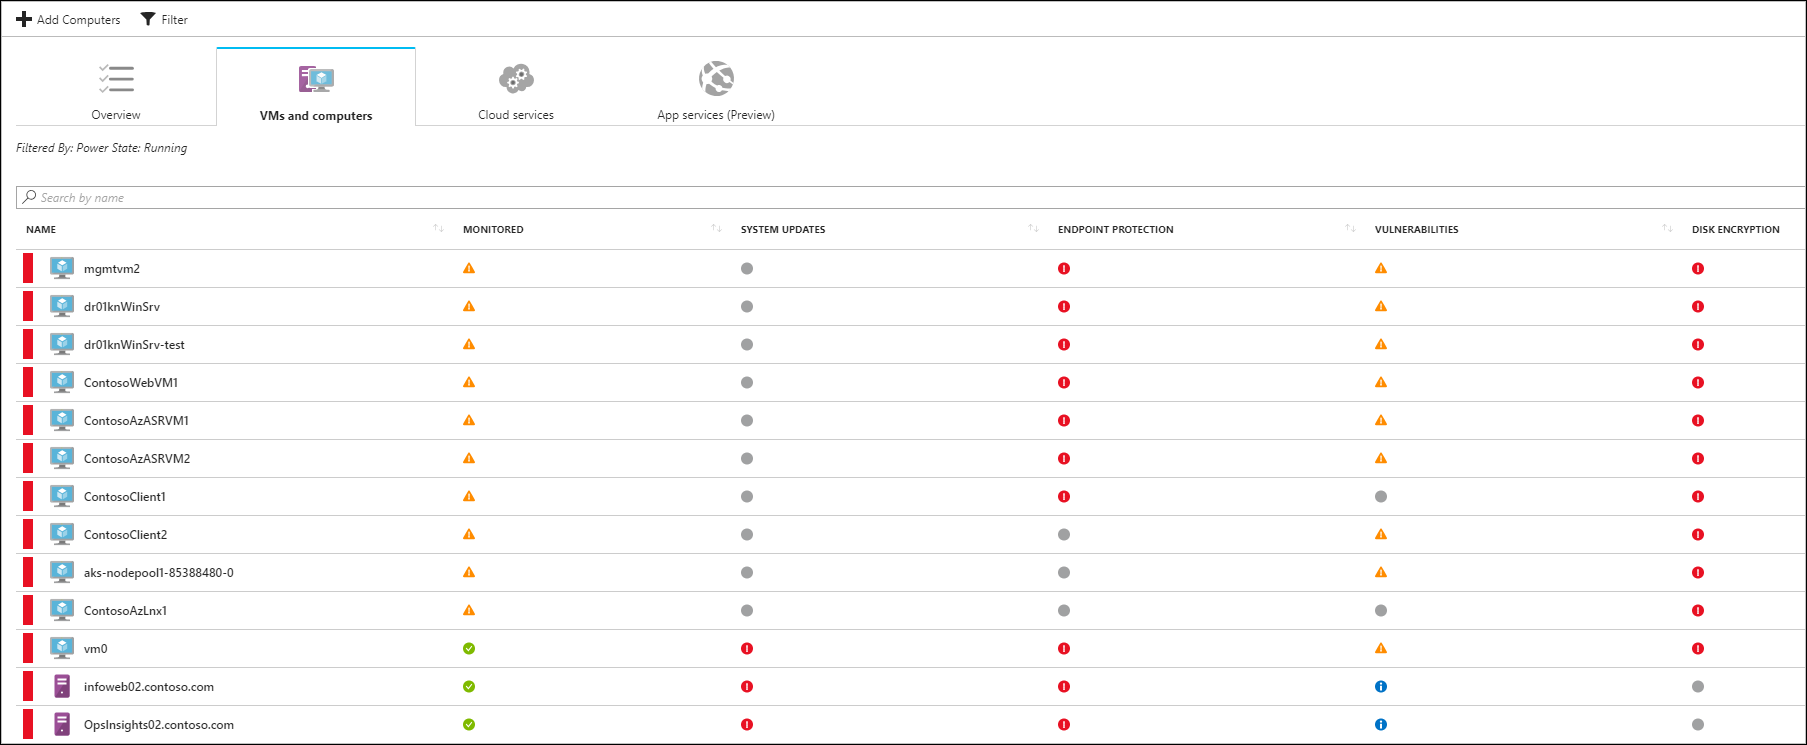
There are two types of icons represented on the Compute blade:
 Non-Azure computer
 Azure computer
Note
Part two of the reference architecture will connect alerts from Microsoft Defender for Cloud and stream them into Microsoft Sentinel.
The role of Microsoft Sentinel is to ingest data from different data sources and perform data correlation across these data sources. Microsoft Sentinel leverages machine learning and AI to make threat hunting, alert detection, and threat responses smarter.
To onboard Microsoft Sentinel, you need to enable it, and then connect your data sources. Microsoft Sentinel comes with a number of connectors for Microsoft solutions, which are available out of the box and provide real-time integration, including Microsoft Defender for Cloud, Microsoft Threat Protection solutions, Microsoft 365 sources (including Office 365), Microsoft Entra ID, Microsoft Defender for Servers, Microsoft Defender for Cloud Apps, and more. Additionally, there are built-in connectors to the broader security ecosystem for non-Microsoft solutions. You can also use Common Event Format, syslog, or the Representational State Transfer API to connect your data sources with Microsoft Sentinel.
- A Microsoft Azure Subscription
- A Log Analytics workspace that isn't the default workspace created when you enable Microsoft Defender for Cloud.
- Microsoft Defender for Cloud.
All three requirements should be in place if you worked through the previous section.
- To enable Microsoft Sentinel, you need contributor permissions to the subscription in which the Microsoft Sentinel workspace resides.
- To use Microsoft Sentinel, you need contributor or reader permissions on the resource group to which the workspace belongs.
- You might need additional permissions to connect specific data sources. You don't need additional permissions to connect to Defender for Cloud.
- Microsoft Sentinel is a paid service. For more information, refer to Microsoft Sentinel pricing.
- Sign into the Azure portal with a user that has contributor rights for Defender for Cloud-Sentinelworkspace.
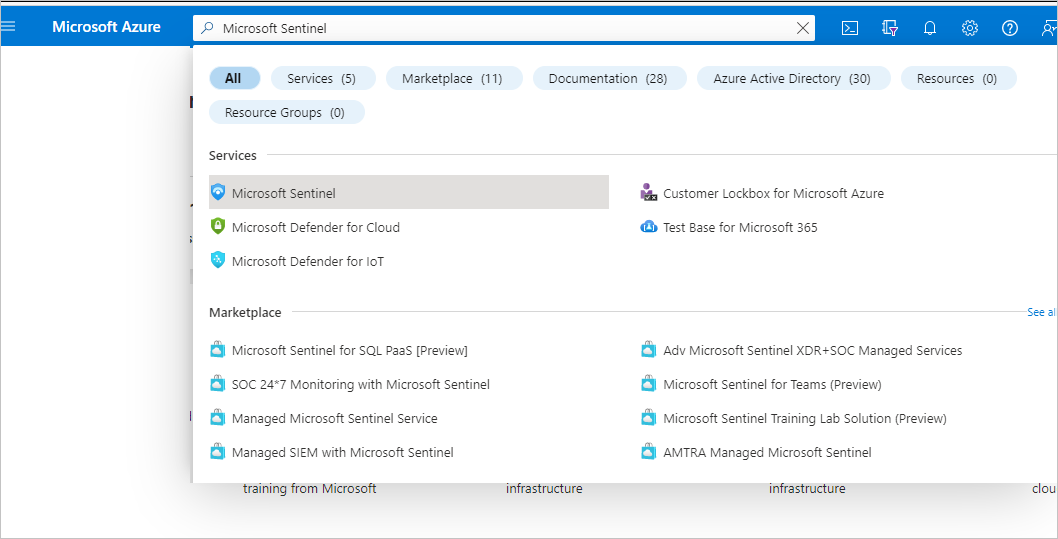
- Search for and select Microsoft Sentinel.
- Select Add.
- On the Microsoft Sentinel blade, select Defender for Cloud-Sentinelworkspace.
- In Microsoft Sentinel, select Data connectors from the navigation menu.
- From the data connectors gallery, select Microsoft Defender for Cloud, and select the Open connector page button.
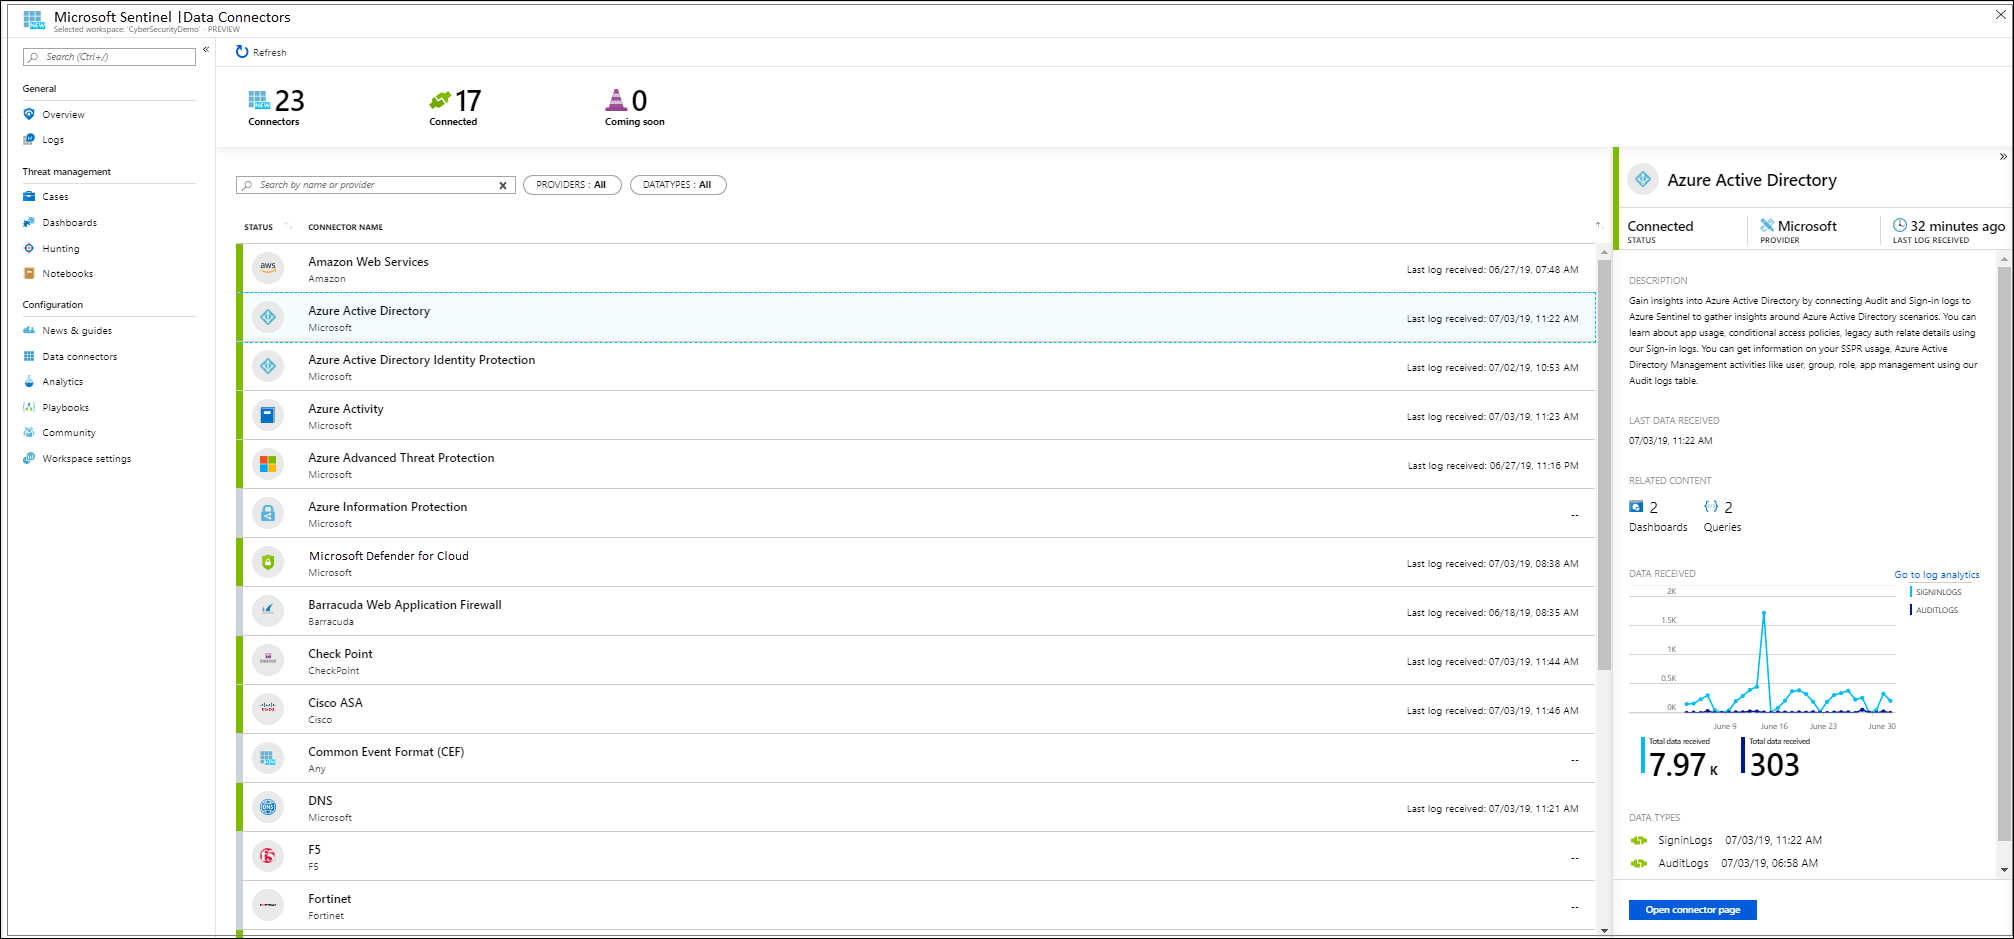
- Under Configuration, select Connect next to those subscriptions for which you want alerts to stream into Microsoft Sentinel. The Connect button will be available only if you have the required permissions and the Defender for Cloud subscription.
- You should now observe the Connection Status as Connecting. After connecting, it will switch to Connected.
- After confirming the connectivity, you can close Defender for Cloud Data Connector settings and refresh the page to observe alerts in Microsoft Sentinel. It might take some time for the logs to start syncing with Microsoft Sentinel. After you connect, you'll observe a data summary in the Data received graph and the connectivity status of the data types.
- You can select whether you want the alerts from Microsoft Defender for Cloud to automatically generate incidents in Microsoft Sentinel. Under Create incidents, select Enabled to turn on the default analytics rule that automatically creates incidents from alerts. You can then edit this rule under Analytics, in the Active rules tab.
- To use the relevant schema in Log Analytics for the Microsoft Defender for Cloud alerts, search for SecurityAlert.
One advantage of using Microsoft Sentinel as your SIEM is that it provides data correlation across multiple sources, which enables you to have an end-to-end visibility of your organization's security-related events.
To learn more about Microsoft Sentinel, refer to the following articles:
- Quickstart: Get started with Microsoft Sentinel
- Tutorial: Detect threats out-of-the-box
- Microsoft Defender for Cloud
- Microsoft Defender for Cloud Smart Alert Correlation
- Microsoft Defender for Cloud Connect Data
- Microsoft Defender for Cloud Coverage
- Microsoft Defender for Cloud Endpoint Protection
- Microsoft Defender for Cloud FAQ
- Microsoft Defender for Cloud Planning
- Microsoft Defender for Cloud Secure Score
- Microsoft Defender for Cloud Security Alerts
- Microsoft Defender for Cloud Security Policies
- Microsoft Defender for Cloud Security Recommendations
- Microsoft Defender for Cloud Supported Platforms
- Microsoft Defender for Cloud Threat Protection
- Microsoft Defender for Cloud Tutorial
- Microsoft Sentinel
- Microsoft Sentinel Analytics
- Microsoft Sentinel Attack Detection
- Microsoft Sentinel Connect Windows Firewall
- Microsoft Sentinel Connect Windows Security Events
- Microsoft Sentinel Data Sources
- Microsoft Sentinel Hunting
- Microsoft Sentinel Investigate
- Microsoft Sentinel Monitor
- Microsoft Sentinel Overview
- Microsoft Sentinel Permissions
- Microsoft Sentinel Quickstart