How to create alerts for Update Management
Alerts in Azure proactively notify you of results from runbook jobs, service health issues, or other scenarios related to your Automation account. Azure Automation does not include pre-configured alert rules, but you can create your own based on data that it generates. This article provides guidance on creating alert rules using the metrics included with Update Management
Available metrics
Azure Automation creates two distinct platform metrics related to Update Management that are collected and forwarded to Azure Monitor. These metric are available for analysis using Metrics Explorer and for alerting using a metrics alert rule.
The two metrics emitted are:
- Total Update Deployment Machine Runs
- Total Update Deployment Runs
When used for alerts, both metrics support dimensions that carry additional information to help scope the alert to a specific update deployment detail. The following table shows the details about the metric and dimensions available when configuring an alert.
| Signal Name | Dimensions | Description |
|---|---|---|
Total Update Deployment Runs |
- Update Deployment Name - Status |
Alerts on the overall status of an update deployment. |
Total Update Deployment Machine Runs |
- Update Deployment Name- Status- Target Computer- Update Deployment Run ID | Alerts on the status of an update deployment targeted at specific machines. |
Create alert
Follow the steps below to set up alerts to let you know the status of an update deployment. If you are new to Azure alerts, see Azure Alerts overview.
In your Automation account, select Alerts under Monitoring, and then select New alert rule.
On the Create alert rule page, your Automation account is already selected as the resource. If you want to change it, select Edit resource.
On the Select a resource page, choose Automation Accounts from the Filter by resource type dropdown list.
Select the Automation account that you want to use, and then select Done.
Select Add condition to chose the signal that's appropriate for your requirement.
For a dimension, select a valid value from the list. If the value you want isn't in the list, select + next to the dimension and type in the custom name. Then select the value to look for. If you want to select all values for a dimension, select the Select * button. If you don't choose a value for a dimension, Update Management ignores that dimension.
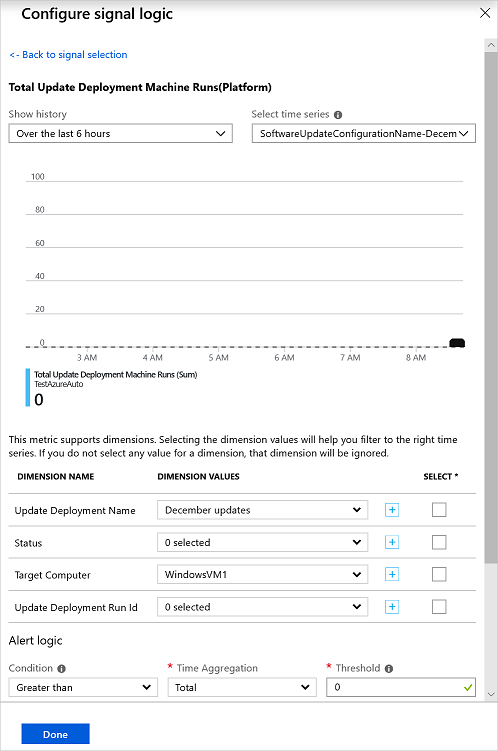
Under Alert logic, enter values in the Time aggregation and Threshold fields, and then select Done.
On the next page, enter a name and a description for the alert.
Set the Severity field to Informational(Sev 2) for a successful run or Informational(Sev 1) for a failed run.
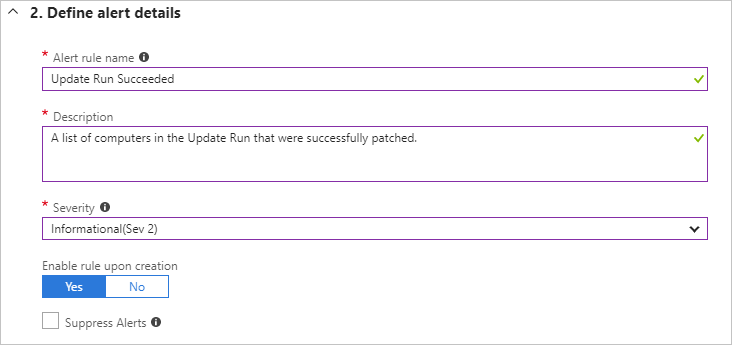
Select Yes to enable the alert rule
Configure action groups for your alerts
Once you have your alerts configured, you can set up an action group, which is a group of actions to use across multiple alerts. The actions can include email notifications, runbooks, webhooks, and much more. To learn more about action groups, see Create and manage action groups.
Select an alert and then select Add action groups under Actions. This will display the Select an action group to attach to this alert rule pane.
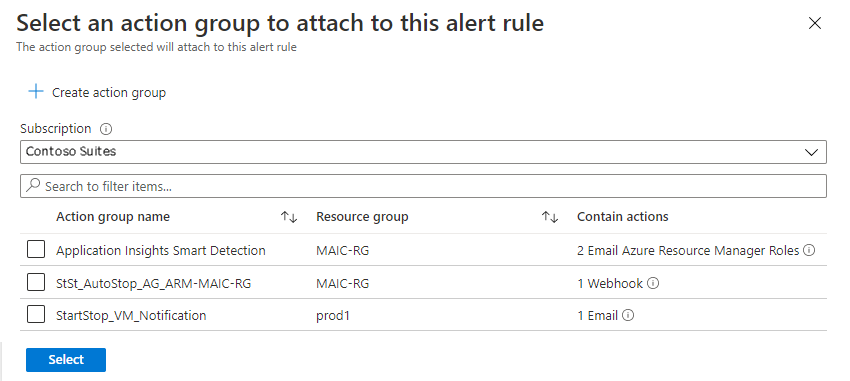
Select the checkbox for the Action group to attach and press Select.
Next steps
Learn more about alerts in Azure Monitor.
Learn about log queries to retrieve and analyze data from a Log Analytics workspace.
Azure Monitor best practices - Cost management describes how to control your costs by changing your data retention period, and how to analyze and alert on your data usage.
Feedback
Coming soon: Throughout 2024 we will be phasing out GitHub Issues as the feedback mechanism for content and replacing it with a new feedback system. For more information see: https://aka.ms/ContentUserFeedback.
Submit and view feedback for