Note
Access to this page requires authorization. You can try signing in or changing directories.
Access to this page requires authorization. You can try changing directories.
When you have critical applications and business processes relying on Azure resources, you want to monitor those resources for their availability, performance, and operation.
This article describes the monitoring data generated by App Configuration. App Configuration uses Azure Monitor. If you are unfamiliar with the features of Azure Monitor common to all Azure services that use it, read Monitoring Azure resources with Azure Monitor.
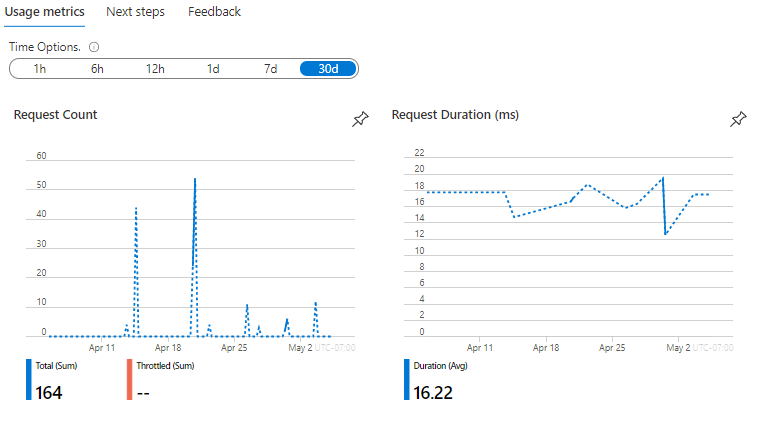
Monitoring overview page in the Azure portal
The Overview page in the Azure portal includes a brief view of the resource usage, such as the total number of requests, number of throttled requests, and request duration per configuration store. This information is useful, but only displays a small amount of the monitoring data available. Some of this monitoring data is collected automatically and is available for analysis as soon as you create the resource. You can enable additional types of data collection with some configuration.
Monitoring data
App Configuration collects the same kinds of monitoring data as other Azure resources that are described in Monitoring data from Azure resources. See Monitoring App Configuration data reference for detailed information on the metrics and logs metrics created by App Configuration.
Collection and routing
Platform metrics and the activity log are collected and stored automatically, but can be routed to other locations by using a diagnostic setting.
Resource Logs are not collected and stored until you create a diagnostic setting and route them to one or more locations. For example, to view logs and metrics for a configuration store in near real-time in Azure Monitor, collect the resource logs in a Log Analytics workspace. If you do not already have one, create a Log Analytics Workspace and follow these steps to create and enable a diagnostic setting.
Sign in to the Azure portal.
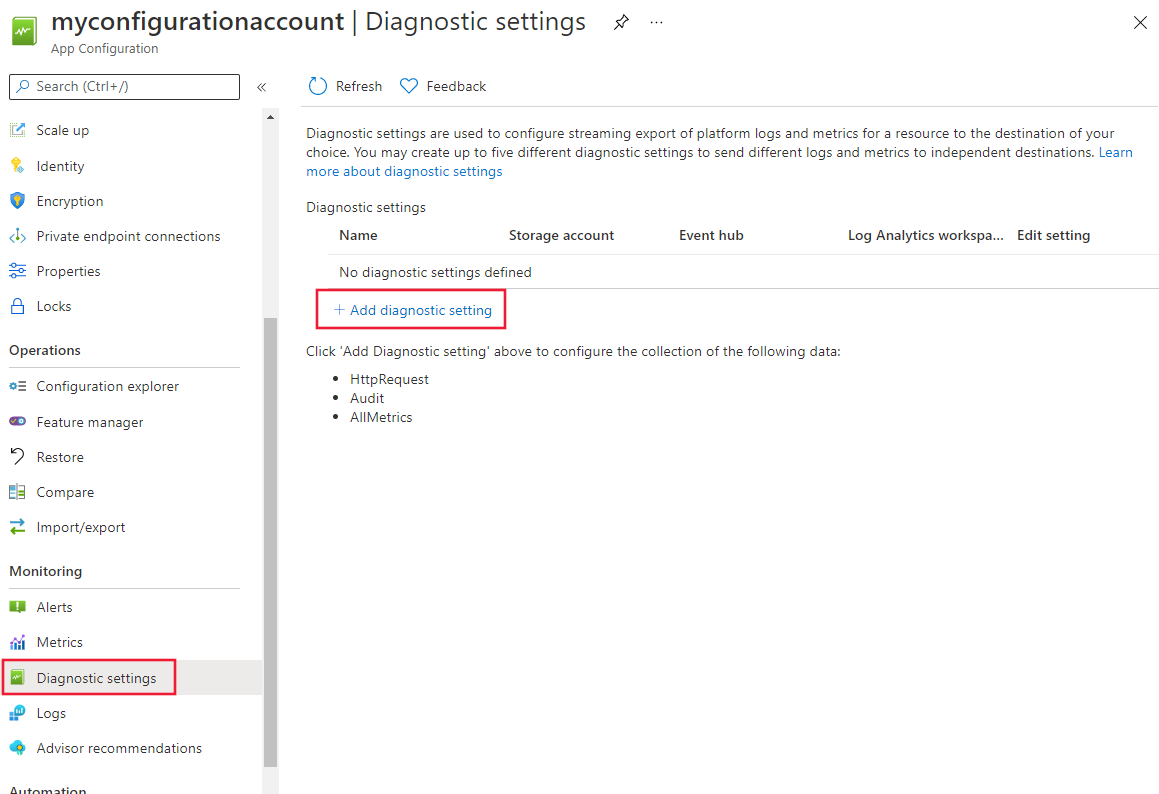
Navigate to your App Configuration store.
In the Monitoring section, select Diagnostic settings, then select +Add diagnostic setting.
In the Diagnostic setting page, enter a name for your setting, then select HttpRequest and choose the destination to send your logs to. To send them to a Log Analytics workspace, choose Send to Log Analytics workspace.
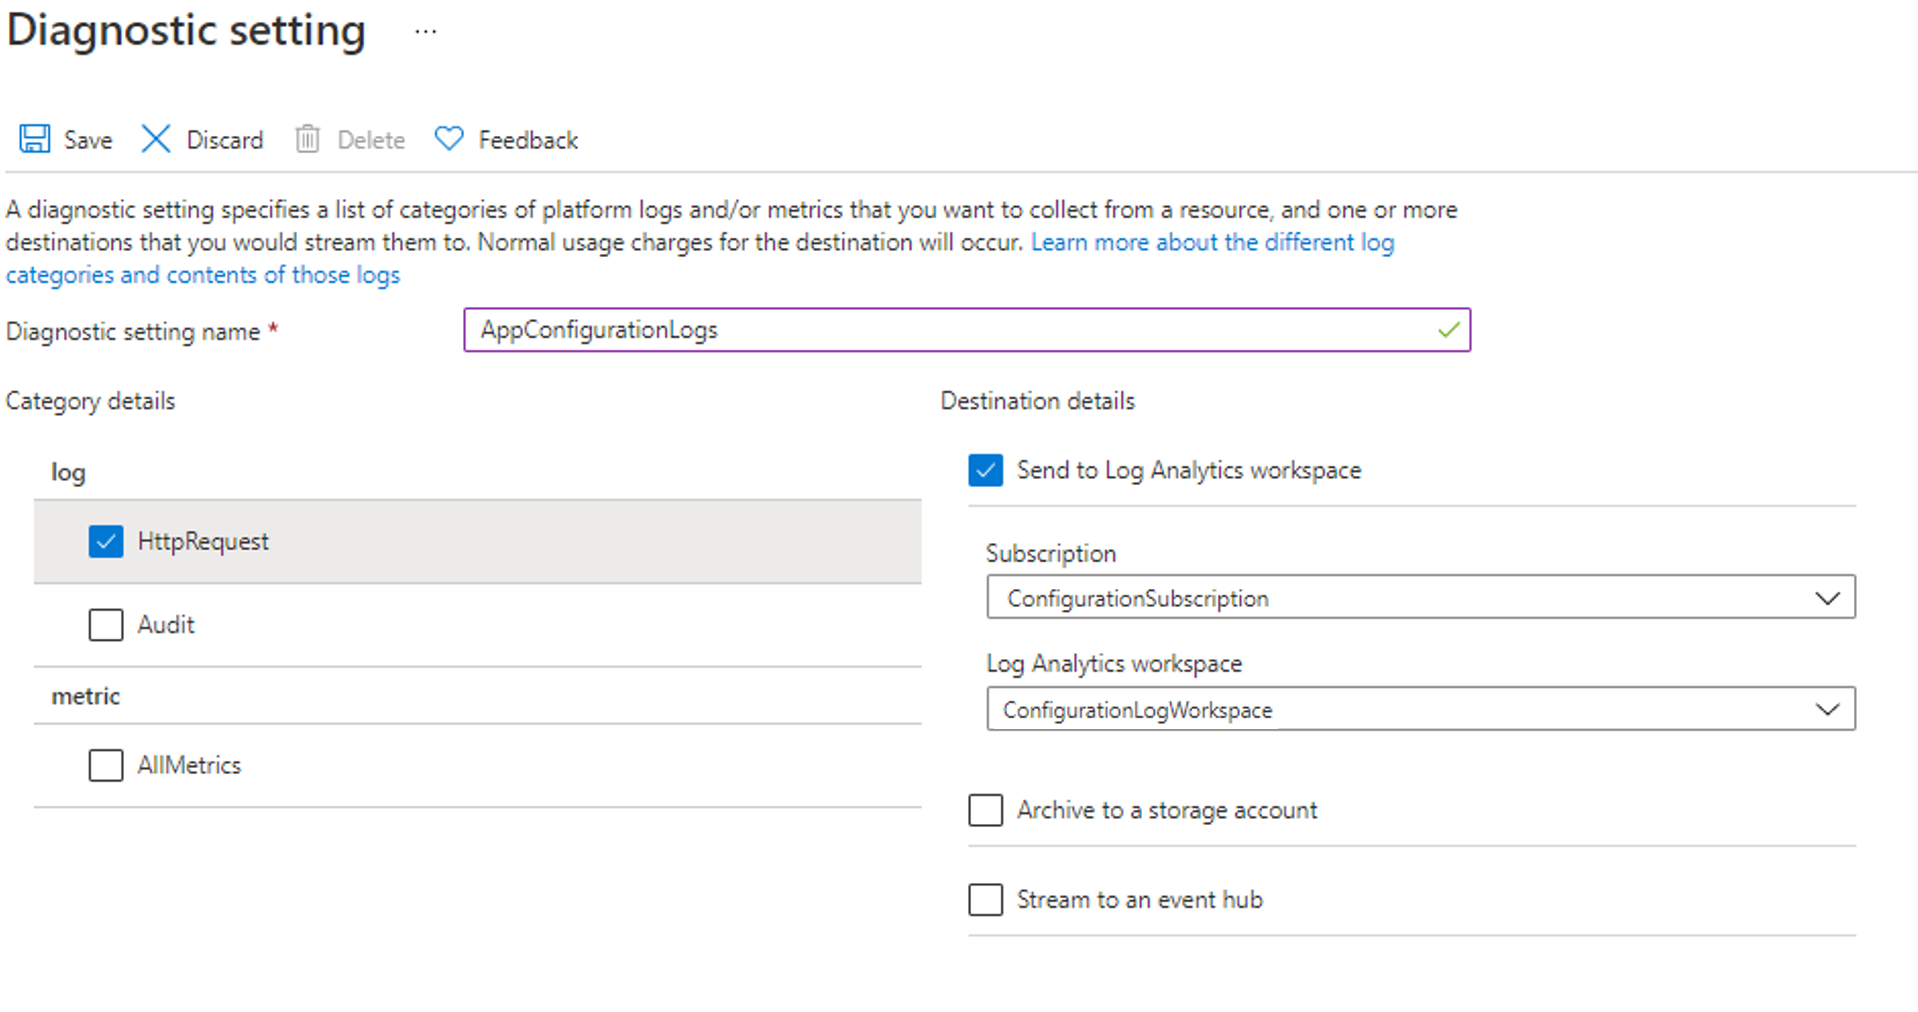
Enter the name of your Subscription and Log Analytics Workspace.
Select Save and verify that the Diagnostic Settings page now lists your new diagnostic setting.
For more information on creating a diagnostic setting using the Azure portal, CLI, or PowerShell, see create a diagnostic setting to collect platform logs and metrics in Azure.
When you create a diagnostic setting, you specify which categories of logs to collect. For further information on the categories of logs for App Configuration, reference App Configuration monitoring data reference.
Analyzing metrics
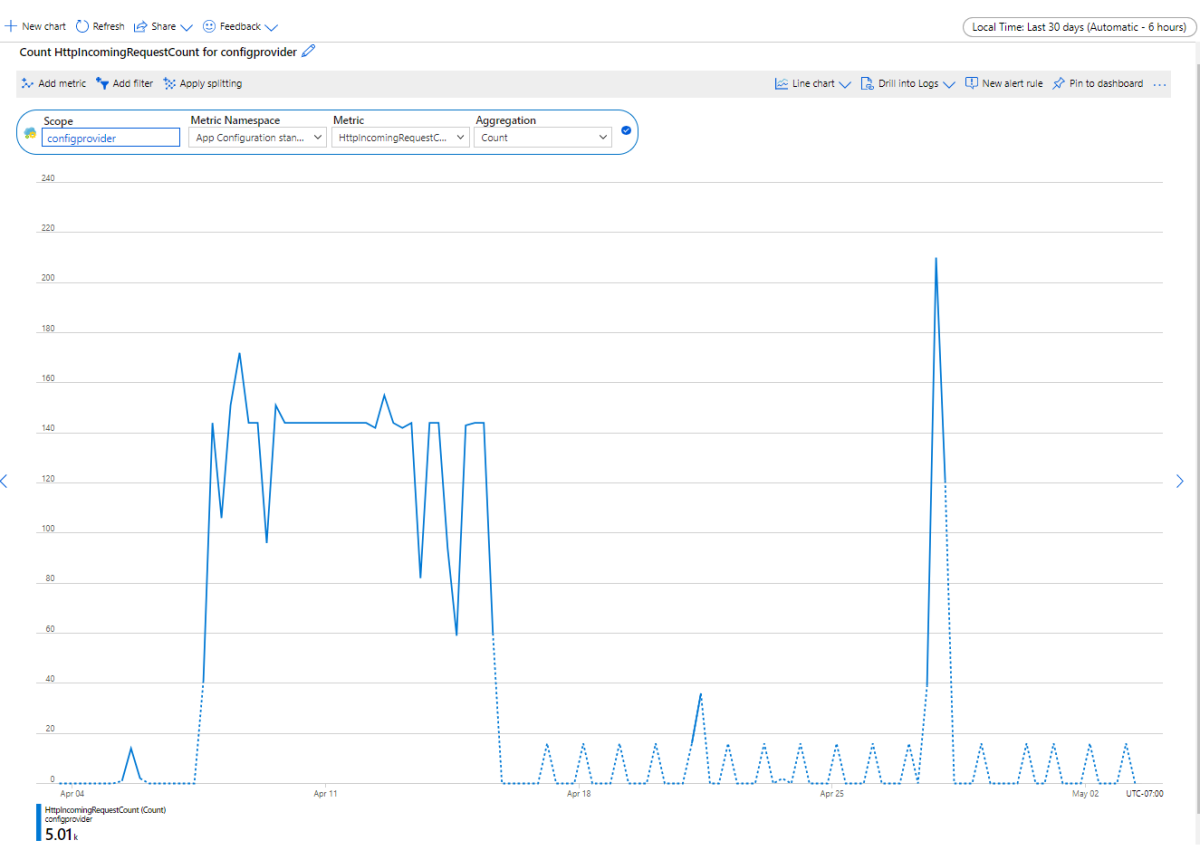
You can analyze metrics for App Configuration with metrics from other Azure services using metrics explorer by opening Metrics from the Azure Monitor menu. See Analyze metrics with Azure Monitor metrics explorer for details on using this tool. For App Configuration, the following metrics are collected:
- HTTP Incoming Request Count
- HTTP Incoming Request Duration
- Throttled HTTP Request Count (HTTP status code 429 Responses)
- Daily Storage Usage
- Request Quota Usage
- Replication Latency
- Snapshot Storage Size
In the portal, navigate to the Metrics section and select the Metric Namespaces and Metrics you want to analyze. This screenshot shows you the metrics view when selecting Http Incoming Request Count for your configuration store.
For a list of the platform metrics collected for App Configuration, see Monitoring App Configuration data reference metrics. For reference, you can also see a list of all resource metrics supported in Azure Monitor.
Analyzing logs
Data in Azure Monitor Logs is stored in tables where each table has its own set of unique properties. The common schema is outlined in Azure Monitor resource log schema.
The Activity log is a platform log in Azure that provides insight into subscription-level events. You can view it independently or route it to Azure Monitor Logs, where you can do much more complex queries using Log Analytics.
For a list of the types of resource logs collected for App Configuration, see Monitoring App Configuration data reference. For a list of the tables used by Azure Monitor Logs and queryable by Log Analytics, see Monitoring App Configuration data reference
Important
When you select Logs from the App Configuration menu, Log Analytics is opened with the query scope set to the current app configuration resource. This means that log queries will only include data from that resource.
If you want to run a query that includes data from other configuration or data from other Azure services, select Logs from the Azure Monitor menu. See Log query scope and time range in Azure Monitor Log Analytics for details.
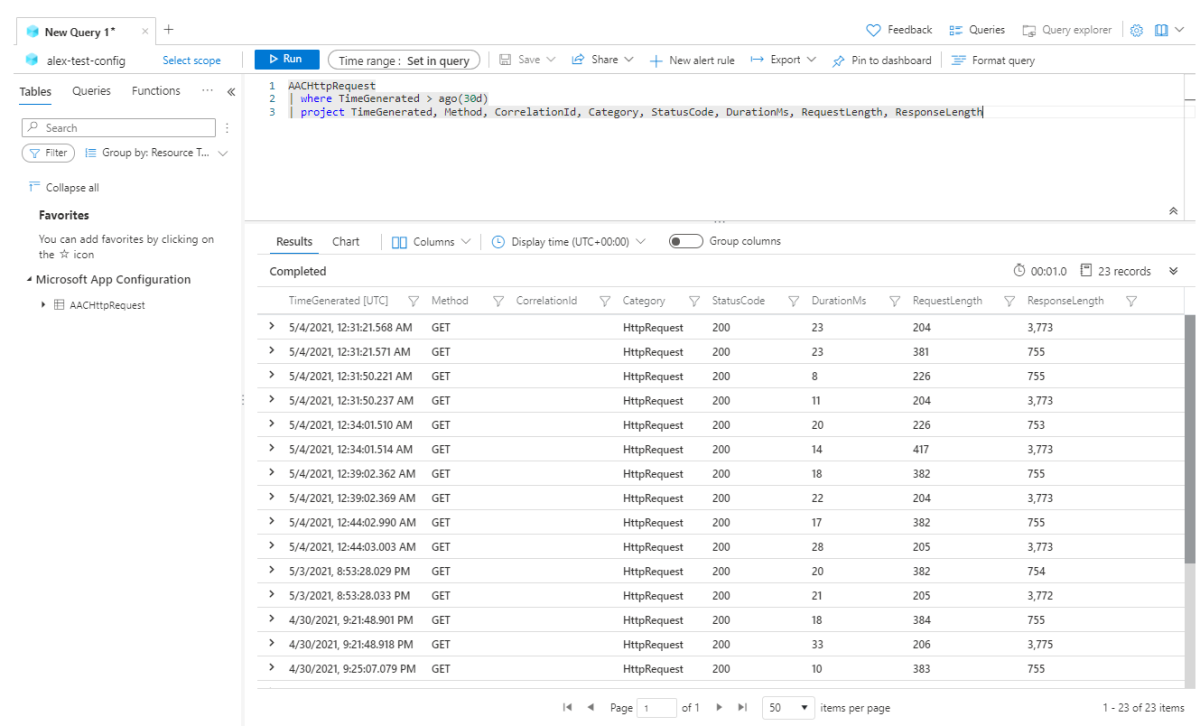
In the portal, navigate to the Logs section, and then to the query editor. On the left under the Tables tab, select AACHttpRequest to see the logs of your configuration store. Enter a Kusto query into the editor and results will be displayed below.
Following are sample queries that you can use to help you monitor your App Configuration resource.
List all HTTP Requests in the last three days
   AACHttpRequest
    | where TimeGenerated > ago(3d)
List all throttled requests (returned HTTP status code 429 for too many requests) in the last three days
   AACHttpRequest
    | where TimeGenerated > ago(3d)
    | where StatusCode == "429"
List the number of requests sent in the last three days by IP Address
   AACHttpRequest
    | where TimeGenerated > ago(3d)
    | summarize requestCount=sum(HitCount) by ClientIPAddress
    | order by requestCount desc
Create a pie chart of the types of status codes received in the last three days
   AACHttpRequest
    | where TimeGenerated > ago(3d)
    | summarize requestCount=sum(HitCount) by StatusCode
    | order by requestCount desc
    | render piechart
List the number of requests sent by day for the last 14 days
AACHttpRequest
    | where TimeGenerated > ago(14d)
    | extend Day = startofday(TimeGenerated)
    | summarize requestcount=sum(HitCount) by Day
    | order by Day desc
Alerts
Azure Monitor alerts proactively notify you when important conditions are found in your monitoring data. They allow you to identify and address issues in your system before your customers notice them. You can set alerts on metrics, logs, and the activity log. Different types of alerts have benefits and drawbacks. The following table lists common and recommended alert rules for App Configuration.
| Alert type | Condition | Description |
|---|---|---|
| Request quota usage exceeded | RequestQuotaUsage >= 100 | The configuration store has exceeded the request quota usage. Upgrade your store or follow the best practices to optimize your usage. |
Next steps
See Monitoring App Configuration data reference for a reference of the metrics, logs, and other important values created by App Configuration.
See Monitoring Azure resources with Azure Monitor for details on monitoring Azure resources.