Important
Azure Cache for Redis announced its retirement timeline for all SKUs. We recommend moving your existing Azure Cache for Redis instances to Azure Managed Redis as soon as you can.
For more details about the retirement:
Azure Cache for Redis offers two monitoring options in Diagnostic settings:
- Cache metrics log Azure Monitor metrics about cache operations.
- Connection logs log connections to the cache. Azure captures these logs, also called data plane logs, per request. The contents of the connection logs vary by resource type.
For an overview of Azure Monitor monitoring and logging functionality, see Diagnostic settings in Azure Monitor.
Scope of availability
| Tier |
Basic, Standard, and Premium |
Enterprise and Enterprise Flash |
| Cache metrics |
Yes |
Yes |
| Connection logs |
Yes |
Yes |
Cache metrics
Azure Redis emits many useful metrics, such as Server Load and Connections per Second. For a complete listing of Azure Redis metrics, see Metrics.
To log cache metrics, enable the AllMetrics option in your cache Diagnostic settings according to the instructions for your tier. You can configure how long metrics are retained. For more information about logging and exporting metrics, see Azure Cache for Redis metrics.
Connection logs
Azure Cache for Redis uses Azure diagnostic settings to log client connection information about your cache. Logging and analyzing this information in diagnostic settings helps you understand who connects to your cache and when. You can use the log data for security auditing purposes, or to identify the scope of security issues.
Note
You can always use the redis-cli INFO or CLIENT LIST commands to check who is connected to a cache instance on-demand.
The connection log implementation and the logs produced are similar among Azure Redis tiers, but Basic, Standard, and Premium tiers have some differences from Enterprise and Enterprise Flash tiers.
Important
- In the Basic, Standard, and Premium tiers, connection logging polls the current client connections in the cache. The same client IP addresses can appear repeatedly as long as their connections last.
- In the Enterprise and Enterprise Flash tiers, logging focuses on connection events. Logging only occurs when the connection event or other connection-related event first happens.
Requirements and limitations
Basic, Standard, and Premium-tier caches poll client connections by IP address, including the number of connections originating from each unique IP address. These logs aren't cumulative, but represent point-in-time snapshots taken at 10-second intervals. These tiers don't log successful or failed authentication events or disconnection events.
Keep the following limitations in mind:
- Because connection logs in these tiers consist of point-in-time snapshots taken every 10 seconds, connections that are established and removed within a 10-second interval aren't logged.
- Authentication and disconnection events aren't logged.
- Diagnostic settings can take up to 90 minutes to start flowing to your selected destination.
- Connection logging can cause a small performance degradation in your cache.
- To stream logs to Log Analytics, only the Analytics Logs pricing plan is supported. For more information, see Azure Monitor pricing.
Enterprise and Enterprise Flash-tier caches use the audit connection event functionality built in to Redis Enterprise. Audit connection events allow every connection, disconnection, and authentication event to be logged, including failed authentication events.
Keep the following limitations in mind:
- When you use OSS cluster policy, logs are emitted from each data node. When you use Enterprise cluster policy, only the node being used as a proxy emits logs. This difference is only architectural. Both versions cover all connections to the cache.
- Data loss, or missing a connection event, is rare but possible. Data loss is typically caused by networking issues.
- Disconnection logs might not be fully stable, and events might be missed.
- Because connection logs on the Enterprise tiers are event-based, consider your retention policies. If retention is set to 10 days, a connection that started 15 days ago might still exist, but the log for that connection event isn't retained.
- If you use active geo-replication, you must configure logging individually for each cache instance in the geo-replication group.
- Diagnostic settings can take up to 90 minutes to start flowing to your selected destination.
- Connection logging can cause a small performance degradation in your cache.
Important
When you select logs, you can choose either Categories or Category groups, which are predefined groupings of logs across Azure services. If you use Category groups, you can't configure retention settings. If you need to set retention duration for your connection logs, select the item in Categories instead. For more information, see Category groups.
Log destinations
When you enable diagnostic settings for your Azure Redis instance, you can send resource logs to the following destinations:
Send to Log Analytics workspace. The workspace doesn't need to be in the same region as the resource being monitored.
Archive to a storage account. The storage account must be in the same region as the cache.
Stream to an event hub. The event hub must be in the same region as the cache.
Diagnostic settings can't access event hub resources if virtual networks are enabled. Enable the Allow trusted Microsoft services to bypass this firewall setting in Azure Event Hubs to grant access to event hub resources.
Send to partner solution. For a list of potential partner logging solutions, see Extend Azure with Azure Native Integrations - Data and storage.
When you send diagnostic logs to a storage account or event hub, you're charged normal data rates for either destination. You're billed under Azure Monitor, not Azure Cache for Redis. When you send logs to Log Analytics, you're charged only for Log Analytics data ingestion. For more pricing information, see Azure Monitor pricing.
Enable diagnostic settings using the Azure portal
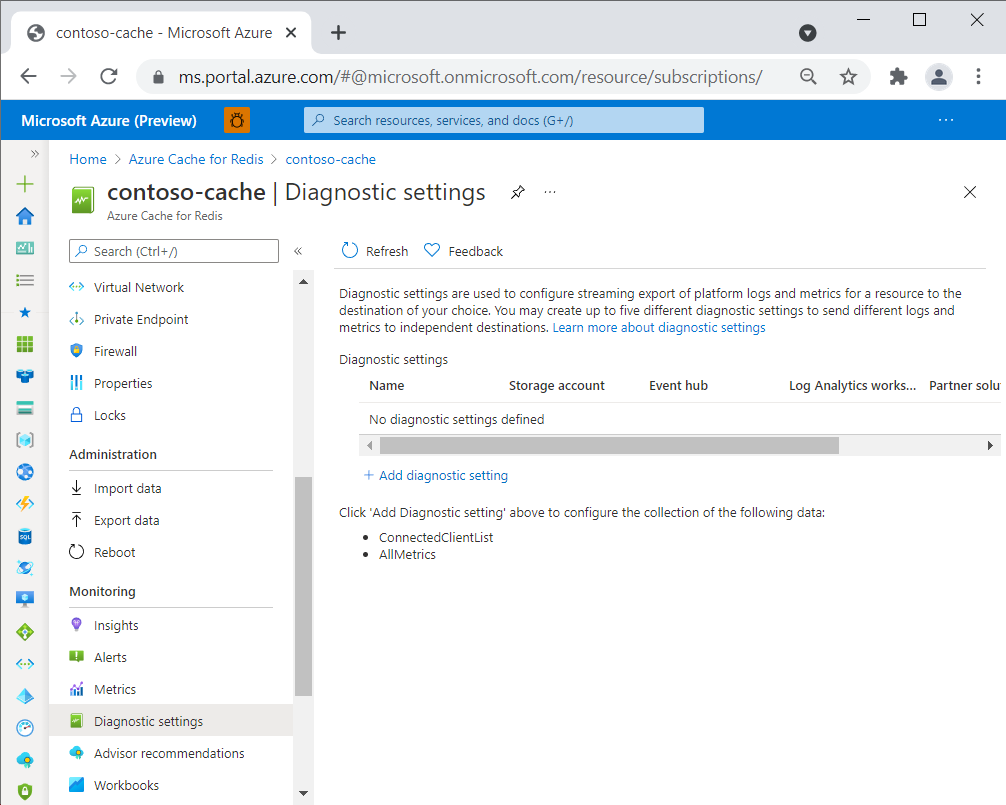
On the Azure portal page for your cache, select Diagnostic settings under Monitoring in the left navigation pane.
On the Diagnostic settings page, select Add diagnostic setting.
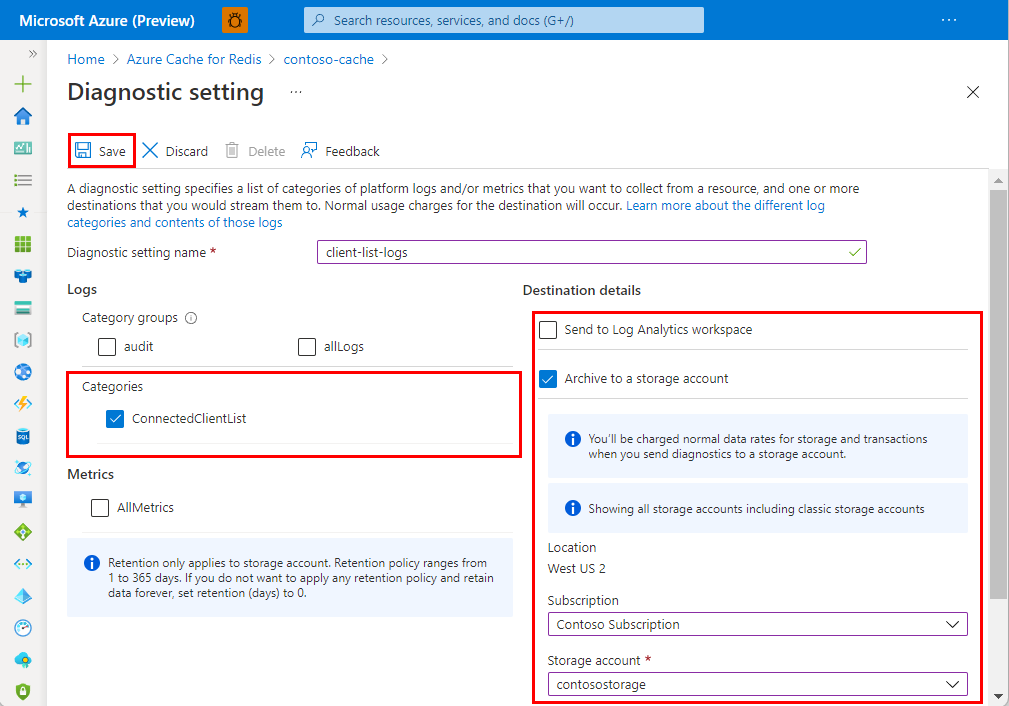
On the Diagnostic setting page, enter a name for your diagnostic setting, and then select the monitoring options you want. For example, select AllMetrics to log all metrics and allLogs to log both Connected client list and MSEntra authentication audit log.
Select one or more destinations and your destination details, and then select Save.
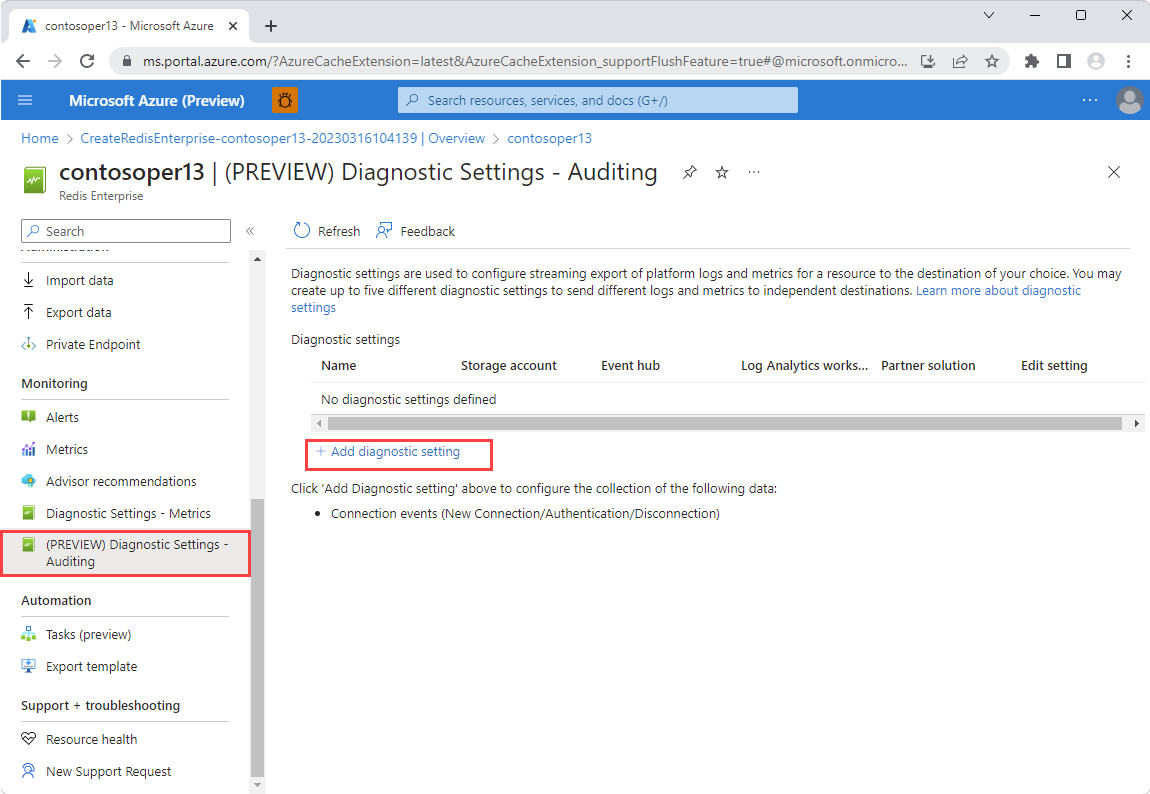
On the Azure portal page for your cache, under Monitoring in the left navigation pane, select either Diagnostic Settings - Metrics for metrics or Diagnostic Settings - Auditing for logs.
On the Diagnostic Settings - Metrics or Diagnostic Settings - Auditing page, select Add diagnostic setting.
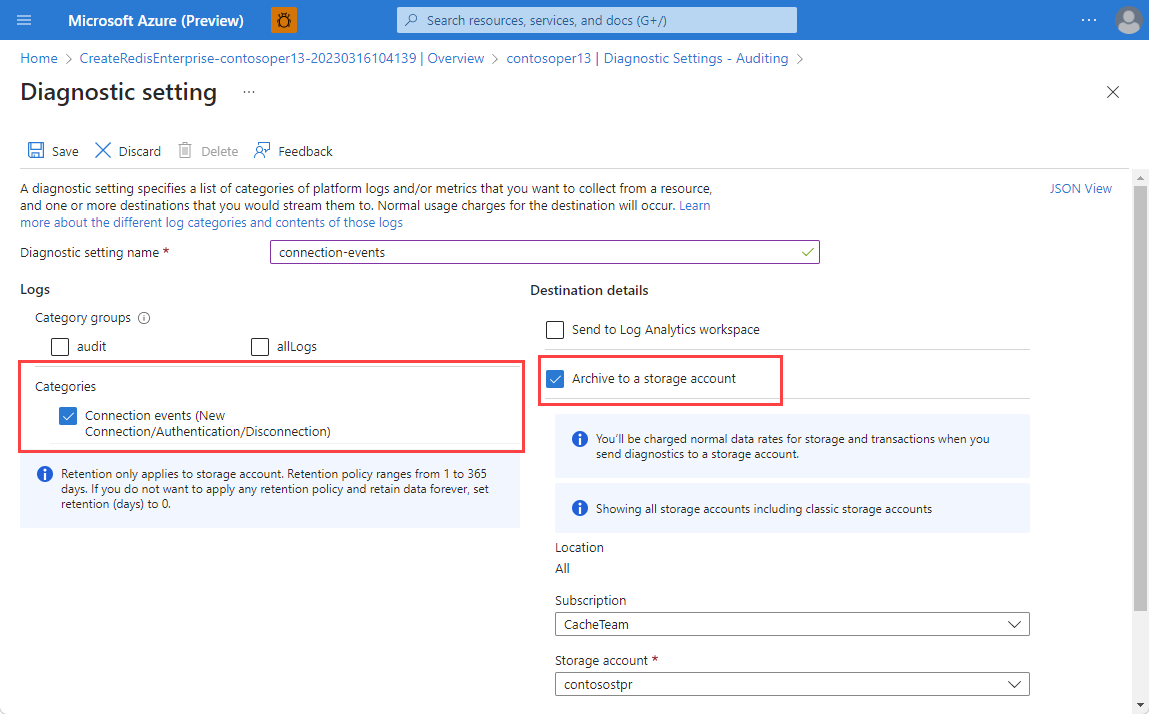
On the Diagnostic setting page for metrics or resource logs, enter a name for your diagnostic setting and select the metrics or resource log options you want. On the logging page, you can select the Connection events category or audit or allLogs category groups. Any of these choices enable connection logging.
Select one or more destinations and your destination details, and then select Save.
Enable connection logging using the REST API
To create a diagnostic setting, use the Azure Monitor REST API in an interactive console as follows. For more information, see Diagnostic Settings - Create or update.
Request
PUT https://management.azure.com/{resourceUri}/providers/Microsoft.Insights/diagnosticSettings/{name}?api-version=2017-05-01-preview
Parameters/headers
Content-Type: application/jsonname: The name of your diagnostic settingresourceUri: subscriptions/<your subscription id>/resourceGroups/<cache resource group>/providers/Microsoft.Cache/Redis/<cache name>api-version: 2017-05-01-preview
Example body
{
    "properties": {
      "storageAccountId": "/subscriptions/aaaa0a0a-bb1b-cc2c-dd3d-eeeeee4e4e4e/resourceGroups/apptest/providers/Microsoft.Storage/storageAccounts/appteststorage1",
      "eventHubAuthorizationRuleId": "/subscriptions/bbbb1b1b-cc2c-dd3d-ee4e-ffffff5f5f5f/resourceGroups/montest/providers/microsoft.eventhub/namespaces/mynamespace/eventhubs/myeventhub/authorizationrules/myrule",
      "eventHubName": "myeventhub",
      "workspaceId": "/subscriptions/cccc2c2c-dd3d-ee4e-ff5f-aaaaaa6a6a6a/resourceGroups/insights-integration/providers/Microsoft.OperationalInsights/workspaces/myworkspace",
      "logs": [
        {
          "category": "ConnectedClientList",
          "enabled": true,
          "retentionPolicy": {
            "enabled": false,
            "days": 0
          }
        }
      ]
    }
}
Request
PUT https://management.azure.com/{resourceUri}/providers/Microsoft.Insights/diagnosticSettings/{name}?api-version=2017-05-01-preview
Parameters/headers
Content-Type: application/jsonname: The name of your diagnostic settingresourceUri: subscriptions/<your subscription id>/resourceGroups/<cache resource group>/providers/Microsoft.Cache/RedisEnterprise/<cache name>api-version: 2017-05-01-preview
Example body
{
    "properties": {
      "storageAccountId": "/subscriptions/aaaa0a0a-bb1b-cc2c-dd3d-eeeeee4e4e4e/resourceGroups/apptest/providers/Microsoft.Storage/storageAccounts/myteststorage",
      "eventHubAuthorizationRuleID": "/subscriptions/bbbb1b1b-cc2c-dd3d-ee4e-ffffff5f5f5f/resourceGroups/montest/providers/microsoft.eventhub/namespaces/mynamespace/authorizationrules/myrule",
      "eventHubName": "myeventhub",
      "marketplacePartnerId": "/subscriptions/dddd3d3d-ee4e-ff5f-aa6a-bbbbbb7b7b7b/resourceGroups/test-rg/providers/Microsoft.Datadog/monitors/mydatadog",
      "workspaceId": "/subscriptions/cccc2c2c-dd3d-ee4e-ff5f-aaaaaa6a6a6a/resourceGroups/insights integration/providers/Microsoft.OperationalInsights/workspaces/myworkspace",
      "logs": [
        {
          "category": "ConnectionEvents",
          "enabled": true,
          "retentionPolicy": {
            "enabled": false,
            "days": 0
          }
        }
      ]
    }
}
Enable connection logging using Azure CLI
Use the Azure CLI az monitor diagnostic-settings create command to create a diagnostic setting. For more information on command and parameter descriptions, see Create diagnostic settings to send platform logs and metrics to different destinations.
The following example shows how to use the Azure CLI to stream data to four different endpoints:
az monitor diagnostic-settings create
    --resource /subscriptions/{subscriptionID}/resourceGroups/{resourceGroupname}/providers/Microsoft.Cache/Redis/{cacheName}
    --name {logName}
    --logs '[{"category": "ConnectedClientList","enabled": true,"retentionPolicy": {"enabled": false,"days": 0}}]'
    --event-hub {eventHubName}
    --event-hub-rule /subscriptions/{subscriptionID}/resourceGroups/{resourceGroupName}/providers/microsoft.eventhub/namespaces/{eventHubNamespace}/authorizationrule/{ruleName}
    --storage-account /subscriptions/{subscriptionID}/resourceGroups/{resourceGroupName}/providers/Microsoft.Storage/storageAccounts/{storageAccountName}
    --workspace /subscriptions/{subscriptionID}/resourceGroups/{resourceGroupName}/providers/Microsoft.OperationalInsights/workspaces/{logAnalyticsWorkspaceName}
    --marketplace-partner-id/subscriptions/{subscriptionID}/resourceGroups{resourceGroupname}/providers/Microsoft.Datadog/monitors/mydatadog
az monitor diagnostic-settings create
    --resource /subscriptions/{subscriptionID}/resourceGroups/{resourceGroupName}/providers/Microsoft.Cache/redisenterprise/{cacheName}/databases/default
    --name {logName}
    --logs '[{"category": "ConnectionEvents","enabled": true,"retentionPolicy": {"enabled": false,"days": 0}}]'
    --event-hub {eventHubName}
    --event-hub-rule /subscriptions/{subscriptionID}/resourceGroups/{resourceGroupName}/providers/microsoft.eventhub/namespaces/{eventHubNamespace}/authorizationrule/{ruleName}
    --storage-account /subscriptions/{subscriptionID}/resourceGroups/{resourceGroupName}/providers/Microsoft.Storage/storageAccounts/{storageAccountName}
    --workspace /subscriptions/{subscriptionID}/resourceGroups/{resourceGroupName}/providers/Microsoft.OperationalInsights/workspaces/{logAnalyticsWorkspaceName}
    --marketplace-partner-id/subscriptions/{subscriptionID}/resourceGroups{resourceGroupname}/providers/Microsoft.Datadog/monitors/mydatadog
Connection log contents
The following fields and properties appear in the ConnectedClientList log category. In Azure Monitor, logs are collected in the ACRConnectedClientList table under the resource provider name of MICROSOFT.CACHE.
| Azure Storage field or property |
Azure Monitor Logs property |
Description |
time |
TimeGenerated |
The UTC timestamp when the log was generated. |
location |
Location |
The Azure region the Azure Redis cache was accessed in. |
category |
n/a |
Available log category ConnectedClientList. |
resourceId |
_ResourceId |
The Azure Redis resource logs are enabled for. |
operationName |
OperationName |
The Redis operation associated with the log record. |
properties |
n/a |
See the following rows. |
tenant |
CacheName |
The name of the Azure Redis instance. |
roleInstance |
RoleInstance |
The role instance that logged the client list. |
connectedClients.ip |
ClientIp |
The Redis client IP address. |
connectedClients.privateLinkIpv6 |
PrivateLinkIpv6 |
The Redis client private link IPv6 address if applicable. |
connectedClients.count |
ClientCount |
The number of Redis client connections from the associated IP address. |
Sample storage account log
The contents of a log sent to a storage account might look like the following example.
{
    "time": "2021-08-05T21:04:58.0466086Z",
    "location": "canadacentral",
    "category": "ConnectedClientList",
    "properties": {
        "tenant": "mycache",
        "connectedClients": [
            {
                "ip": "192.123.43.36",
                "count": 86
            },
            {
                "ip": "10.1.1.4",
                "privateLinkIpv6": "fd40:8913:31:6810:6c31:200:a01:104",
                "count": 1
            }
        ],
        "roleInstance": "1"
    },
    "resourceId": "/SUBSCRIPTIONS/eeee4efe-ff5f-aa6a-bb7b-cccccc8c8c8c/RESOURCEGROUPS/AZURE-CACHE/PROVIDERS/MICROSOFT.CACHE/REDIS/MYCACHE",
    "Level": 4,
    "operationName": "Microsoft.Cache/ClientList"
}
These fields and properties appear in the ConnectionEvents log category. In Azure Monitor, logs are collected in the REDConnectionEvents table under the resource provider name of MICROSOFT.CACHE.
| Azure Storage field or property |
Azure Monitor Logs property |
Description |
time |
TimeGenerated |
The UTC timestamp when the log was generated. |
location |
Location |
The Azure region the Azure Redis cache was accessed in. |
category |
n/a |
Available log category ConnectedClientList. |
resourceId |
_ResourceId |
The Azure Redis resource logs are enabled for. |
operationName |
OperationName |
The Redis operation associated with the log record. |
properties |
n/a |
See the following rows. |
eventEpochTime |
EventEpochTime |
The UTC UNIX timestamp, or number of seconds since January 1, 1970, when the event happened. You can convert the timestamp to datetime format using the function unixtime_seconds_todatetime in the Log Analytics workspace. |
clientIP |
ClientIP |
The Redis client IP address. If you use Azure storage, the IP address is IPv4 or Private Link IPv6 format based on cache type. If you use Log Analytics, this result is always in IPv4, because there's a separate IPv6 field. |
| n/a |
PrivateLinkIPv6 |
The Redis client private link IPv6 address, emitted only if using both Private Link and Log Analytics. |
id |
ConnectionId |
Unique connection ID assigned by Redis. |
eventType |
EventType |
Type of connection event: new_conn, auth, or close_conn. |
eventStatus |
EventStatus |
Results of an authentication request as a status code. Only applicable for authentication events. |
Note
If you use Private Link, only an IPv6 address is logged, unless you stream the data to Log Analytics. You can convert the IPv6 address to the equivalent IPv4 address by using the last four bytes of data in the IPv6 address. For instance, in the Private Link IPv6 address fd40:8913:31:6810:6c31:200:a01:104, the last four bytes in hexadecimal are 0a, 01, 01, and 04. (In the address, leading zeros after colons are omitted.) These values correspond to 10, 1, 1, and 4 in decimal, producing the IPv4 address 10.1.1.4.
Sample storage account logs
A log for a connection event sent to a storage account might look like the following example.
    {
        "time": "2023-01-24T10:00:02.3680050Z",
        "resourceId": "/SUBSCRIPTIONS/ffff5f5f-aa6a-bb7b-cc8c-dddddd9d9d9d/RESOURCEGROUPS/TEST/PROVIDERS/MICROSOFT.CACHE/REDISENTERPRISE/AUDITING-SHOEBOX/DATABASES/DEFAULT",
        "category": "ConnectionEvents",
        "location": "westus",
        "operationName": "Microsoft.Cache/redisEnterprise/databases/ConnectionEvents/Read",
        "properties": {
            "eventEpochTime": 1674554402,
            "id": 6185063009002,
            "clientIP": "20.228.16.39",
            "eventType": "new_conn"
        }
    }
The log for an authentication event might look like this example:
 {
        "time": "2023-01-24T10:00:02.3680050Z",
        "resourceId": "/SUBSCRIPTIONS/ffff5f5f-aa6a-bb7b-cc8c-dddddd9d9d9d/RESOURCEGROUPS/TEST/PROVIDERS/MICROSOFT.CACHE/REDISENTERPRISE/AUDITING-SHOEBOX/DATABASES/DEFAULT",
        "category": "ConnectionEvents",
        "location": "westus",
        "operationName": "Microsoft.Cache/redisEnterprise/databases/ConnectionEvents/Read",
        "properties": {
            "eventEpochTime": 1674554402,
            "id": 6185063009002,
            "clientIP": "20.228.16.39",
            "eventType": "auth",
            "eventStatus": 8
        }
    }
The log for a disconnection event might look like this:
    {
        "time": "2023-01-24T10:00:03.3680050Z",
        "resourceId": "/SUBSCRIPTIONS/ffff5f5f-aa6a-bb7b-cc8c-dddddd9d9d9d/RESOURCEGROUPS/TEST/PROVIDERS/MICROSOFT.CACHE/REDISENTERPRISE/AUDITING-SHOEBOX/DATABASES/DEFAULT",
        "category": "ConnectionEvents",
        "location": "westus",
        "operationName": "Microsoft.Cache/redisEnterprise/databases/ConnectionEvents/Read",
        "properties": {
            "eventEpochTime": 1674554402,
            "id": 6185063009002,
            "clientIP": "20.228.16.39",
            "eventType": "close_conn"
        }
    }
Related content
For detailed information about how to create a diagnostic setting by using the Azure portal, Azure CLI, or Azure PowerShell, see Create diagnostic settings to collect platform logs and metrics in Azure.