Note
Access to this page requires authorization. You can try signing in or changing directories.
Access to this page requires authorization. You can try changing directories.
Internet Information Services (IIS) stores user activity in log files that can be collected by Azure Monitor agent using a data collection rule (DCR) with a IIS Logs data source. Details for the creation of the DCR are provided in Collect data from VM client with Azure Monitor. This article provides additional details for the IIS logs data source type.
Configure IIS log data source
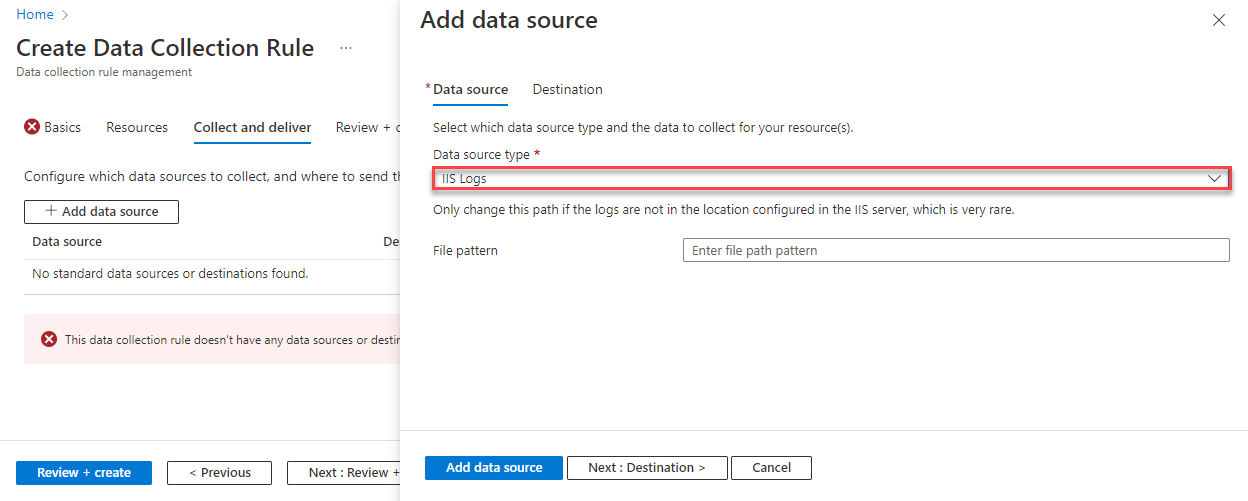
Create the DCR using the process in Collect data from virtual machine client with Azure Monitor. On the Collect and deliver tab of the DCR, select IIS Logs from the Data source type dropdown. You only need to specify a file pattern to identify the directory where the log files are located if they are stored in a different location than configured in IIS. In most cases, you can leave this value blank.
Add destinations
IIS logs can only be sent to a Log Analytics workspace where it's stored in the W3CIISLog table. Add a destination of type Azure Monitor Logs and select a Log Analytics workspace. You can only add a single workspace to a DCR for an IIS log data source. If you need multiple destinations, create multiple DCRs. Be aware though that this will send duplicate data to each which will result in additional cost.
Verify data collection
To verify that data is being collected, check for records in the W3CIISLog table. From the virtual machine or from the Log Analytics workspace in the Azure portal, select Logs and then click the Queries button. Under the Virtual machines category, click Run next to List IIS Log entries.
If you are looking for different examples of log queries that retrieve IIS log records shown in the mentioned table, follow the article Queries for the W3CIISLog table for additional details.
Configure collection of IIS logs on client
Before you can collect IIS logs from the machine, you must ensure that IIS logging has been enabled and is configured correctly.
- The IIS log file must be in W3C format and stored on the local drive of the machine running the agent.
- Each entry in the log file must be delineated with an end of line.
- The log file must not use circular logging, which overwrites old entries.
- The log file must not use renaming, where a file is moved and a new file with the same name is opened.
The default location for IIS log files is C:\inetpub\logs\LogFiles\W3SVC1. Verify that log files are being written to this location or check your IIS configuration to identify an alternate location. Check the timestamps of the log files to ensure that they're recent.
Note
The X-Forwarded-For custom field is not currently supported. If this is a critical field, you can collect the IIS logs as a custom text log.
Azure Monitor collects IIS log entries from each agent each time the log timestamp changes. The log is read every 5 minutes. If for any reason IIS doesn't update the timestamp before the rollover time when a new file is created, entries will be collected following creation of the new file.
The frequency of new file creation is controlled by the Log File Rollover Schedule setting for the IIS site. The setting is once a day by default. If the setting is Hourly, Azure Monitor collects the log each hour. If the setting is Daily, Azure Monitor collects the log every 24 hours.
Important
We recommend that you set Log File Rollover Schedule to Hourly. If it's set to Daily, you might experience spikes in your data because it will be collected only once per day.
Troubleshooting
Go through the following steps if you aren't collecting data from the IIS log that you're expecting.
- Verify that IIS logs are being created in the location you specified.
- Verify that IIS logs are configured to be W3C formatted.
- See Verify operation to verify whether the agent is operational and data is being received.
Next steps
- Learn more about Azure Monitor Agent.
- Learn more about data collection rules.


