Note
Access to this page requires authorization. You can try signing in or changing directories.
Access to this page requires authorization. You can try changing directories.
The common alert schema standardizes the consumption experience for alert notifications in Azure. Historically, activity log, metric, and log search alerts each had their own email templates and webhook schemas. The common alert schema provides one standardized schema for all alert notifications.
A standardized schema can help you minimize the number of integrations, which simplifies the process of managing and maintaining your integrations.
The common schema includes information about the affected resource and the cause of the alert in these sections:
Essentials: Standardized fields, used by all alert types that describe the resource affected by the alert and common alert metadata, such as severity or description.
If you want to route alert instances to specific teams based on criteria such as a resource group, you can use the fields in the Essentials section to provide routing logic for all alert types. The teams that receive the alert notification can then use the context fields for their investigation.
Alert context: Fields that vary depending on the type of the alert. The alert context fields describe the cause of the alert. For example, a metric alert would have fields like the metric name and metric value in the alert context. An activity log alert would have information about the event that generated the alert.
Custom properties: You can add more information to the alert payload by adding custom properties if you've configured action groups for a metric alert rule.
Note
Custom properties are currently only supported by metric alerts. For all other alert types, the custom properties field is null.
Sample alert payload
{
  "schemaId": "azureMonitorCommonAlertSchema",
  "data": {
    "essentials": {
      "alertId": "/subscriptions/<subscription ID>/providers/Microsoft.AlertsManagement/alerts/aaaa0a0a-bb1b-cc2c-dd3d-eeeeee4e4e4e",
      "alertRule": "WCUS-R2-Gen2",
      "severity": "Sev3",
      "signalType": "Metric",
      "monitorCondition": "Resolved",
      "monitoringService": "Platform",
      "alertTargetIDs": [
        "/subscriptions/<subscription ID>/resourcegroups/pipelinealertrg/providers/microsoft.compute/virtualmachines/wcus-r2-gen2"
      ],
      "configurationItems": [
        "wcus-r2-gen2"
      ],
      "originAlertId": "3f2d4487-b0fc-4125-8bd5-7ad17384221e_PipeLineAlertRG_microsoft.insights_metricAlerts_WCUS-R2-Gen2_-117781227",
      "firedDateTime": "2019-03-22T13:58:24.3713213Z",
      "resolvedDateTime": "2019-03-22T14:03:16.2246313Z",
      "description": "",
      "essentialsVersion": "1.0",
      "alertContextVersion": "1.0"
    },
    "alertContext": {
      "properties": null,
      "conditionType": "SingleResourceMultipleMetricCriteria",
      "condition": {
        "windowSize": "PT5M",
        "allOf": [
          {
            "metricName": "Percentage CPU",
            "metricNamespace": "Microsoft.Compute/virtualMachines",
            "operator": "GreaterThan",
            "threshold": "25",
            "timeAggregation": "Average",
            "dimensions": [
              {
                "name": "ResourceId",
                "value": "3efad9dc-3d50-4eac-9c87-8b3fd6f97e4e"
              }
            ],
            "metricValue": 7.727
          }
        ]
      }
    }
  }
}
Sample metric alerts
The following are sample metric alert payloads.
Metric alert with a static threshold and the monitoringService = Platform
{
  "alertContext": {
      "properties": null,
      "conditionType": "SingleResourceMultipleMetricCriteria",
      "condition": {
        "windowSize": "PT5M",
        "allOf": [
          {
            "metricName": "Percentage CPU",
            "metricNamespace": "Microsoft.Compute/virtualMachines",
            "operator": "GreaterThan",
            "threshold": "25",
            "timeAggregation": "Average",
            "dimensions": [
              {
                "name": "ResourceId",
                "value": "3efad9dc-3d50-4eac-9c87-8b3fd6f97e4e"
              }
            ],
            "metricValue": 31.1105
          }
        ],
        "windowStartTime": "2019-03-22T13:40:03.064Z",
        "windowEndTime": "2019-03-22T13:45:03.064Z"
      }
    }
}
Metric alert with a dynamic threshold and the monitoringService = Platform
{
  "alertContext": {
      "properties": null,
      "conditionType": "DynamicThresholdCriteria",
      "condition": {
        "windowSize": "PT5M",
        "allOf": [
          {
            "alertSensitivity": "High",
            "failingPeriods": {
              "numberOfEvaluationPeriods": 1,
              "minFailingPeriodsToAlert": 1
            },
            "ignoreDataBefore": null,
            "metricName": "Egress",
            "metricNamespace": "microsoft.storage/storageaccounts",
            "operator": "GreaterThan",
            "threshold": "47658",
            "timeAggregation": "Total",
            "dimensions": [],
            "metricValue": 50101
          }
        ],
        "windowStartTime": "2021-07-20T05:07:26.363Z",
        "windowEndTime": "2021-07-20T05:12:26.363Z"
      }
    }
}
Metric alert for availability tests and the monitoringService = Platform
{
  "alertContext": {
      "properties": null,
      "conditionType": "WebtestLocationAvailabilityCriteria",
      "condition": {
        "windowSize": "PT5M",
        "allOf": [
          {
            "metricName": "Failed Location",
            "metricNamespace": null,
            "operator": "GreaterThan",
            "threshold": "2",
            "timeAggregation": "Sum",
            "dimensions": [],
            "metricValue": 5,
            "webTestName": "myAvailabilityTest-myApplication"
          }
        ],
        "windowStartTime": "2019-03-22T13:40:03.064Z",
        "windowEndTime": "2019-03-22T13:45:03.064Z"
      }
    }
}
Sample log search alerts
Note
When you enable the common schema, the fields in the payload are reset to the common schema fields. Therefore, log search alerts have these limitations regarding the common schema:
- The common schema is not supported for log search alerts using webhooks with a custom email subject and/or JSON payload, since the common schema overwrites the custom configurations.
- Alerts using the common schema have an upper size limit of 256 KB per alert. If the log search alerts payload includes search results that cause the alert to exceed the maximum size, the search results aren't embedded in the log search alerts payload. You can check if the payload includes the search results with the
IncludedSearchResultsflag. UseLinkToFilteredSearchResultsAPIorLinkToSearchResultsAPIto access query results with the Log Analytics API if the search results are not included.
Log search alert with monitoringService = Platform
{
"alertContext": {
"SearchQuery": "Perf | where ObjectName == \"Processor\" and CounterName == \"% Processor Time\" | summarize AggregatedValue = avg(CounterValue) by bin(TimeGenerated, 5m), Computer",
"SearchIntervalStartTimeUtc": "3/22/2019 1:36:31 PM",
"SearchIntervalEndtimeUtc": "3/22/2019 1:51:31 PM",
"ResultCount": 2,
"LinkToSearchResults": "https://portal.azure.com/#Analyticsblade/search/index?_timeInterval.intervalEnd=2018-03-26T09%3a10%3a40.0000000Z&_timeInterval.intervalDuration=3600&q=Usage",
"LinkToFilteredSearchResultsUI": "https://portal.azure.com/#Analyticsblade/search/index?_timeInterval.intervalEnd=2018-03-26T09%3a10%3a40.0000000Z&_timeInterval.intervalDuration=3600&q=Usage",
"LinkToSearchResultsAPI": "https://api.loganalytics.io/v1/workspaces/workspaceID/query?query=Heartbeat×pan=2020-05-07T18%3a11%3a51.0000000Z%2f2020-05-07T18%3a16%3a51.0000000Z",
"LinkToFilteredSearchResultsAPI": "https://api.loganalytics.io/v1/workspaces/workspaceID/query?query=Heartbeat×pan=2020-05-07T18%3a11%3a51.0000000Z%2f2020-05-07T18%3a16%3a51.0000000Z",
"SeverityDescription": "Warning",
"WorkspaceId": "a0a0a0a0-bbbb-cccc-dddd-e1e1e1e1e1e1",
"SearchIntervalDurationMin": "15",
"AffectedConfigurationItems": [
"INC-Gen2Alert"
],
"SearchIntervalInMinutes": "15",
"Threshold": 10000,
"Operator": "Less Than",
"Dimensions": [
{
"name": "Computer",
"value": "INC-Gen2Alert"
}
],
"SearchResults": {
"tables": [
{
"name": "PrimaryResult",
"columns": [
{
"name": "$table",
"type": "string"
},
{
"name": "Computer",
"type": "string"
},
{
"name": "TimeGenerated",
"type": "datetime"
}
],
"rows": [
[
"Fabrikam",
"33446677a",
"2018-02-02T15:03:12.18Z"
],
[
"Contoso",
"33445566b",
"2018-02-02T15:16:53.932Z"
]
]
}
],
"dataSources": [
{
"resourceId": "/subscriptions/bbbb1b1b-cc2c-dd3d-ee4e-ffffff5f5f5f/resourcegroups/test/providers/microsoft.operationalinsights/workspaces/test",
"tables": [
"Heartbeat"
]
}
]
},
"IncludedSearchResults": "True",
"AlertType": "Metric measurement"
}
}
Log search alert with monitoringService = Application Insights
{
  "alertContext": {
    "SearchQuery": "requests | where resultCode == \"500\" | summarize AggregatedValue = Count by bin(Timestamp, 5m), IP",
    "SearchIntervalStartTimeUtc": "3/22/2019 1:36:33 PM",
    "SearchIntervalEndtimeUtc": "3/22/2019 1:51:33 PM",
    "ResultCount": 2,
    "LinkToSearchResults": "https://portal.azure.com/AnalyticsBlade/subscriptions/aaaa0a0a-bb1b-cc2c-dd3d-eeeeee4e4e4e/?query=search+*+&timeInterval.intervalEnd=2018-03-26T09%3a10%3a40.0000000Z&_timeInterval.intervalDuration=3600&q=Usage",
    "LinkToFilteredSearchResultsUI": "https://portal.azure.com/AnalyticsBlade/subscriptions/aaaa0a0a-bb1b-cc2c-dd3d-eeeeee4e4e4e/?query=search+*+&timeInterval.intervalEnd=2018-03-26T09%3a10%3a40.0000000Z&_timeInterval.intervalDuration=3600&q=Usage",
    "LinkToSearchResultsAPI": "https://api.applicationinsights.io/v1/apps/0MyAppId0/metrics/requests/count",
    "LinkToFilteredSearchResultsAPI": "https://api.applicationinsights.io/v1/apps/0MyAppId0/metrics/requests/count",
    "SearchIntervalDurationMin": "15",
    "SearchIntervalInMinutes": "15",
    "Threshold": 10000.0,
    "Operator": "Less Than",
    "ApplicationId": "00001111-aaaa-2222-bbbb-3333cccc4444",
    "Dimensions": [
      {
        "name": "IP",
        "value": "1.1.1.1"
      }
    ],
    "SearchResults": {
      "tables": [
        {
          "name": "PrimaryResult",
          "columns": [
            {
              "name": "$table",
              "type": "string"
            },
            {
              "name": "Id",
              "type": "string"
            },
            {
              "name": "Timestamp",
              "type": "datetime"
            }
          ],
          "rows": [
            [
              "Fabrikam",
              "33446677a",
              "2018-02-02T15:03:12.18Z"
            ],
            [
              "Contoso",
              "33445566b",
              "2018-02-02T15:16:53.932Z"
            ]
          ]
        }
      ],
      "dataSources": [
        {
          "resourceId": "/subscriptions/cccc2c2c-dd3d-ee4e-ff5f-aaaaaa6a6a6a/resourcegroups/test/providers/microsoft.operationalinsights/workspaces/test",
          "tables": [
            "Heartbeat"
          ]
        }
      ]
    },
    "IncludedSearchResults": "True",
    "AlertType": "Metric measurement"
  }
}
Log search alert with monitoringService = Log Alerts V2
Note
Log search alert rules from API version 2020-05-01 use this payload type, which only supports common schema. Search results aren't embedded in the log search alerts payload when you use this version. Use dimensions to provide context to fired alerts. You can also use LinkToFilteredSearchResultsAPI or LinkToSearchResultsAPI to access query results with the Log Analytics API. If you must embed the results, use a logic app with the provided links to generate a custom payload.
{
"alertContext": {
"properties": {
"name1": "value1",
"name2": "value2"
},
"conditionType": "LogQueryCriteria",
"condition": {
"windowSize": "PT10M",
"allOf": [
{
"searchQuery": "Heartbeat",
"metricMeasureColumn": "CounterValue",
"targetResourceTypes": "['Microsoft.Compute/virtualMachines']",
"operator": "LowerThan",
"threshold": "1",
"timeAggregation": "Count",
"dimensions": [
{
"name": "Computer",
"value": "TestComputer"
}
],
"metricValue": 0.0,
"failingPeriods": {
"numberOfEvaluationPeriods": 1,
"minFailingPeriodsToAlert": 1
},
"linkToSearchResultsUI": "https://portal.azure.com#@aaaabbbb-0000-cccc-1111-dddd2222eeee/blade/Microsoft_Azure_Monitoring_Logs/LogsBlade/source/Alerts.EmailLinks/scope/%7B%22resources%22%3A%5B%7B%22resourceId%22%3A%22%2Fsubscriptions%2aaaa0a0a-bb1b-cc2c-dd3d-eeeeee4e4e4e%2FresourceGroups%2FContoso%2Fproviders%2FMicrosoft.Compute%2FvirtualMachines%2FContoso%22%7D%5D%7D/q/eJzzSE0sKklKTSypUSjPSC1KVQjJzE11T81LLUosSU1RSEotKU9NzdNIAfJKgDIaRgZGBroG5roGliGGxlYmJlbGJnoGEKCpp4dDmSmKMk0A/prettify/1/timespan/2020-07-07T13%3a54%3a34.0000000Z%2f2020-07-09T13%3a54%3a34.0000000Z",
"linkToFilteredSearchResultsUI": "https://portal.azure.com#@aaaabbbb-0000-cccc-1111-dddd2222eeee/blade/Microsoft_Azure_Monitoring_Logs/LogsBlade/source/Alerts.EmailLinks/scope/%7B%22resources%22%3A%5B%7B%22resourceId%22%3A%22%2Fsubscriptions%2aaaa0a0a-bb1b-cc2c-dd3d-eeeeee4e4e4e%2FresourceGroups%2FContoso%2Fproviders%2FMicrosoft.Compute%2FvirtualMachines%2FContoso%22%7D%5D%7D/q/eJzzSE0sKklKTSypUSjPSC1KVQjJzE11T81LLUosSU1RSEotKU9NzdNIAfJKgDIaRgZGBroG5roGliGGxlYmJlbGJnoGEKCpp4dDmSmKMk0A/prettify/1/timespan/2020-07-07T13%3a54%3a34.0000000Z%2f2020-07-09T13%3a54%3a34.0000000Z",
"linkToSearchResultsAPI": "https://api.loganalytics.io/v1/subscriptions/aaaa0a0a-bb1b-cc2c-dd3d-eeeeee4e4e4e/resourceGroups/Contoso/providers/Microsoft.Compute/virtualMachines/Contoso/query?query=Heartbeat%7C%20where%20TimeGenerated%20between%28datetime%282020-07-09T13%3A44%3A34.0000000%29..datetime%282020-07-09T13%3A54%3A34.0000000%29%29×pan=2020-07-07T13%3a54%3a34.0000000Z%2f2020-07-09T13%3a54%3a34.0000000Z",
"linkToFilteredSearchResultsAPI": "https://api.loganalytics.io/v1/subscriptions/aaaa0a0a-bb1b-cc2c-dd3d-eeeeee4e4e4e/resourceGroups/Contoso/providers/Microsoft.Compute/virtualMachines/Contoso/query?query=Heartbeat%7C%20where%20TimeGenerated%20between%28datetime%282020-07-09T13%3A44%3A34.0000000%29..datetime%282020-07-09T13%3A54%3A34.0000000%29%29×pan=2020-07-07T13%3a54%3a34.0000000Z%2f2020-07-09T13%3a54%3a34.0000000Z"
}
],
"windowStartTime": "2020-07-07T13:54:34Z",
"windowEndTime": "2020-07-09T13:54:34Z"
}
}
}
Sample activity log alerts
Activity log alert with monitoringService = Activity Log - Administrative
{
  "alertContext": {
      "authorization": {
        "action": "Microsoft.Compute/virtualMachines/restart/action",
        "scope": "/subscriptions/<subscription ID>/resourceGroups/PipeLineAlertRG/providers/Microsoft.Compute/virtualMachines/WCUS-R2-ActLog"
      },
      "channels": "Operation",
      "claims": "{\"aud\":\"https://management.core.windows.net/\",\"iss\":\"https://sts.windows.net/aaaabbbb-0000-cccc-1111-dddd2222eeee/\",\"iat\":\"1553260826\",\"nbf\":\"1553260826\",\"exp\":\"1553264726\",\"aio\":\"42JgYNjdt+rr+3j/dx68v018XhuFAwA=\",\"appid\":\"11112222-bbbb-3333-cccc-4444dddd5555\",\"appidacr\":\"2\",\"http://schemas.microsoft.com/identity/claims/identityprovider\":\"https://sts.windows.net/aaaabbbb-0000-cccc-1111-dddd2222eeee/\",\"http://schemas.microsoft.com/identity/claims/objectidentifier\":\"22223333-cccc-4444-dddd-5555eeee6666\",\"http://schemas.xmlsoap.org/ws/2005/05/identity/claims/nameidentifier\":\"22223333-cccc-4444-dddd-5555eeee6666\",\"http://schemas.microsoft.com/identity/claims/tenantid\":\"aaaabbbb-0000-cccc-1111-dddd2222eeee\",\"uti\":\"v5wYC9t9ekuA2rkZSVZbAA\",\"ver\":\"1.0\"}",
      "caller": "22223333-cccc-4444-dddd-5555eeee6666",
      "correlationId": "aaaa0000-bb11-2222-33cc-444444dddddd",
      "eventSource": "Administrative",
      "eventTimestamp": "2019-03-22T13:56:31.2917159+00:00",
      "eventDataId": "161fda7e-1cb4-4bc5-9c90-857c55a8f57b",
      "level": "Informational",
      "operationName": "Microsoft.Compute/virtualMachines/restart/action",
      "operationId": "310db69b-690f-436b-b740-6103ab6b0cba",
      "status": "Succeeded",
      "subStatus": "",
      "submissionTimestamp": "2019-03-22T13:56:54.067593+00:00"
    }
}
Activity log alert with monitoringService = Activity Log - Policy
{
  "alertContext": {
    "authorization": {
      "action": "Microsoft.Resources/checkPolicyCompliance/read",
      "scope": "/subscriptions/<GUID>"
    },
    "channels": "Operation",
    "claims": "{\"aud\":\"https://management.azure.com/\",\"iss\":\"https://sts.windows.net/<GUID>/\",\"iat\":\"1566711059\",\"nbf\":\"1566711059\",\"exp\":\"1566740159\",\"aio\":\"42FgYOhynHNw0scy3T/bL71+xLyqEwA=\",\"appid\":\"<GUID>\",\"appidacr\":\"2\",\"http://schemas.microsoft.com/identity/claims/identityprovider\":\"https://sts.windows.net/<GUID>/\",\"http://schemas.microsoft.com/identity/claims/objectidentifier\":\"<GUID>\",\"http://schemas.xmlsoap.org/ws/2005/05/identity/claims/nameidentifier\":\"<GUID>\",\"http://schemas.microsoft.com/identity/claims/tenantid\":\"<GUID>\",\"uti\":\"Miy1GzoAG0Scu_l3m1aIAA\",\"ver\":\"1.0\"}",
    "caller": "<GUID>",
    "correlationId": "<GUID>",
    "eventSource": "Policy",
    "eventTimestamp": "2019-08-25T11:11:34.2269098+00:00",
    "eventDataId": "<GUID>",
    "level": "Warning",
    "operationName": "Microsoft.Authorization/policies/audit/action",
    "operationId": "<GUID>",
    "properties": {
      "isComplianceCheck": "True",
      "resourceLocation": "eastus2",
      "ancestors": "<GUID>",
      "policies": "[{\"policyDefinitionId\":\"/providers/Microsoft.Authorization/policyDefinitions/<GUID>/\",\"policySetDefinitionId\":\"/providers/Microsoft.Authorization/policySetDefinitions/<GUID>/\",\"policyDefinitionReferenceId\":\"vulnerabilityAssessmentMonitoring\",\"policySetDefinitionName\":\"<GUID>\",\"policyDefinitionName\":\"<GUID>\",\"policyDefinitionEffect\":\"AuditIfNotExists\",\"policyAssignmentId\":\"/subscriptions/<GUID>/providers/Microsoft.Authorization/policyAssignments/SecurityCenterBuiltIn/\",\"policyAssignmentName\":\"SecurityCenterBuiltIn\",\"policyAssignmentScope\":\"/subscriptions/<GUID>\",\"policyAssignmentSku\":{\"name\":\"A1\",\"tier\":\"Standard\"},\"policyAssignmentParameters\":{}}]"
    },
    "status": "Succeeded",
    "subStatus": "",
    "submissionTimestamp": "2019-08-25T11:12:46.1557298+00:00"
  }
}
Activity log alert with monitoringService = Activity Log - Autoscale
{
  "alertContext": {
    "channels": "Admin, Operation",
    "claims": "{\"http://schemas.xmlsoap.org/ws/2005/05/identity/claims/spn\":\"Microsoft.Insights/autoscaleSettings\"}",
    "caller": "Microsoft.Insights/autoscaleSettings",
    "correlationId": "<GUID>",
    "eventSource": "Autoscale",
    "eventTimestamp": "2019-08-21T16:17:47.1551167+00:00",
    "eventDataId": "<GUID>",
    "level": "Informational",
    "operationName": "Microsoft.Insights/AutoscaleSettings/Scaleup/Action",
    "operationId": "<GUID>",
    "properties": {
      "description": "The autoscale engine attempting to scale resource '/subscriptions/d<GUID>/resourceGroups/testRG/providers/Microsoft.Compute/virtualMachineScaleSets/testVMSS' from 9 instances count to 10 instances count.",
      "resourceName": "/subscriptions/<GUID>/resourceGroups/voiceassistancedemo/providers/Microsoft.Compute/virtualMachineScaleSets/alexademo",
      "oldInstancesCount": "9",
      "newInstancesCount": "10",
      "activeAutoscaleProfile": "{\r\n  \"Name\": \"Auto created scale condition\",\r\n  \"Capacity\": {\r\n    \"Minimum\": \"1\",\r\n    \"Maximum\": \"10\",\r\n    \"Default\": \"1\"\r\n  },\r\n  \"Rules\": [\r\n    {\r\n      \"MetricTrigger\": {\r\n        \"Name\": \"Percentage CPU\",\r\n        \"Namespace\": \"microsoft.compute/virtualmachinescalesets\",\r\n        \"Resource\": \"/subscriptions/<GUID>/resourceGroups/testRG/providers/Microsoft.Compute/virtualMachineScaleSets/testVMSS\",\r\n        \"ResourceLocation\": \"eastus\",\r\n        \"TimeGrain\": \"PT1M\",\r\n        \"Statistic\": \"Average\",\r\n        \"TimeWindow\": \"PT5M\",\r\n        \"TimeAggregation\": \"Average\",\r\n        \"Operator\": \"GreaterThan\",\r\n        \"Threshold\": 0.0,\r\n        \"Source\": \"/subscriptions/<GUID>/resourceGroups/testRG/providers/Microsoft.Compute/virtualMachineScaleSets/testVMSS\",\r\n        \"MetricType\": \"MDM\",\r\n        \"Dimensions\": [],\r\n        \"DividePerInstance\": false\r\n      },\r\n      \"ScaleAction\": {\r\n        \"Direction\": \"Increase\",\r\n        \"Type\": \"ChangeCount\",\r\n        \"Value\": \"1\",\r\n        \"Cooldown\": \"PT1M\"\r\n      }\r\n    }\r\n  ]\r\n}",
      "lastScaleActionTime": "Wed, 21 Aug 2019 16:17:47 GMT"
    },
    "status": "Succeeded",
    "submissionTimestamp": "2019-08-21T16:17:47.2410185+00:00"
  }
}
Activity log alert with monitoringService = Activity Log - Security
{
  "alertContext": {
    "channels": "Operation",
    "correlationId": "<GUID>",
    "eventSource": "Security",
    "eventTimestamp": "2019-08-26T08:34:14+00:00",
    "eventDataId": "<GUID>",
    "level": "Informational",
    "operationName": "Microsoft.Security/locations/alerts/activate/action",
    "operationId": "<GUID>",
    "properties": {
      "threatStatus": "Quarantined",
      "category": "Virus",
      "threatID": "2147519003",
      "filePath": "C:\\AlertGeneration\\test.eicar",
      "protectionType": "Windows Defender",
      "actionTaken": "Blocked",
      "resourceType": "Virtual Machine",
      "severity": "Low",
      "compromisedEntity": "testVM",
      "remediationSteps": "[\"No user action is necessary\"]",
      "attackedResourceType": "Virtual Machine"
    },
    "status": "Active",
    "submissionTimestamp": "2019-08-26T09:28:58.3019107+00:00"
  }
}
Activity log alert with monitoringService = ServiceHealth
{
  "alertContext": {
    "authorization": null,
    "channels": 1,
    "claims": null,
    "caller": null,
    "correlationId": "bbbb1111-cc22-3333-44dd-555555eeeeee",
    "eventSource": 2,
    "eventTimestamp": "2019-06-24T11:31:19.0312699+00:00",
    "httpRequest": null,
    "eventDataId": "<GUID>",
    "level": 3,
    "operationName": "Microsoft.ServiceHealth/maintenance/action",
    "operationId": "<GUID>",
    "properties": {
      "title": "Azure Synapse Analytics Scheduled Maintenance Pending",
      "service": "Azure Synapse Analytics",
      "region": "East US",
      "communication": "<MESSAGE>",
      "incidentType": "Maintenance",
      "trackingId": "<GUID>",
      "impactStartTime": "2019-06-26T04:00:00Z",
      "impactMitigationTime": "2019-06-26T12:00:00Z",
      "impactedServices": "[{\"ImpactedRegions\":[{\"RegionName\":\"East US\"}],\"ServiceName\":\"Azure Synapse Analytics\"}]",
      "impactedServicesTableRows": "<tr>\r\n<td align='center' style='padding: 5px 10px; border-right:1px solid black; border-bottom:1px solid black'>Azure Synapse Analytics</td>\r\n<td align='center' style='padding: 5px 10px; border-bottom:1px solid black'>East US<br></td>\r\n</tr>\r\n",
      "defaultLanguageTitle": "Azure Synapse Analytics Scheduled Maintenance Pending",
      "defaultLanguageContent": "<MESSAGE>",
      "stage": "Planned",
      "communicationId": "<GUID>",
      "maintenanceId": "<GUID>",
      "isHIR": "false",
      "version": "0.1.1"
    },
    "status": "Active",
    "subStatus": null,
    "submissionTimestamp": "2019-06-24T11:31:31.7147357+00:00",
    "ResourceType": null
  }
}
Activity log alert with monitoringService = ResourceHealth
{
  "alertContext": {
    "channels": "Admin, Operation",
    "correlationId": "<GUID>",
    "eventSource": "ResourceHealth",
    "eventTimestamp": "2019-06-24T15:42:54.074+00:00",
    "eventDataId": "<GUID>",
    "level": "Informational",
    "operationName": "Microsoft.Resourcehealth/healthevent/Activated/action",
    "operationId": "<GUID>",
    "properties": {
      "title": "This virtual machine is stopping and deallocating as requested by an authorized user or process",
      "details": null,
      "currentHealthStatus": "Unavailable",
      "previousHealthStatus": "Available",
      "type": "Downtime",
      "cause": "UserInitiated"
    },
    "status": "Active",
    "submissionTimestamp": "2019-06-24T15:45:20.4488186+00:00"
  }
}
Sample Prometheus alert
{
  "alertContext": {
    "interval": "PT1M",
    "expression": "sql_up > 0",
    "expressionValue": "0",
    "for": "PT2M",
    "labels": {
      "Environment": "Prod",
      "cluster": "myCluster1"
    },
    "annotations": {
      "summary": "alert on SQL availability"
    },
    "ruleGroup": "/subscriptions/<subscription ID>/resourceGroups/myResourceGroup/providers/Microsoft.AlertsManagement/prometheusRuleGroups/myRuleGroup"
  }
}
Sample payloads for test actions
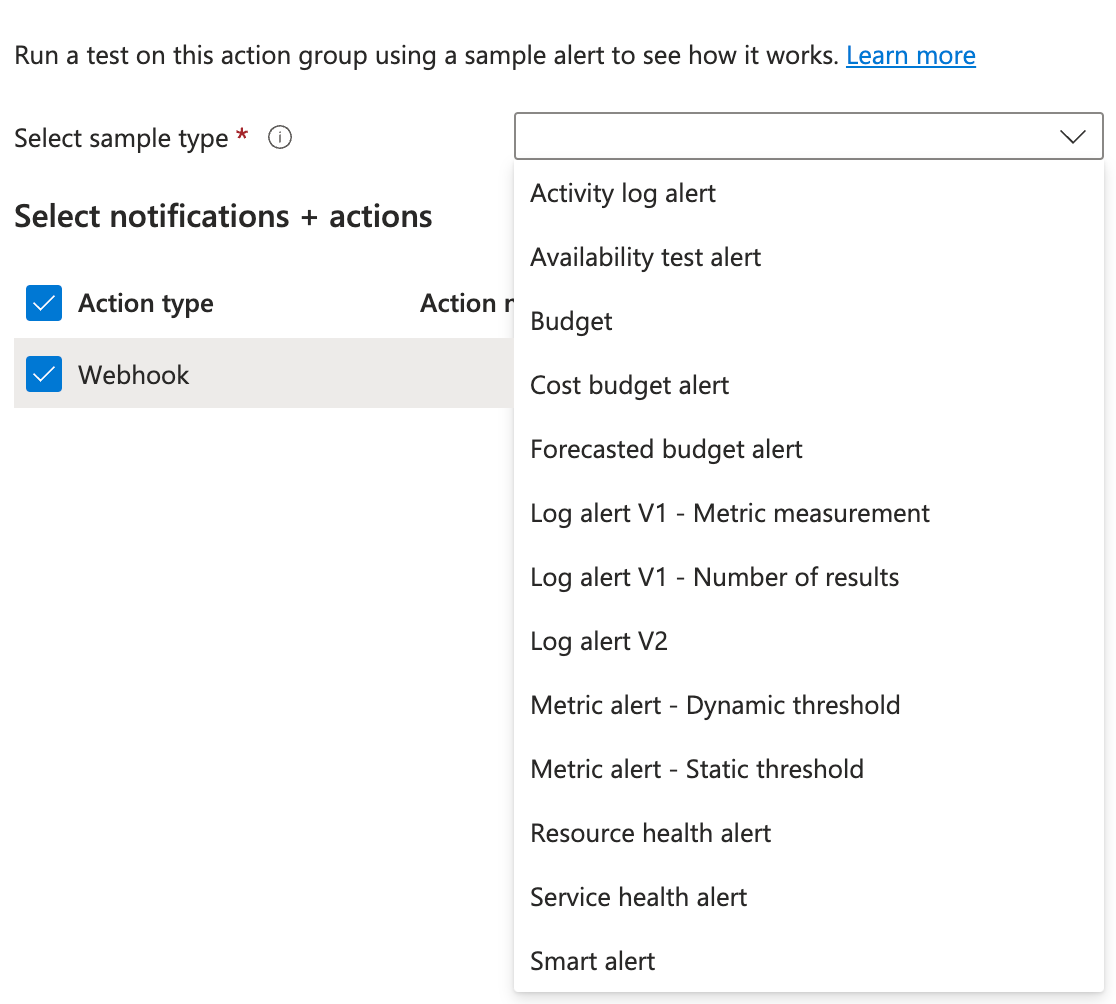
When configuring an Azure Action Group to route alert notifications (e.g., via webhook, Logic App, Azure Function, or Event Hub), it's important to verify that the receiving endpoint can handle the Common Alert Schema payload structure.
Azure provides a "Test Action" feature to simulate an alert and send a sample payload to the configured endpoints. This helps validate the integration without needing to trigger an actual resource condition.
This section describes the structure and content of the test payload sent when using the "Test Action Group" feature with the Common Alert Schema enabled.
Note
The test payload mimics a real alert but contains mocked metadata and does not represent any specific resource or condition.
Sample test action Activity log alert
{
  "schemaId": "azureMonitorCommonAlertSchema",
  "data": {
    "essentials": {
      "alertId": "/subscriptions/11111111-1111-1111-1111-111111111111/resourceGroups/test-RG/providers/microsoft.insights/activityLogAlerts/Test_Alert",
      "alertRule": "test-activityLogAlertRule",
      "severity": "Sev4",
      "signalType": "Activity Log",
      "monitorCondition": "Fired",
      "monitoringService": "Activity Log - Administrative",
      "alertTargetIDs": [
        "/subscriptions/11111111-1111-1111-1111-111111111111/resourcegroups/test-RG/providers/microsoft.compute/virtualmachines/test-VM"
      ],
      "configurationItems": [
        "test-VM"
      ],
      "originAlertId": "bbbbbbbb-bbbb-bbbb-bbbb-bbbbbbbbbbbb_123456789012345678901234567890ab",
      "firedDateTime": "2025-04-15T11:26:21.386Z",
      "description": "Alert rule description",
      "essentialsVersion": "1.0",
      "alertContextVersion": "1.0"
    },
    "alertContext": {
      "authorization": {
        "action": "Microsoft.Compute/virtualMachines/restart/action",
        "scope": "/subscriptions/11111111-1111-1111-1111-111111111111/resourceGroups/test-RG/providers/Microsoft.Compute/virtualMachines/test-VM"
      },
      "channels": "Operation",
      "claims": "{}",
      "caller": "user-email@domain.com",
      "correlationId": "aaaaaaaa-aaaa-aaaa-aaaa-aaaaaaaaaaaa",
      "eventSource": "Administrative",
      "eventTimestamp": "2025-04-15T11:26:21.386Z",
      "eventDataId": "bbbbbbbb-bbbb-bbbb-bbbb-bbbbbbbbbbbb",
      "level": "Informational",
      "operationName": "Microsoft.Compute/virtualMachines/restart/action",
      "operationId": "cccccccc-cccc-cccc-cccc-cccccccccccc",
      "properties": {
        "eventCategory": "Administrative",
        "entity": "/subscriptions/11111111-1111-1111-1111-111111111111/resourceGroups/test-RG/providers/Microsoft.Compute/virtualMachines/test-VM",
        "message": "Microsoft.Compute/virtualMachines/restart/action",
        "hierarchy": "22222222-2222-2222-2222-222222222222/CnAIOrchestrationServicePublicCorpprod/33333333-3333-3333-3333-3333333333333/44444444-4444-4444-4444-444444444444/55555555-5555-5555-5555-555555555555/11111111-1111-1111-1111-111111111111"
      },
      "status": "Succeeded",
      "subStatus": "",
      "submissionTimestamp": "2025-04-15T11:26:21.386Z",
      "Activity Log Event Description": ""
    }
  }
}
Sample test action Availability test alert
{
  "schemaId": "azureMonitorCommonAlertSchema",
  "data": {
    "essentials": {
      "alertId": "/subscriptions/11111111-1111-1111-1111-111111111111/providers/Microsoft.AlertsManagement/alerts/12345678-1234-1234-1234-1234567890ab",
      "alertRule": "test-availabilityTest-test-applicationInsights",
      "severity": "Sev4",
      "signalType": "Metric",
      "monitorCondition": "Fired",
      "monitoringService": "Platform",
      "alertTargetIDs": [
        "/subscriptions/11111111-1111-1111-1111-111111111111/resourcegroups/test-RG/providers/microsoft.insights/components/test-applicationInsights"
      ],
      "configurationItems": [
        "test-applicationInsights"
      ],
      "originAlertId": "11111111-1111-1111-1111-111111111111_test-RG_microsoft.insights_metricalerts_test-availabilityTest-test-applicationInsights_1234567890",
      "firedDateTime": "2025-04-15T17:42:34.824Z",
      "description": "Alertruledescription",
      "essentialsVersion": "1.0",
      "alertContextVersion": "1.0"
    },
    "alertContext": {
      "properties": null,
      "conditionType": "WebtestLocationAvailabilityCriteria",
      "condition": {
        "windowSize": "PT5M",
        "allOf": [
          {
            "metricName": "FailedLocation",
            "metricNamespace": null,
            "operator": "GreaterThan",
            "threshold": "2",
            "timeAggregation": "Sum",
            "dimensions": [],
            "metricValue": 5.0,
            "webTestName": "test-availabilityTest-test-applicationInsights"
          }
        ],
        "windowStartTime": "2025-04-15T17:42:34.824Z",
        "windowEndTime": "2025-04-15T17:42:34.824Z"
      }
    },
    "customProperties": {
      "customKey1": "value1",
      "customKey2": "value2"
    }
  }
}
Sample test action Budget alert
{
  "schemaId": "azureMonitorCommonAlertSchema",
  "data": {
    "essentials": {
      "monitoringService": "CostAlerts",
      "firedDateTime": "2025-04-15T17:49:34.022Z",
      "description": "Delivery Confirmation: This is a sample budget alert from Azure Monitor Action Groups.",
      "essentialsVersion": "1.0",
      "alertContextVersion": "1.0",
      "alertId": "/subscriptions/11111111-1111-1111-1111-111111111111/providers/Microsoft.CostManagement/alerts/Test_Alert",
      "alertRule": null,
      "severity": null,
      "signalType": null,
      "monitorCondition": "Fired",
      "alertTargetIDs": null,
      "configurationItems": [
        "budgets"
      ],
      "originAlertId": null
    },
    "alertContext": {
      "AlertCategory": "budgets",
      "AlertData": {
        "Scope": "/subscriptions/11111111-1111-1111-1111-111111111111/",
        "ThresholdType": "Forecasted",
        "BudgetType": "Cost",
        "BudgetThreshold": "$50.00",
        "NotificationThresholdAmount": "$50.00",
        "BudgetName": "Test_forcasted_budget",
        "BudgetId": "/subscriptions/11111111-1111-1111-1111-111111111111/providers/Microsoft.Consumption/budgets/Test_forcasted_budget",
        "BudgetStartDate": "2022-11-01",
        "BudgetCreator": "test@sample.test",
        "Unit": "USD",
        "SpentAmount": "$999.99",
        "ForecastedTotalForPeriod": "$1111.11"
      }
    }
  }
}
Sample test action Cost budget alert
{
  "schemaId": "azureMonitorCommonAlertSchema",
  "data": {
    "essentials": {
      "monitoringService": "CostAlerts",
      "firedDateTime": "2025-04-15T17:53:32.996Z",
      "description": "YourspendforbudgetTest_actual_cost_budgetisnow$11,111.00exceedingyourspecifiedthreshold$25.00.",
      "essentialsVersion": "1.0",
      "alertContextVersion": "1.0",
      "alertId": "/subscriptions/11111111-1111-1111-1111-111111111111/providers/Microsoft.CostManagement/alerts/Test_Alert",
      "alertRule": null,
      "severity": null,
      "signalType": null,
      "monitorCondition": "Fired",
      "alertTargetIDs": null,
      "configurationItems": [
        "budgets"
      ],
      "originAlertId": null
    },
    "alertContext": {
      "AlertCategory": "budgets",
      "AlertData": {
        "Scope": "/subscriptions/11111111-1111-1111-1111-111111111111/",
        "ThresholdType": "Actual",
        "BudgetType": "Cost",
        "BudgetThreshold": "$50.00",
        "NotificationThresholdAmount": "$25.00",
        "BudgetName": "Test_actual_cost_budget",
        "BudgetId": "/subscriptions/11111111-1111-1111-1111-111111111111/providers/Microsoft.Consumption/budgets/Test_actual_cost_budget",
        "BudgetStartDate": "2022-11-01",
        "BudgetCreator": "test@sample.test",
        "Unit": "USD",
        "SpentAmount": "$11,111.00"
      }
    }
  }
}
Sample test action Forecasted budget alert
{
  "schemaId": "azureMonitorCommonAlertSchema",
  "data": {
    "essentials": {
      "monitoringService": "CostAlerts",
      "firedDateTime": "2025-04-15T17:55:39.04Z",
      "description": "Thetotalspendforyourbudget,Test_forcasted_budget,isforecastedtoreach$1111.11beforetheendoftheperiod.Thisamountexceedsyourspecifiedbudgetthresholdof$50.00.",
      "essentialsVersion": "1.0",
      "alertContextVersion": "1.0",
      "alertId": "/subscriptions/11111111-1111-1111-1111-111111111111/providers/Microsoft.CostManagement/alerts/Test_Alert",
      "alertRule": null,
      "severity": null,
      "signalType": null,
      "monitorCondition": "Fired",
      "alertTargetIDs": null,
      "configurationItems": [
        "budgets"
      ],
      "originAlertId": null
    },
    "alertContext": {
      "AlertCategory": "budgets",
      "AlertData": {
        "Scope": "/subscriptions/11111111-1111-1111-1111-111111111111/",
        "ThresholdType": "Forecasted",
        "BudgetType": "Cost",
        "BudgetThreshold": "$50.00",
        "NotificationThresholdAmount": "$50.00",
        "BudgetName": "Test_forcasted_budget",
        "BudgetId": "/subscriptions/11111111-1111-1111-1111-111111111111/providers/Microsoft.Consumption/budgets/Test_forcasted_budget",
        "BudgetStartDate": "2022-11-01",
        "BudgetCreator": "test@sample.test",
        "Unit": "USD",
        "SpentAmount": "$999.99",
        "ForecastedTotalForPeriod": "$1111.11"
      }
    }
  }
}
Legacy Log alerts V1 in Action Group Testing
Azure still supports Log Alerts V1 in certain scenarios, including when using the "Test Action Group" feature. Log Alerts V1 represent an earlier generation of alerting on log data in Azure Monitor, preceding the unified Scheduled Query Rules API (v2) and broader adoption of the Common Alert Schema.
When selecting Log Alerts V1 as the alert type during a test, the payload structure and schema differ significantly from modern Common Alert Schema formats. This test is primarily relevant for legacy systems that were originally integrated using Log Alerts V1 notifications.
Note
Microsoft recommends migrating to Log alerts V2 to take advantage of improved schema consistency.
You should only test Log alerts V1 payloads if your receiving endpoint or automation is explicitly built for the older schema.
Sample test action Log alert V1 - Metric measurement
{
"schemaId": "azureMonitorCommonAlertSchema",
"data": {
"essentials": {
"alertId": "/subscriptions/11111111-1111-1111-1111-111111111111/providers/Microsoft.AlertsManagement/alerts/12345678-1234-1234-1234-1234567890ab",
"alertRule": "test-logAlertRule-v1-metricMeasurement",
"severity": "Sev4",
"signalType": "Log",
"monitorCondition": "Fired",
"monitoringService": "Log Analytics",
"alertTargetIDs": [
"/subscriptions/11111111-1111-1111-1111-111111111111/resourcegroups/test-RG/providers/microsoft.operationalinsights/workspaces/test-logAnalyticsWorkspace"
],
"configurationItems": [],
"originAlertId": "12345678-4444-4444-4444-1234567890ab",
"firedDateTime": "2025-04-15T17:57:27.967Z",
"description": "Alert rule description",
"essentialsVersion": "1.0",
"alertContextVersion": "1.1"
},
"alertContext": {
"SearchQuery": "Heartbeat | summarize AggregatedValue=count() by bin(TimeGenerated, 5m)",
"SearchIntervalStartTimeUtc": "2025-04-15T17:57:27.967Z",
"SearchIntervalEndtimeUtc": "2025-04-15T17:57:27.967Z",
"ResultCount": 2,
"LinkToSearchResults": "https://portal.azure.com#@aaaaaaaa-aaaa-aaaa-aaaa-aaaaaaaaaaaa/blade/Microsoft_Azure_Monitoring_Logs/LogsBlade/source/Alerts.EmailLinks/scope/%7B%22resources%22%3A%5B%7B%22resourceId%22%3A%22%2Fsubscriptions%2F11111111-1111-1111-1111-111111111111%2FresourceGroups%2Ftest-RG%2Fproviders%2FMicrosoft.OperationalInsights%2Fworkspaces%2Ftest-logAnalyticsWorkspace%22%7D%5D%7D/q/aBcDeFgHi%2BWqUSguzc1NLMqsSlVwTE8vSk1PLElNCUvMKU21Tc4vzSvRaBcDeFgHiaBcDeFgHiaBcDeFgHiaBcDeFgHi/prettify/1/timespan/2021-11-15T15%3a16%3a49.0000000Z%2f2021-11-16T15%3a16%3a49.0000000Z",
"LinkToFilteredSearchResultsUI": "https://portal.azure.com#@aaaaaaaa-aaaa-aaaa-aaaa-aaaaaaaaaaaa/blade/Microsoft_Azure_Monitoring_Logs/LogsBlade/source/Alerts.EmailLinks/scope/%7B%22resources%22%3A%5B%7B%22resourceId%22%3A%22%2Fsubscriptions%2F11111111-1111-1111-1111-111111111111%2FresourceGroups%2Ftest-RG%2Fproviders%2FMicrosoft.OperationalInsights%2Fworkspaces%2Ftest-logAnalyticsWorkspace%22%7D%5D%7D/q/aBcDeFgHiaBcDeFgHiaBcDeFgHiaBcDeFgHiaBcDeFgHidp%2BOPOhDKsHR%2FFeJXsTgzGJRmVui3KF3RpLyEJCX9A2iMl6jgxMn6jRevng3JmIHLdYtKP4DRI9mhc%3D/prettify/1/timespan/2021-11-15T15%3a16%3a49.0000000Z%2f2021-11-16T15%3a16%3a49.0000000Z",
"LinkToSearchResultsAPI": "https://api.loganalytics.io/v1/workspaces/bbbbbbbb-bbbb-bbbb-bbbb-bbbbbbbbbbbb/query?query=Heartbeat%20%0A%7C%20summarize%20AggregatedValue%3Dcount%28%29%20by%20bin%28TimeGenerated%2C%205m%29×pan=2021-11-15T15%3a16%3a49.0000000Z%2f2021-11-16T15%3a16%3a49.0000000Z",
"LinkToFilteredSearchResultsAPI": "https://api.loganalytics.io/v1/workspaces/bbbbbbbb-bbbb-bbbb-bbbb-bbbbbbbbbbbb/query?query=Heartbeat%20%0A%7C%20summarize%20AggregatedValue%3Dcount%28%29%20by%20bin%28TimeGenerated%2C%205m%29%7C%20where%20todouble%28AggregatedValue%29%20%3E%200×pan=2021-11-15T15%3a16%3a49.0000000Z%2f2021-11-16T15%3a16%3a49.0000000Z",
"SeverityDescription": "Informational",
"WorkspaceId": "bbbbbbbb-bbbb-bbbb-bbbb-bbbbbbbbbbbb",
"SearchIntervalDurationMin": "1440",
"AffectedConfigurationItems": [],
"AlertType": "Metric measurement",
"IncludeSearchResults": true,
"Dimensions": [],
"SearchIntervalInMinutes": "1440",
"SearchResults": {
"tables": [
{
"name": "PrimaryResult",
"columns": [
{
"name": "TimeGenerated",
"type": "datetime"
},
{
"name": "AggregatedValue",
"type": "long"
}
],
"rows": [
[
"2025-04-15T17:57:27.967Z",
11
],
[
"2025-04-15T17:57:27.967Z",
11
]
]
}
],
"dataSources": [
{
"resourceId": "/subscriptions/11111111-1111-1111-1111-111111111111/resourcegroups/test-RG/providers/microsoft.operationalinsights/workspaces/test-logAnalyticsWorkspace",
"region": "eastus",
"tables": [
"Heartbeat"
]
}
]
},
"Threshold": 0,
"Operator": "Greater Than",
"IncludedSearchResults": "True"
}
}
}
Sample test action Log alert V1 - Number of results
{
"schemaId": "azureMonitorCommonAlertSchema",
"data": {
"essentials": {
"alertId": "/subscriptions/11111111-1111-1111-1111-111111111111/providers/Microsoft.AlertsManagement/alerts/12345678-1234-1234-1234-1234567890ab",
"alertRule": "test-logAlertRule-v1-numResults",
"severity": "Sev4",
"signalType": "Log",
"monitorCondition": "Fired",
"monitoringService": "Log Analytics",
"alertTargetIDs": [
"/subscriptions/11111111-1111-1111-1111-111111111111/resourcegroups/test-RG/providers/microsoft.operationalinsights/workspaces/test-logAnalyticsWorkspace"
],
"configurationItems": [
"test-computer"
],
"originAlertId": "22222222-2222-2222-2222-222222222222",
"firedDateTime": "2025-04-15T18:04:40.852Z",
"description": "Alert rule description",
"essentialsVersion": "1.0",
"alertContextVersion": "1.1"
},
"alertContext": {
"SearchQuery": "Heartbeat",
"SearchIntervalStartTimeUtc": "2025-04-15T18:04:40.852Z",
"SearchIntervalEndtimeUtc": "2025-04-15T18:04:40.852Z",
"ResultCount": 1,
"LinkToSearchResults": "https://portal.azure.com#@aaaaaaaa-aaaa-aaaa-aaaa-aaaaaaaaaaaa/blade/Microsoft_Azure_Monitoring_Logs/LogsBlade/source/Alerts.EmailLinks/scope/%7B%22resources%22%3A%5B%7B%22resourceId%22%3A%22%2Fsubscriptions%2F11111111-1111-1111-1111-111111111111%2FresourceGroups%2Ftest-RG%2Fproviders%2FMicrosoft.OperationalInsights%2Fworkspaces%2Ftest-logAnalyticsWorkspace%22%7D%5D%7D/q/aBcDeFgHi%2ABCDE%3D%3D/prettify/1/timespan/2021-11-15T15%3a15%3a24.0000000Z%2f2021-11-16T15%3a15%3a24.0000000Z",
"LinkToFilteredSearchResultsUI": "https://portal.azure.com#@aaaaaaaa-aaaa-aaaa-aaaa-aaaaaaaaaaaa/blade/Microsoft_Azure_Monitoring_Logs/LogsBlade/source/Alerts.EmailLinks/scope/%7B%22resources%22%3A%5B%7B%22resourceId%22%3A%22%2Fsubscriptions%2F11111111-1111-1111-1111-111111111111%2FresourceGroups%2Ftest-RG%2Fproviders%2FMicrosoft.OperationalInsights%2Fworkspaces%2Ftest-logAnalyticsWorkspace%22%7D%5D%7D/q/aBcDeFgHi%2ABCDE%3D%3D/prettify/1/timespan/2021-11-15T15%3a15%3a24.0000000Z%2f2021-11-16T15%3a15%3a24.0000000Z",
"LinkToSearchResultsAPI": "https://api.loganalytics.io/v1/workspaces/bbbbbbbb-bbbb-bbbb-bbbb-bbbbbbbbbbbb/query?query=Heartbeat%0A×pan=2021-11-15T15%3a15%3a24.0000000Z%2f2021-11-16T15%3a15%3a24.0000000Z",
"LinkToFilteredSearchResultsAPI": "https://api.loganalytics.io/v1/workspaces/bbbbbbbb-bbbb-bbbb-bbbb-bbbbbbbbbbbb/query?query=Heartbeat%0A×pan=2021-11-15T15%3a15%3a24.0000000Z%2f2021-11-16T15%3a15%3a24.0000000Z",
"SeverityDescription": "Informational",
"WorkspaceId": "bbbbbbbb-bbbb-bbbb-bbbb-bbbbbbbbbbbb",
"SearchIntervalDurationMin": "1440",
"AffectedConfigurationItems": [
"test-computer"
],
"AlertType": "Number of results",
"IncludeSearchResults": true,
"SearchIntervalInMinutes": "1440",
"SearchResults": {
"tables": [
{
"name": "PrimaryResult",
"columns": [
{
"name": "TenantId",
"type": "string"
},
{
"name": "Computer",
"type": "string"
},
{
"name": "TimeGenerated",
"type": "datetime"
}
],
"rows": [
[
"bbbbbbbb-bbbb-bbbb-bbbb-bbbbbbbbbbbb",
"test-computer",
"2025-04-15T18:04:40.852Z"
]
]
}
],
"dataSources": [
{
"resourceId": "/subscriptions/11111111-1111-1111-1111-111111111111/resourcegroups/test-RG/providers/microsoft.operationalinsights/workspaces/test-logAnalyticsWorkspace",
"region": "eastus",
"tables": [
"Heartbeat"
]
}
]
},
"Threshold": 0,
"Operator": "Greater Than",
"IncludedSearchResults": "True"
}
}
}
Sample test action Log alert V2
Note
Log search alerts rules from API version 2020-05-01 use this payload type, which only supports common schema. Search results aren't embedded in the log search alerts payload when you use this version. Use dimensions to provide context to fired alerts.
You can also use LinkToFilteredSearchResultsAPI or LinkToSearchResultsAPI to access query results with the Log Analytics API. If you must embed the results, use a logic app with the provided links to generate a custom payload.
{
"schemaId": "azureMonitorCommonAlertSchema",
"data": {
"essentials": {
"alertId": "/subscriptions/11111111-1111-1111-1111-111111111111/providers/Microsoft.AlertsManagement/alerts/12345678-1234-1234-1234-1234567890ab",
"alertRule": "test-logAlertRule-v2",
"severity": "Sev4",
"signalType": "Log",
"monitorCondition": "Fired",
"monitoringService": "Log Alerts V2",
"alertTargetIDs": [
"/subscriptions/11111111-1111-1111-1111-111111111111/resourcegroups/test-RG/providers/microsoft.operationalinsights/workspaces/test-logAnalyticsWorkspace"
],
"configurationItems": [
"test-computer"
],
"originAlertId": "22222222-2222-2222-2222-222222222222",
"firedDateTime": "2025-04-15T18:08:03.626Z",
"description": "Alert rule description",
"essentialsVersion": "1.0",
"alertContextVersion": "1.0"
},
"alertContext": {
"properties": {
"customKey1": "value1",
"customKey2": "value2"
},
"conditionType": "LogQueryCriteria",
"condition": {
"windowSize": "PT1H",
"allOf": [
{
"searchQuery": "Heartbeat",
"metricMeasureColumn": null,
"targetResourceTypes": "['Microsoft.OperationalInsights/workspaces']",
"operator": "GreaterThan",
"threshold": "0",
"timeAggregation": "Count",
"dimensions": [
{
"name": "Computer",
"value": "test-computer"
}
],
"metricValue": 3.0,
"failingPeriods": {
"numberOfEvaluationPeriods": 1,
"minFailingPeriodsToAlert": 1
},
"linkToSearchResultsUI": "https://portal.azure.com#@aaaaaaaa-aaaa-aaaa-aaaa-aaaaaaaaaaaa/blade/Microsoft_Azure_Monitoring_Logs/LogsBlade/source/Alerts.EmailLinks/scope/%7B%22resources%22%3A%5B%7B%22resourceId%22%3A%22%2Fsubscriptions%2F11111111-1111-1111-1111-111111111111%2FresourceGroups%2Ftest-RG%2Fproviders%2FMicrosoft.OperationalInsights%2Fworkspaces%2Ftest-logAnalyticsWorkspace%22%7D%5D%7D/q/aBcDeFgHiJkLmNaBcDeFgHiJkLmNaBcDeFgHiJkLmNaBcDeFgHiJkLmN1234567890ZAZBZiaGBlaG5lbKlnAAFRmnp6WNUZoqvTBAA%3D/prettify/1/timespan/2021-11-16T10%3a17%3a39.0000000Z%2f2021-11-16T11%3a17%3a39.0000000Z",
"linkToFilteredSearchResultsUI": "https://portal.azure.com#@aaaaaaaa-aaaa-aaaa-aaaa-aaaaaaaaaaaa/blade/Microsoft_Azure_Monitoring_Logs/LogsBlade/source/Alerts.EmailLinks/scope/%7B%22resources%22%3A%5B%7B%22resourceId%22%3A%22%2Fsubscriptions%2F11111111-1111-1111-1111-111111111111%2FresourceGroups%2Ftest-RG%2Fproviders%2FMicrosoft.OperationalInsights%2Fworkspaces%2Ftest-logAnalyticsWorkspace%22%7D%5D%7D/q/aBcDeFgHiJkLmN%2Fl35oOTZoKioEOouaBcDeFgHiJkLmN%2BaBcDeFgHiJkLmN%2BaBcDeFgHiJkLmN7HHgOCZTR0Ak%2FaBcDeFgHiJkLmN1234567890Ltcw%2FOqZS%2FuX0L5d%2Bx3iMHNzQiu3Y%2BzsjpFSWlOzgA87vAxeHW2MoAtQxe6OUvVrZR3XYZPXrd%2FIE/prettify/1/timespan/2021-11-16T10%3a17%3a39.0000000Z%2f2021-11-16T11%3a17%3a39.0000000Z",
"linkToSearchResultsAPI": "https://api.loganalytics.io/v1/workspaces/bbbbbbbb-bbbb-bbbb-bbbb-bbbbbbbbbbbb/query?query=Heartbeat%7C%20where%20TimeGenerated%20between%28datetime%282021-11-16T10%3A17%3A39.0000000Z%29..datetime%282021-11-16T11%3A17%3A39.0000000Z%29%29×pan=2021-11-16T10%3a17%3a39.0000000Z%2f2021-11-16T11%3a17%3a39.0000000Z",
"linkToFilteredSearchResultsAPI": "https://api.loganalytics.io/v1/workspaces/bbbbbbbb-bbbb-bbbb-bbbb-bbbbbbbbbbbb/query?query=Heartbeat%7C%20where%20TimeGenerated%20between%28datetime%282021-11-16T10%3A17%3A39.0000000Z%29..datetime%282021-11-16T11%3A17%3A39.0000000Z%29%29%7C%20where%20tostring%28Computer%29%20%3D%3D%20%27test-computer%27×pan=2021-11-16T10%3a17%3a39.0000000Z%2f2021-11-16T11%3a17%3a39.0000000Z"
}
],
"windowStartTime": "2025-04-15T18:08:03.626Z",
"windowEndTime": "2025-04-15T18:08:03.626Z"
}
}
}
}
Sample test action Metric alert - Dynamic threshold
{
  "schemaId": "azureMonitorCommonAlertSchema",
  "data": {
    "essentials": {
      "alertId": "/subscriptions/11111111-1111-1111-1111-111111111111/providers/Microsoft.AlertsManagement/alerts/12345678-1234-1234-1234-1234567890ab",
      "alertRule": "test-dynamicMetricAlertRule",
      "severity": "Sev4",
      "signalType": "Metric",
      "monitorCondition": "Fired",
      "monitoringService": "Platform",
      "alertTargetIDs": [
        "/subscriptions/11111111-1111-1111-1111-111111111111/resourcegroups/test-RG/providers/Microsoft.Storage/storageAccounts/test-storageAccount"
      ],
      "configurationItems": [
        "test-storageAccount"
      ],
      "originAlertId": "11111111-1111-1111-1111-111111111111_test-RG_microsoft.insights_metricAlerts_test-metricAlertRule_1234567890",
      "firedDateTime": "2025-04-15T18:15:16.104Z",
      "description": "Alertruledescription",
      "essentialsVersion": "1.0",
      "alertContextVersion": "1.0"
    },
    "alertContext": {
      "properties": {
        "customKey1": "value1",
        "customKey2": "value2"
      },
      "conditionType": "DynamicThresholdCriteria",
      "condition": {
        "windowSize": "PT15M",
        "allOf": [
          {
            "alertSensitivity": "Low",
            "failingPeriods": {
              "numberOfEvaluationPeriods": 3,
              "minFailingPeriodsToAlert": 3
            },
            "ignoreDataBefore": null,
            "metricName": "Transactions",
            "metricNamespace": "Microsoft.Storage/storageAccounts",
            "operator": "GreaterThan",
            "threshold": "0.3",
            "timeAggregation": "Average",
            "dimensions": [],
            "metricValue": 78.09,
            "webTestName": null
          }
        ],
        "windowStartTime": "2025-04-15T18:15:16.104Z",
        "windowEndTime": "2025-04-15T18:15:16.104Z"
      }
    },
    "customProperties": {
      "customKey1": "value1",
      "customKey2": "value2"
    }
  }
}
Sample test action Metric alert - Static threshold
{
  "schemaId": "azureMonitorCommonAlertSchema",
  "data": {
    "essentials": {
      "alertId": "/subscriptions/11111111-1111-1111-1111-111111111111/providers/Microsoft.AlertsManagement/alerts/12345678-1234-1234-1234-1234567890ab",
      "alertRule": "test-metricAlertRule",
      "severity": "Sev4",
      "signalType": "Metric",
      "monitorCondition": "Fired",
      "monitoringService": "Platform",
      "alertTargetIDs": [
        "/subscriptions/11111111-1111-1111-1111-111111111111/resourcegroups/test-RG/providers/microsoft.storage/storageaccounts/test-storageAccount"
      ],
      "configurationItems": [
        "test-storageAccount"
      ],
      "originAlertId": "11111111-1111-1111-1111-111111111111_test-RG_microsoft.insights_metricAlerts_test-metricAlertRule_1234567890",
      "firedDateTime": "2025-04-15T18:17:12.851Z",
      "description": "Alertruledescription",
      "essentialsVersion": "1.0",
      "alertContextVersion": "1.0"
    },
    "alertContext": {
      "properties": {
        "customKey1": "value1",
        "customKey2": "value2"
      },
      "conditionType": "SingleResourceMultipleMetricCriteria",
      "condition": {
        "windowSize": "PT5M",
        "allOf": [
          {
            "metricName": "Transactions",
            "metricNamespace": "Microsoft.Storage/storageAccounts",
            "operator": "GreaterThan",
            "threshold": "0",
            "timeAggregation": "Total",
            "dimensions": [
              {
                "name": "ApiName",
                "value": "GetBlob"
              }
            ],
            "metricValue": 100,
            "webTestName": null
          }
        ],
        "windowStartTime": "2025-04-15T18:17:12.851Z",
        "windowEndTime": "2025-04-15T18:17:12.851Z"
      }
    },
    "customProperties": {
      "customKey1": "value1",
      "customKey2": "value2"
    }
  }
}
Sample test action Resource health alert
{
  "schemaId": "azureMonitorCommonAlertSchema",
  "data": {
    "essentials": {
      "alertId": "/subscriptions/11111111-1111-1111-1111-111111111111/providers/Microsoft.AlertsManagement/alerts/12345678-1234-1234-1234-1234567890ab",
      "alertRule": "test-ResourceHealthAlertRule",
      "severity": "Sev4",
      "signalType": "Activity Log",
      "monitorCondition": "Fired",
      "monitoringService": "Resource Health",
      "alertTargetIDs": [
        "/subscriptions/11111111-1111-1111-1111-111111111111/resourcegroups/test-RG/providers/microsoft.compute/virtualmachines/test-VM"
      ],
      "configurationItems": [
        "test-VM"
      ],
      "originAlertId": "bbbbbbbb-bbbb-bbbb-bbbb-bbbbbbbbbbbb_123456789012345678901234567890ab",
      "firedDateTime": "2025-04-15T18:19:45.304Z",
      "description": "Alert rule description",
      "essentialsVersion": "1.0",
      "alertContextVersion": "1.0"
    },
    "alertContext": {
      "channels": "Admin, Operation",
      "correlationId": "aaaaaaaa-aaaa-aaaa-aaaa-aaaaaaaaaaaa",
      "eventSource": "ResourceHealth",
      "eventTimestamp": "2025-04-15T18:19:45.304Z",
      "eventDataId": "bbbbbbbb-bbbb-bbbb-bbbb-bbbbbbbbbbbb",
      "level": "Informational",
      "operationName": "Microsoft.Resourcehealth/healthevent/Activated/action",
      "operationId": "bbbbbbbb-bbbb-bbbb-bbbb-bbbbbbbbbbbb",
      "properties": {
        "title": "Rebooted by user",
        "details": null,
        "currentHealthStatus": "Unavailable",
        "previousHealthStatus": "Available",
        "type": "Downtime",
        "cause": "UserInitiated"
      },
      "status": "Active",
      "submissionTimestamp": "2025-04-15T18:19:45.304Z",
      "Activity Log Event Description": null
    }
  }
}
Sample test action Service health alert
{
  "schemaId": "azureMonitorCommonAlertSchema",
  "data": {
    "essentials": {
      "alertId": "/subscriptions/11111111-1111-1111-1111-111111111111/providers/Microsoft.AlertsManagement/alerts/1234abcd5678efgh1234abcd5678efgh1234abcd5678efgh1234abcd5678efgh",
      "alertRule": "test-ServiceHealthAlertRule",
      "severity": "Sev4",
      "signalType": "ActivityLog",
      "monitorCondition": "Fired",
      "monitoringService": "ServiceHealth",
      "alertTargetIDs": [
        "/subscriptions/11111111-1111-1111-1111-111111111111"
      ],
      "originAlertId": "12345678-1234-1234-1234-1234567890ab",
      "firedDateTime": "2025-04-15T18:20:36.256Z",
      "description": "Alertruledescription",
      "essentialsVersion": "1.0",
      "alertContextVersion": "1.0"
    },
    "alertContext": {
      "authorization": null,
      "channels": 1,
      "claims": null,
      "caller": null,
      "correlationId": "12345678-abcd-efgh-ijkl-abcd12345678",
      "eventSource": 2,
      "eventTimestamp": "2025-04-15T18:20:36.256Z",
      "httpRequest": null,
      "eventDataId": "12345678-1234-1234-1234-1234567890ab",
      "level": 3,
      "operationName": "Microsoft.ServiceHealth/incident/action",
      "operationId": "12345678-abcd-efgh-ijkl-abcd12345678",
      "properties": {
        "title": "TestActionGroup-TestServiceHealthAlert",
        "service": "AzureServiceName",
        "region": "Global",
        "communication": "<p>ThisisatestfromServiceHealthAlert</p>",
        "incidentType": "Incident",
        "trackingId": "TEST-TTT",
        "impactStartTime": "2025-04-15T18:20:36.256Z",
        "impactMitigationTime": "2025-04-15T18:20:36.256Z",
        "impactedServices": [
          {
            "ImpactedRegions": [
              {
                "RegionName": "Global"
              }
            ],
            "ServiceName": "AzureServiceName"
          }
        ],
        "impactedServicesTableRows": "<tr><td>Thisisatestfromservicehealthalert</<td>/<tr>",
        "defaultLanguageTitle": "TestActionGroup-TestServiceHealthAlert",
        "defaultLanguageContent": "<p>ThisisatestfromServiceHealthAlert</p>",
        "stage": "Resolved",
        "communicationId": "11223344556677",
        "isHIR": "false",
        "IsSynthetic": "True",
        "impactType": "SubscriptionList",
        "version": "0.1.1"
      },
      "status": "Resolved",
      "subStatus": null,
      "submissionTimestamp": "2025-04-15T18:20:36.256Z",
      "ResourceType": null
    }
  }
}
Sample test action Smart alert
{
  "schemaId": "azureMonitorCommonAlertSchema",
  "data": {
    "essentials": {
      "alertId": "/subscriptions/11111111-1111-1111-1111-111111111111/providers/Microsoft.AlertsManagement/alerts/12345678-1234-1234-1234-1234567890ab",
      "alertRule": "test-SmartAlertRule",
      "severity": "Sev4",
      "signalType": "Log",
      "monitorCondition": "Fired",
      "monitoringService": "SmartDetector",
      "alertTargetIDs": [
        "/subscriptions/11111111-1111-1111-1111-111111111111/resourcegroups/test-RG/providers/microsoft.insights/components/test-applicationInsights"
      ],
      "configurationItems": [
        "test-applicationInsights"
      ],
      "originAlertId": "1234abcd5678efgh1234abcd5678efgh1234abcd5678efgh1234abcd5678efgh",
      "firedDateTime": "2021-10-28T19:09:09.1115084Z",
      "description": "Dependency Latency Degradation notifies you of an unusual increase in response by a dependency your app is calling (e.g. REST API or database)",
      "essentialsVersion": "1.0",
      "alertContextVersion": "1.0"
    },
    "alertContext": {
      "DetectionSummary": "A degradation in the dependency duration over the last 24 hours",
      "FormattedOccurrenceTime": "2025-04-15T18:23:16.577Z",
      "DetectedValue": "0.45 sec",
      "NormalValue": "0.27 sec (over the last 7 days)",
      "PresentationInsightEventRequest": "/subscriptions/11111111-1111-1111-1111-111111111111/resourceGroups/test-RG/providers/microsoft.insights/components/test-applicationInsights/query?query=systemEvents%0d%0a++++++++++++++++%7c+where+timestamp+%3e%3d+datetime(%272021-10-27T23%3a29%3a59.0000000Z%27)+%0d%0a++++++++++++++++%7c+where+itemType+%3d%3d+%27systemEvent%27+and+name+%3d%3d+%27ProactiveDetectionInsight%27+%0d%0a++++++++++++++++%7c+where+dimensions.InsightType+%3d%3d+3+%0d%0a++++++++++++++++%7c+where+dimensions.InsightVersion+%3d%3d+%27SmartAlert%27%0d%0a++++++++++++++++%7c+where+dimensions.InsightDocumentId+%3d%3d+%2712345678-abcd-1234-5678-abcd12345678%27+%0d%0a++++++++++++++++%7c+project+dimensions.InsightPropertiesTable%2cdimensions.InsightDegradationChart%2cdimensions.InsightCountChart%2cdimensions.InsightLinksTable%0d%0a++++++++++++++++&api-version=2018-04-20",
      "SmartDetectorId": "DependencyPerformanceDegradationDetector",
      "SmartDetectorName": "Dependency Performance Degradation Detector",
      "AnalysisTimestamp": "2025-04-15T18:23:16.577Z"
    }
  }
}