Manage alert rules created in previous versions
This article describes the process of managing alert rules created in the previous UI or by using API version 2018-04-16 or earlier. Alert rules created in the latest UI are viewed and managed in the new UI, as described in Create, view, and manage log search alerts by using Azure Monitor.
Changes to the log search alert rule creation experience
The current alert rule wizard is different from the earlier experience:
- Previously, search results were included in the payload of the triggered alert and its associated notifications. The email included only 10 rows from the unfiltered results while the webhook payload contained 1,000 unfiltered results. To get detailed context information about the alert so that you can decide on the appropriate action:
- We recommend using dimensions. Dimensions provide the column value that fired the alert, which gives you context for why the alert fired and how to fix the issue.
- When you need to investigate in the logs, use the link in the alert to the search results in logs.
- If you need the raw search results or for any other advanced customizations, use Azure Logic Apps.
- The new alert rule wizard doesn't support customization of the JSON payload.
- Use custom properties in the new API to add static parameters and associated values to the webhook actions triggered by the alert.
- For more advanced customizations, use Azure Logic Apps.
- The new alert rule wizard doesn't support customization of the email subject.
- Customers often use the custom email subject to indicate the resource on which the alert fired, instead of using the Log Analytics workspace. Use the new API to trigger an alert of the desired resource by using the resource ID column.
- For more advanced customizations, use Azure Logic Apps.
Manage alert rules created in previous versions in the Azure portal
In the Azure portal, select the resource you want.
Under Monitoring, select Alerts.
On the top bar, select Alert rules.
Select the alert rule that you want to edit.
In the Condition section, select the condition.
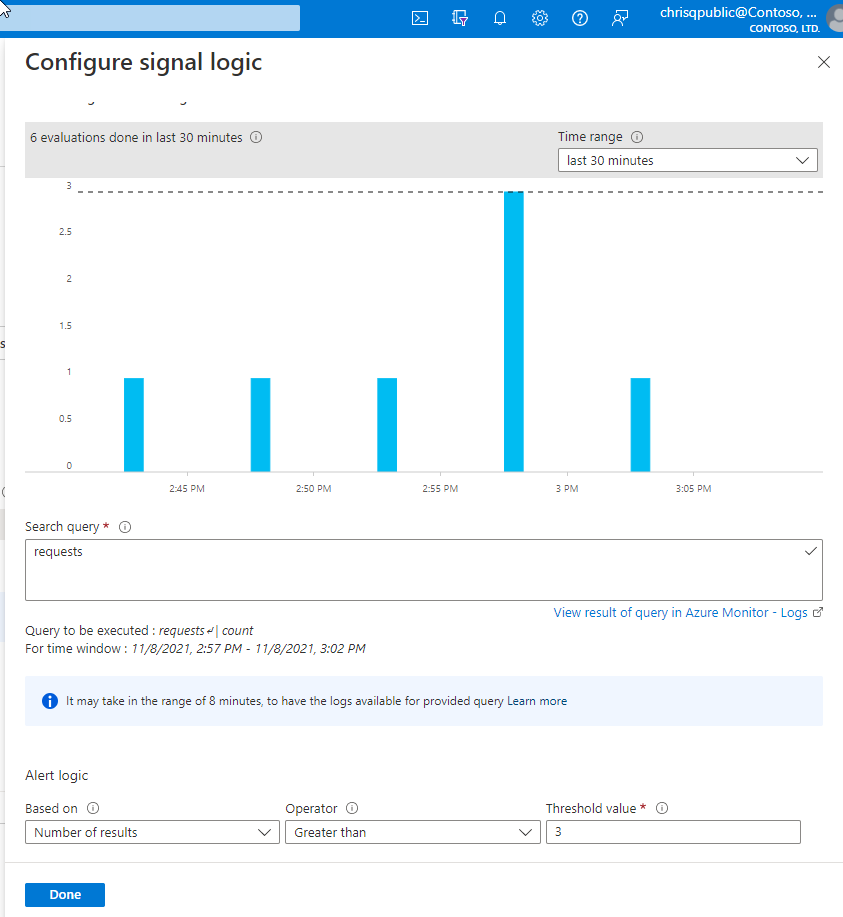
The Configure signal logic pane opens with historical data for the query that appears as a graph. You can change the Time range of the chart to display data from the last six hours to last week. If your query results contain summarized data or specific columns without the time column, the chart shows a single value.
Edit the alert rule conditions by using these sections:
Search query: In this section, you can modify your query.
Alert logic: Log search alerts can be based on two types of measures:
- Number of results: Count of records returned by the query.
- Metric measurement: Aggregate value is calculated by using
summarizegrouped by the expressions chosen and the bin() selection. For example:// Reported errors union Event, Syslog // Event table stores Windows event records, Syslog stores Linux records | where EventLevelName == "Error" // EventLevelName is used in the Event (Windows) records or SeverityLevel== "err" // SeverityLevel is used in Syslog (Linux) records | summarize AggregatedValue = count() by Computer, bin(TimeGenerated, 15m)
For metric measurements alert logic, you can specify how to split the alerts by dimensions by using the Aggregate on option. The row grouping expression must be unique and sorted.
The bin() function can result in uneven time intervals, so the alert service automatically converts the bin() function to a binat() function with appropriate time at runtime to ensure results with a fixed point.
Note
The Split by alert dimensions option is only available for the current scheduledQueryRules API. If you use the legacy Log Analytics Alert API, you'll need to switch. Learn more about switching. Resource-centric alerting at scale is only supported in the API version
2021-08-01and later.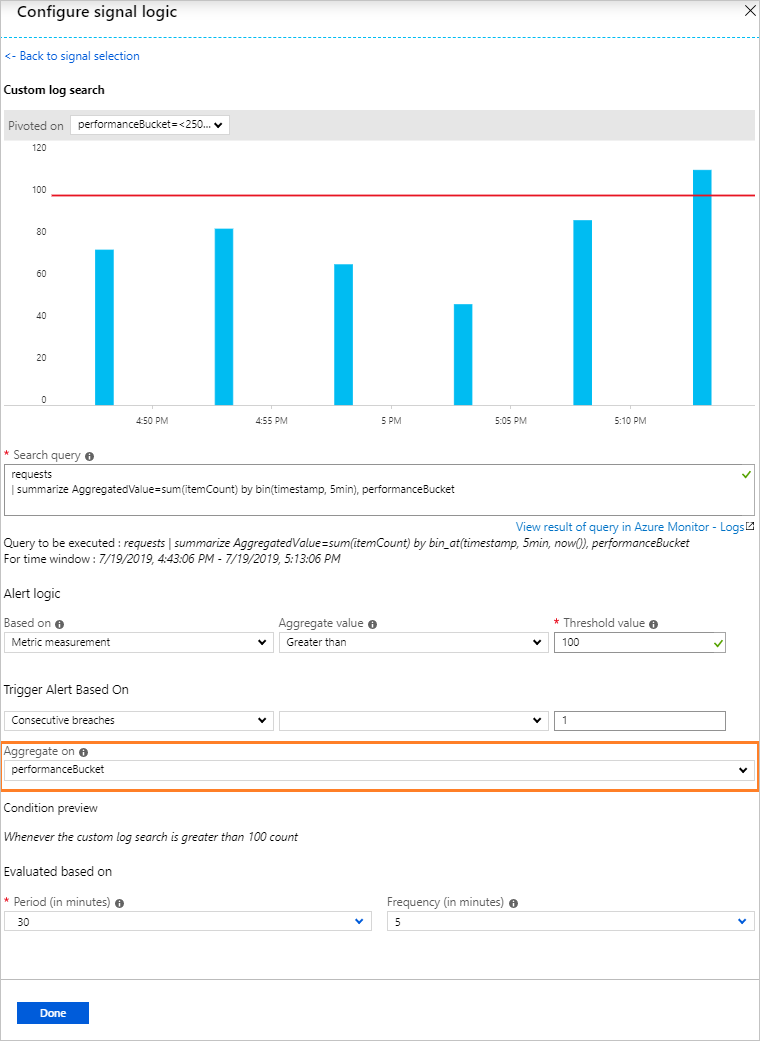
Period: Choose the time range over which to assess the specified condition by using the Period option.
When you're finished editing the conditions, select Done.
Use the preview data to set the Operator, Threshold value, and Frequency.
Set the number of violations to trigger an alert by using Total or Consecutive breaches.
Select Done.
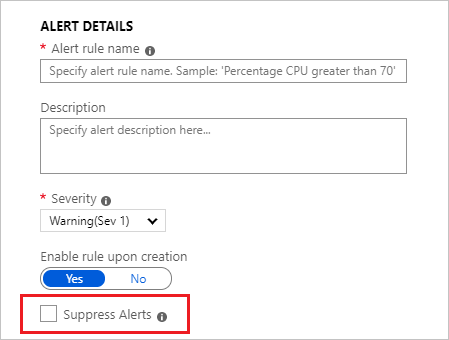
You can edit the rule Description and Severity. These details are used in all alert actions. You can also choose to not activate the alert rule on creation by selecting Enable rule upon creation.
Use the Suppress Alerts option if you want to suppress rule actions for a specified time after an alert is fired. The rule will still run and create alerts, but actions won't be triggered to prevent noise. The Mute actions value must be greater than the frequency of the alert to be effective.
To make alerts stateful, select Automatically resolve alerts (preview).
Specify if the alert rule should trigger one or more action groups when the alert condition is met. For limits on the actions that can be performed, see Azure Monitor service limits.
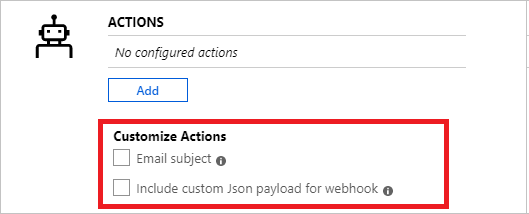
(Optional) Customize actions in log search alert rules:
- Custom email subject: Overrides the email subject of email actions. You can't modify the body of the mail and this field isn't for email addresses.
- Include custom Json payload for webhook: Overrides the webhook JSON used by action groups, assuming that the action group contains a webhook action. Learn more about webhook actions for log search alerts.
After you've finished editing all the alert rule options, select Save.


Manage log search alerts using PowerShell
Note
We recommend that you use the Azure Az PowerShell module to interact with Azure. To get started, see Install Azure PowerShell. To learn how to migrate to the Az PowerShell module, see Migrate Azure PowerShell from AzureRM to Az.
Use the following PowerShell cmdlets to manage rules with the Scheduled Query Rules API:
- New-AzScheduledQueryRule: PowerShell cmdlet to create a new log search alert rule.
- Set-AzScheduledQueryRule: PowerShell cmdlet to update an existing log search alert rule.
- New-AzScheduledQueryRuleSource: PowerShell cmdlet to create or update the object that specifies source parameters for a log search alert. Used as input by the New-AzScheduledQueryRule and Set-AzScheduledQueryRule cmdlets.
- New-AzScheduledQueryRuleSchedule: PowerShell cmdlet to create or update the object that specifies schedule parameters for a log search alert. Used as input by the New-AzScheduledQueryRule and Set-AzScheduledQueryRule cmdlets.
- New-AzScheduledQueryRuleAlertingAction: PowerShell cmdlet to create or update the object that specifies action parameters for a log search alert. Used as input by the New-AzScheduledQueryRule and Set-AzScheduledQueryRule cmdlets.
- New-AzScheduledQueryRuleAznsActionGroup: PowerShell cmdlet to create or update the object that specifies action group parameters for a log search alert. Used as input by the New-AzScheduledQueryRuleAlertingAction cmdlet.
- New-AzScheduledQueryRuleTriggerCondition: PowerShell cmdlet to create or update the object that specifies trigger condition parameters for a log search alert. Used as input by the New-AzScheduledQueryRuleAlertingAction cmdlet.
- New-AzScheduledQueryRuleLogMetricTrigger: PowerShell cmdlet to create or update the object that specifies metric trigger condition parameters for a metric measurement log search alert. Used as input by the New-AzScheduledQueryRuleTriggerCondition cmdlet.
- Get-AzScheduledQueryRule: PowerShell cmdlet to list existing log search alert rules or a specific log search alert rule.
- Update-AzScheduledQueryRule: PowerShell cmdlet to enable or disable a log search alert rule.
- Remove-AzScheduledQueryRule: PowerShell cmdlet to delete an existing log search alert rule.
Note
The ScheduledQueryRules PowerShell cmdlets can only manage rules created in this version of the Scheduled Query Rules API. Log search alert rules created by using the legacy Log Analytics Alert API can only be managed by using PowerShell after you switch to the Scheduled Query Rules API.
Example steps for creating a log search alert rule by using PowerShell:
$source = New-AzScheduledQueryRuleSource -Query 'Heartbeat | summarize AggregatedValue = count() by bin(TimeGenerated, 5m), _ResourceId' -DataSourceId "/subscriptions/a123d7efg-123c-1234-5678-a12bc3defgh4/resourceGroups/contosoRG/providers/microsoft.OperationalInsights/workspaces/servicews"
$schedule = New-AzScheduledQueryRuleSchedule -FrequencyInMinutes 15 -TimeWindowInMinutes 30
$metricTrigger = New-AzScheduledQueryRuleLogMetricTrigger -ThresholdOperator "GreaterThan" -Threshold 2 -MetricTriggerType "Consecutive" -MetricColumn "_ResourceId"
$triggerCondition = New-AzScheduledQueryRuleTriggerCondition -ThresholdOperator "LessThan" -Threshold 5 -MetricTrigger $metricTrigger
$aznsActionGroup = New-AzScheduledQueryRuleAznsActionGroup -ActionGroup "/subscriptions/a123d7efg-123c-1234-5678-a12bc3defgh4/resourceGroups/contosoRG/providers/microsoft.insights/actiongroups/sampleAG" -EmailSubject "Custom email subject" -CustomWebhookPayload "{ `"alert`":`"#alertrulename`", `"IncludeSearchResults`":true }"
$alertingAction = New-AzScheduledQueryRuleAlertingAction -AznsAction $aznsActionGroup -Severity "3" -Trigger $triggerCondition
New-AzScheduledQueryRule -ResourceGroupName "contosoRG" -Location "Region Name for your Application Insights App or Log Analytics Workspace" -Action $alertingAction -Enabled $true -Description "Alert description" -Schedule $schedule -Source $source -Name "Alert Name"
Example steps for creating a log search alert rule by using PowerShell with cross-resource queries:
$authorized = @ ("/subscriptions/a123d7efg-123c-1234-5678-a12bc3defgh4/resourceGroups/contosoRG/providers/microsoft.OperationalInsights/workspaces/servicewsCrossExample", "/subscriptions/a123d7efg-123c-1234-5678-a12bc3defgh4/resourceGroups/contosoRG/providers/microsoft.insights/components/serviceAppInsights")
$source = New-AzScheduledQueryRuleSource -Query 'Heartbeat | summarize AggregatedValue = count() by bin(TimeGenerated, 5m), _ResourceId' -DataSourceId "/subscriptions/a123d7efg-123c-1234-5678-a12bc3defgh4/resourceGroups/contosoRG/providers/microsoft.OperationalInsights/workspaces/servicews" -AuthorizedResource $authorized
$schedule = New-AzScheduledQueryRuleSchedule -FrequencyInMinutes 15 -TimeWindowInMinutes 30
$metricTrigger = New-AzScheduledQueryRuleLogMetricTrigger -ThresholdOperator "GreaterThan" -Threshold 2 -MetricTriggerType "Consecutive" -MetricColumn "_ResourceId"
$triggerCondition = New-AzScheduledQueryRuleTriggerCondition -ThresholdOperator "LessThan" -Threshold 5 -MetricTrigger $metricTrigger
$aznsActionGroup = New-AzScheduledQueryRuleAznsActionGroup -ActionGroup "/subscriptions/a123d7efg-123c-1234-5678-a12bc3defgh4/resourceGroups/contosoRG/providers/microsoft.insights/actiongroups/sampleAG" -EmailSubject "Custom email subject" -CustomWebhookPayload "{ `"alert`":`"#alertrulename`", `"IncludeSearchResults`":true }"
$alertingAction = New-AzScheduledQueryRuleAlertingAction -AznsAction $aznsActionGroup -Severity "3" -Trigger $triggerCondition
New-AzScheduledQueryRule -ResourceGroupName "contosoRG" -Location "Region Name for your Application Insights App or Log Analytics Workspace" -Action $alertingAction -Enabled $true -Description "Alert description" -Schedule $schedule -Source $source -Name "Alert Name"
You can also create the log search alert by using a template and parameters files using PowerShell:
Connect-AzAccount
Select-AzSubscription -SubscriptionName <yourSubscriptionName>
New-AzResourceGroupDeployment -Name AlertDeployment -ResourceGroupName ResourceGroupofTargetResource `
  -TemplateFile mylogalerttemplate.json -TemplateParameterFile mylogalerttemplate.parameters.json
Next steps
- Learn about log search alerts.
- Create log search alerts by using Azure Resource Manager templates.
- Understand webhook actions for log search alerts.
- Learn more about log queries.