Application Insights availability tests
After you deploy your web app or website, you can set up recurring tests to monitor availability and responsiveness. Application Insights sends web requests to your application at regular intervals from points around the world. It can alert you if your application isn't responding or responds too slowly. You can create up to 100 availability tests per Application Insights resource.
Availability tests don't require any changes to the website you're testing and work for any HTTP or HTTPS endpoint that's accessible from the public internet. You can also test the availability of a REST API that your service depends on.
Note
Availability tests are stored encrypted, according to Azure data encryption at rest policies.
Types of availability tests
There are four types of availability tests:
Standard test: This is a type of availability test that checks the availability of a website by sending a single request, similar to the deprecated URL ping test. In addition to validating whether an endpoint is responding and measuring the performance, Standard tests also include TLS/SSL certificate validity, proactive lifetime check, HTTP request verb (for example,
GET,HEAD, andPOST), custom headers, and custom data associated with your HTTP request.Custom TrackAvailability test: If you decide to create a custom application to run availability tests, you can use the TrackAvailability() method to send the results to Application Insights.
(Deprecated) Multi-step web test: You can play back this recording of a sequence of web requests to test more complex scenarios. Multi-step web tests are created in Visual Studio Enterprise and uploaded to the portal, where you can run them.
(Deprecated) URL ping test: You can create this test through the Azure portal to validate whether an endpoint is responding and measure performance associated with that response. You can also set custom success criteria coupled with more advanced features, like parsing dependent requests and allowing for retries.
Important
There are two upcoming availability tests retirements:
Multi-step web tests: On August 31, 2024, multi-step web tests in Application Insights will be retired. We advise users of these tests to transition to alternative availability tests before the retirement date. Following this date, we will be taking down the underlying infrastructure which will break remaining multi-step tests.
URL ping tests: On September 30, 2026, URL ping tests in Application Insights will be retired. Existing URL ping tests will be removed from your resources. Review the pricing for standard tests and transition to using them before September 30, 2026 to ensure you can continue to run single-step availability tests in your Application Insights resources.
Create an availability test
Tip
If you're currently using other availability tests, like URL ping tests, you might add Standard tests alongside the others. If you want to use Standard tests instead of one of your other tests, add a Standard test and delete your old test.
Prerequisites
Get started
Go to your Application Insights resource and select the Availability pane.
Select Add Standard test.
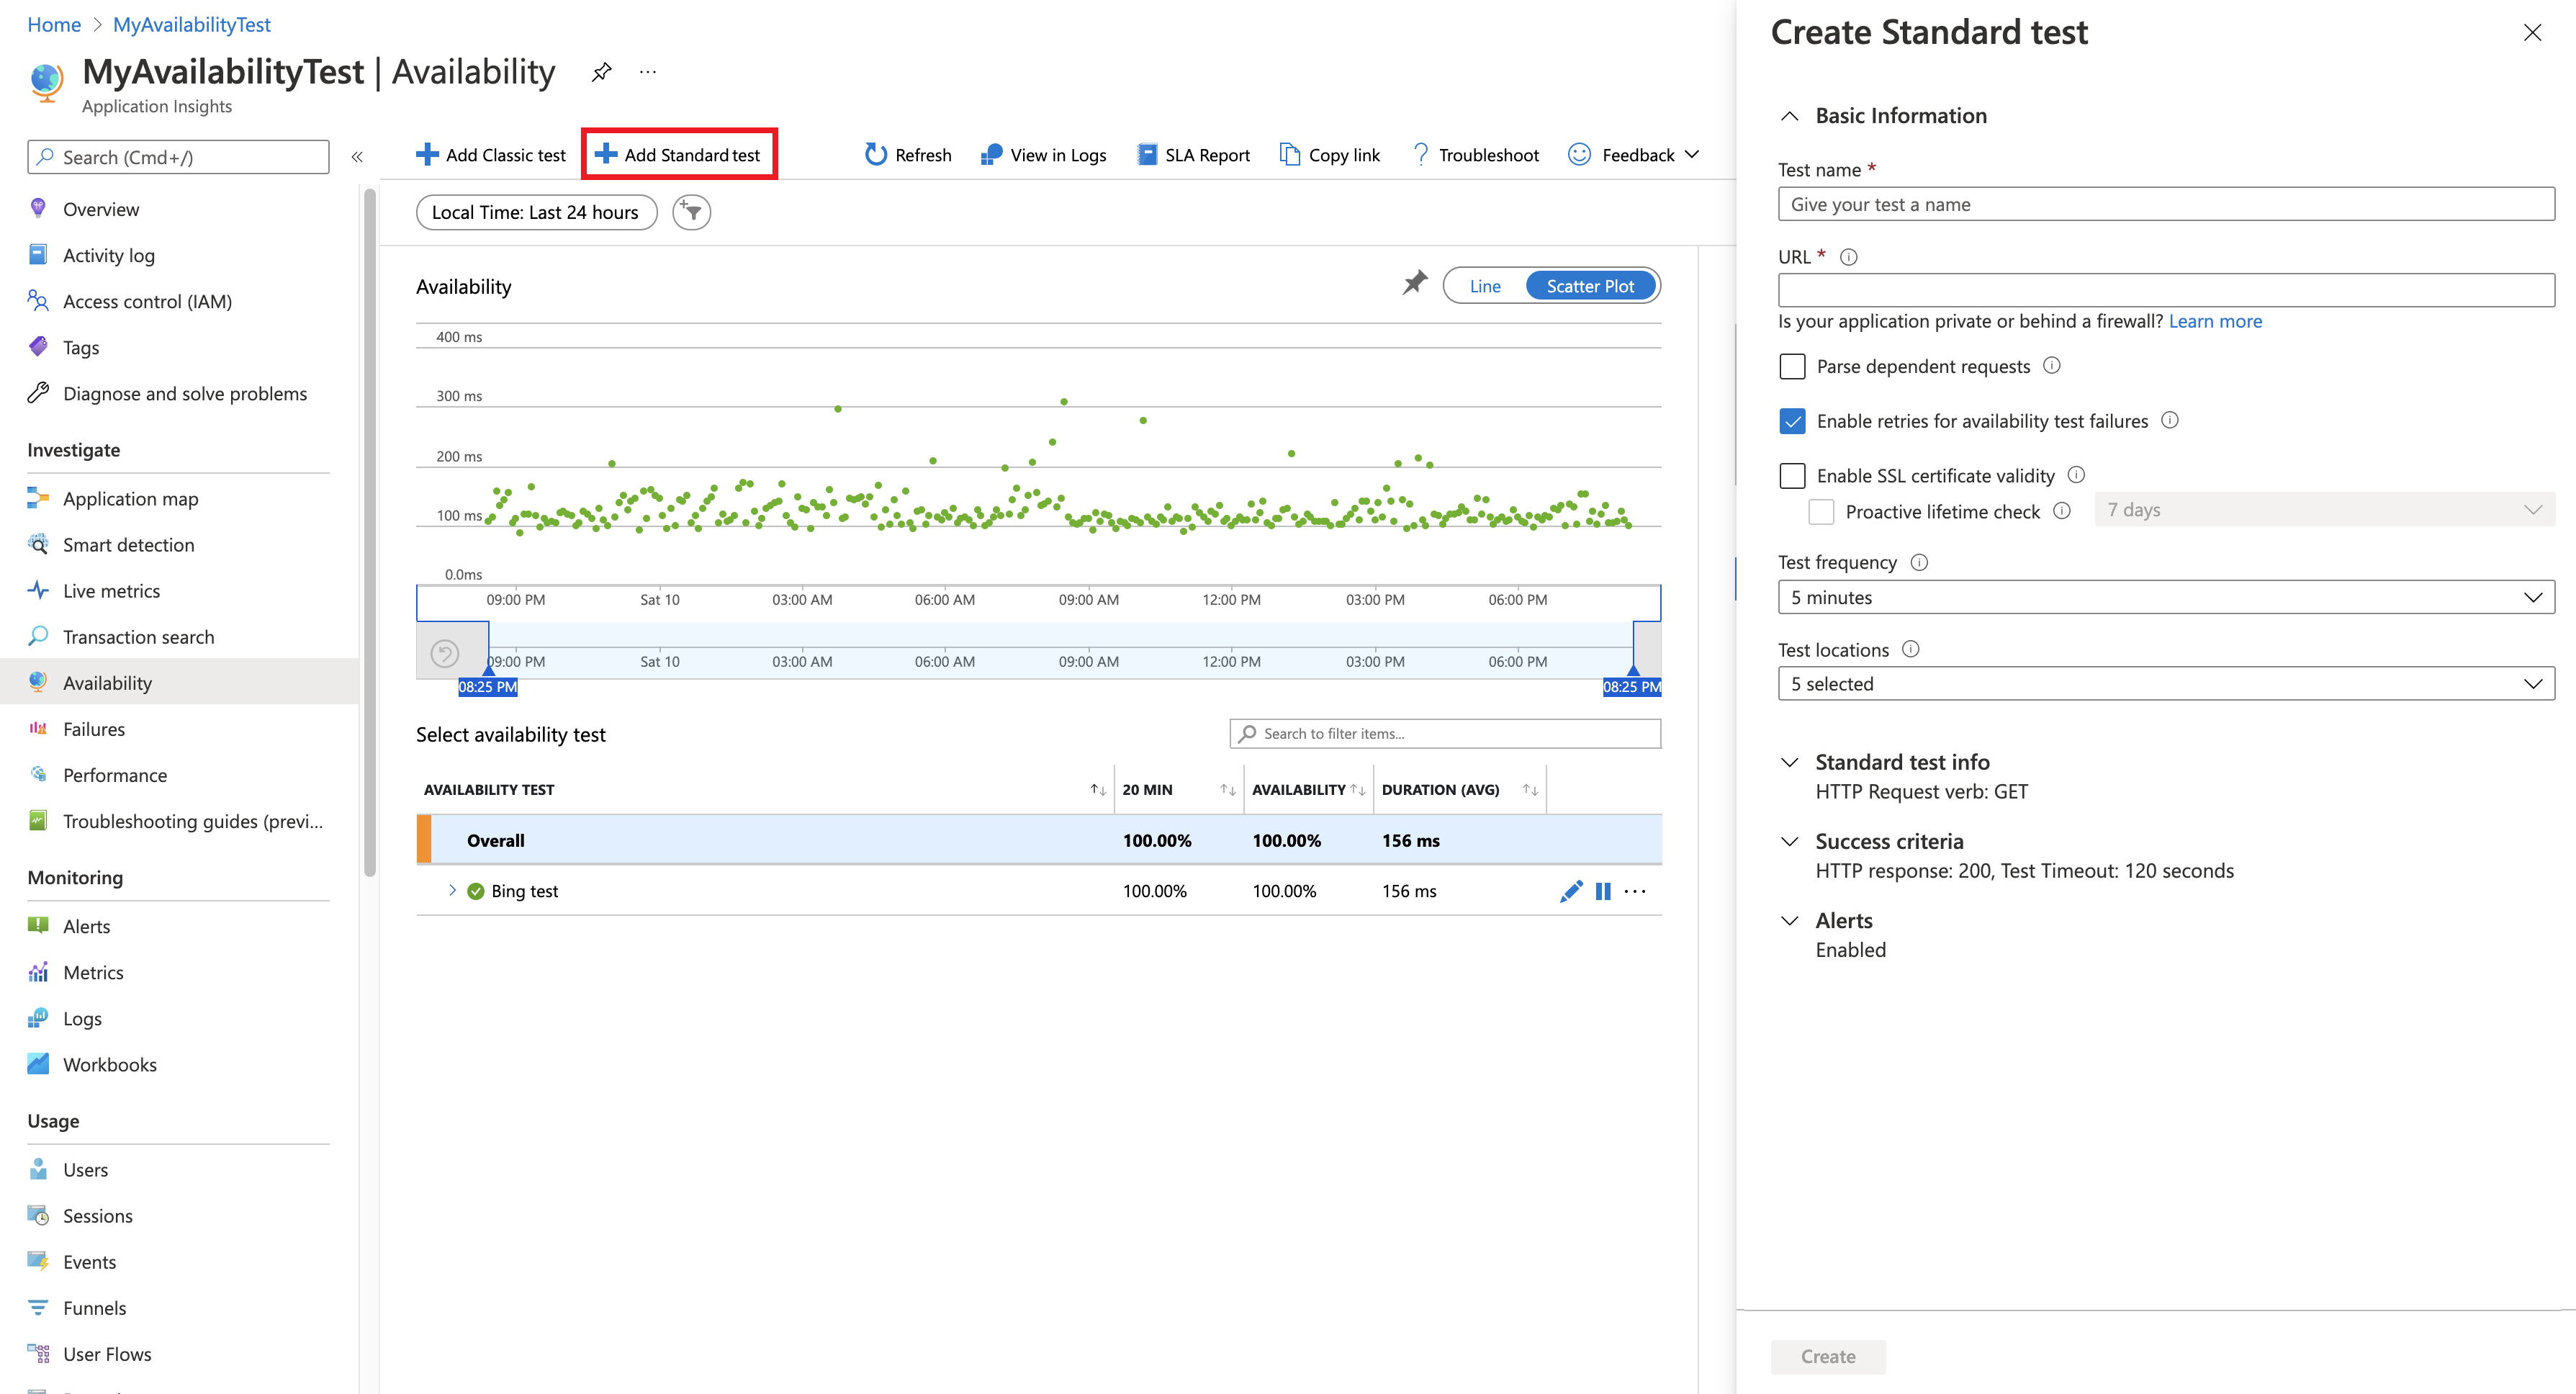
Input your test name, URL, and other settings that are described in the following table. Then, select Create.
Setting Description URL The URL can be any webpage you want to test, but it must be visible from the public internet. The URL can include a query string. So, for example, you can exercise your database a little. If the URL resolves to a redirect, we follow it up to 10 redirects. Parse dependent requests Test requests images, scripts, style files, and other files that are part of the webpage under test. The recorded response time includes the time taken to get these files. The test fails if any of these resources can't be successfully downloaded within the timeout for the whole test. If the option isn't selected, the test only requests the file at the URL you specified. Enabling this option results in a stricter check. The test could fail for cases, which might not be noticeable when you manually browse the site. Please note, we parse only up to 15 dependent requests. Enable retries When the test fails, it's retried after a short interval. A failure is reported only if three successive attempts fail. Subsequent tests are then performed at the usual test frequency. Retry is temporarily suspended until the next success. This rule is applied independently at each test location. We recommend this option. On average, about 80% of failures disappear on retry. SSL certificate validation test You can verify the SSL certificate on your website to make sure it's correctly installed, valid, trusted, and doesn't give any errors to any of your users. Proactive lifetime check This setting enables you to define a set time period before your SSL certificate expires. After it expires, your test will fail. Test frequency Sets how often the test is run from each test location. With a default frequency of five minutes and five test locations, your site is tested on average every minute. Test locations Our servers send web requests to your URL from these locations. Our minimum number of recommended test locations is five to ensure that you can distinguish problems in your website from network issues. You can select up to 16 locations. Custom headers Key value pairs that define the operating parameters. HTTP request verb Indicate what action you want to take with your request. Request body Custom data associated with your HTTP request. You can upload your own files, enter your content, or disable this feature.

Success criteria
| Setting | Description |
|---|---|
| Test timeout | Decrease this value to be alerted about slow responses. The test is counted as a failure if the responses from your site haven't been received within this period. If you selected Parse dependent requests, all the images, style files, scripts, and other dependent resources must have been received within this period. |
| HTTP response | The returned status code that's counted as a success. The number 200 is the code that indicates that a normal webpage has been returned. |
| Content match | A string, like "Welcome!" We test that an exact case-sensitive match occurs in every response. It must be a plain string, without wildcards. Don't forget that if your page content changes, you might have to update it. Only English characters are supported with content match. |


Availability alerts
| Setting | Description |
|---|---|
| Near real time | We recommend using near real time alerts. Configuring this type of alert is done after your availability test is created. |
| Alert location threshold | We recommend a minimum of 3/5 locations. The optimal relationship between alert location threshold and the number of test locations is alert location threshold = number of test locations - 2, with a minimum of five test locations. |
Location population tags
You can use the following population tags for the geo-location attribute when you deploy an availability URL ping test by using Azure Resource Manager.
Azure
| Display name | Population name |
|---|---|
| Australia East | emea-au-syd-edge |
| Brazil South | latam-br-gru-edge |
| Central US | us-fl-mia-edge |
| East Asia | apac-hk-hkn-azr |
| East US | us-va-ash-azr |
| France South (Formerly France Central) | emea-ch-zrh-edge |
| France Central | emea-fr-pra-edge |
| Japan East | apac-jp-kaw-edge |
| North Europe | emea-gb-db3-azr |
| North Central US | us-il-ch1-azr |
| South Central US | us-tx-sn1-azr |
| Southeast Asia | apac-sg-sin-azr |
| UK West | emea-se-sto-edge |
| West Europe | emea-nl-ams-azr |
| West US | us-ca-sjc-azr |
| UK South | emea-ru-msa-edge |
Azure Government
| Display name | Population name |
|---|---|
| USGov Virginia | usgov-va-azr |
| USGov Arizona | usgov-phx-azr |
| USGov Texas | usgov-tx-azr |
| USDoD East | usgov-ddeast-azr |
| USDoD Central | usgov-ddcentral-azr |
Microsoft Azure operated by 21Vianet
| Display name | Population name |
|---|---|
| China East | mc-cne-azr |
| China East 2 | mc-cne2-azr |
| China North | mc-cnn-azr |
| China North 2 | mc-cnn2-azr |
Enable alerts
Alerts are now automatically enabled by default, but to fully configure an alert, you must initially create your availability test.
Note
With the new unified alerts, the alert rule severity and notification preferences with action groups must be configured in the alerts experience. Without the following steps, you'll only receive in-portal notifications.
After you save the availability test, on the Details tab, select the ellipsis by the test you made. Select Open Rules (Alerts) page.
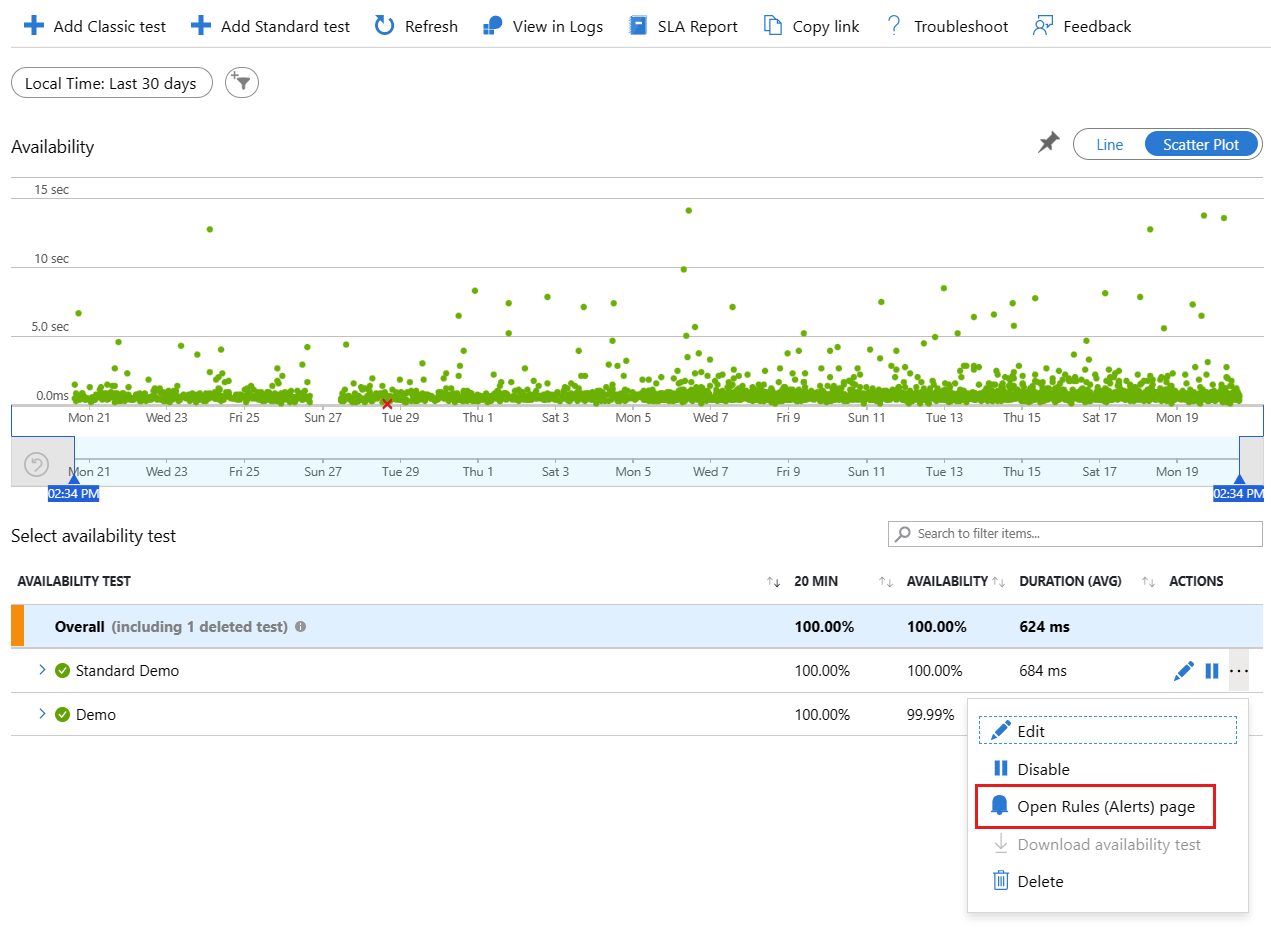
Set the severity level, rule description, and action group that have the notification preferences you want to use for this alert rule.

Alert criteria
Automatically enabled availability alerts trigger an email when the endpoint you've defined is unavailable and when it's available again. Availability alerts that are created through this experience are state based. When the alert criteria are met, a single alert gets generated when the website is detected as unavailable. If the website is still down the next time the alert criteria is evaluated, it won't generate a new alert.
For example, suppose that your website is down for an hour and you've set up an email alert with an evaluation frequency of 15 minutes. You'll only receive an email when the website goes down and another email when it's back online. You won't receive continuous alerts every 15 minutes to remind you that the website is still unavailable.
You might not want to receive notifications when your website is down for only a short period of time, for example, during maintenance. You can change the evaluation frequency to a higher value than the expected downtime, up to 15 minutes. You can also increase the alert location threshold so that it only triggers an alert if the website is down for a specific number of regions. For longer scheduled downtimes, temporarily deactivate the alert rule or create a custom rule. It gives you more options to account for the downtime.
Change the alert criteria
To make changes to the location threshold, aggregation period, and test frequency, select the condition on the edit page of the alert rule to open the "Configure signal logic" window.
Create a custom alert rule
If you need advanced capabilities, you can create a custom alert rule on the Alerts tab. Select Create > Alert rule. Choose Metrics for Signal type to show all available signals and select Availability.
A custom alert rule offers higher values for the aggregation period (up to 24 hours instead of 6 hours) and the test frequency (up to 1 hour instead of 15 minutes). It also adds options to further define the logic by selecting different operators, aggregation types, and threshold values.
Alert on X out of Y locations reporting failures: The X out of Y locations alert rule is enabled by default in the new unified alerts experience when you create a new availability test. You can opt out by selecting the "classic" option or by choosing to disable the alert rule. Configure the action groups to receive notifications when the alert triggers by following the preceding steps. Without this step, you'll only receive in-portal notifications when the rule triggers.
Alert on availability metrics: By using the new unified alerts, you can alert on segmented aggregate availability and test duration metrics too:
Select an Application Insights resource in the Metrics experience, and select an Availability metric.
The Configure alerts option from the menu takes you to the new experience where you can select specific tests or locations on which to set up alert rules. You can also configure the action groups for this alert rule here.
Alert on custom analytics queries: By using the new unified alerts, you can alert on custom log queries. With custom queries, you can alert on any arbitrary condition that helps you get the most reliable signal of availability issues. It's also applicable if you're sending custom availability results by using the TrackAvailability SDK.
The metrics on availability data include any custom availability results you might be submitting by calling the TrackAvailability SDK. You can use the alerting on metrics support to alert on custom availability results.
Automate alerts
To automate this process with Azure Resource Manager templates, see Create a metric alert with an Azure Resource Manager template.
See your availability test results
This section explains how to review availability test results in the Azure portal and query the data using Log Analytics. Availability test results can be visualized with both Line and Scatter Plot views.
Check availability
Start by reviewing the graph on the Availability tab of your Application Insights resource.
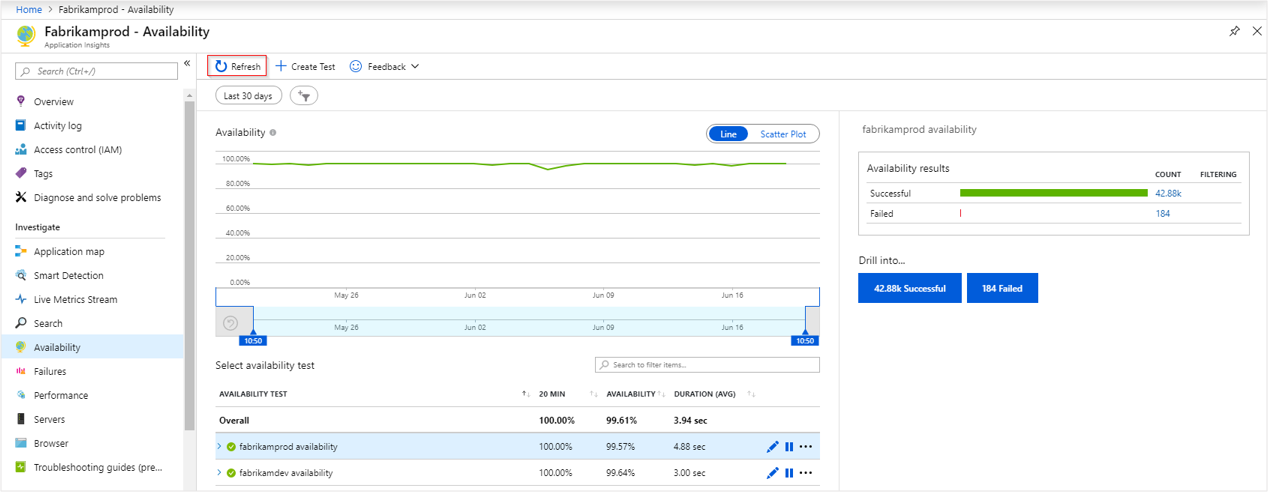

The Scatter Plot view shows samples of the test results that have diagnostic test-step detail in them. The test engine stores diagnostic detail for tests that have failures. For successful tests, diagnostic details are stored for a subset of the executions. Hover over any of the green/red dots to see the test, test name, and location.
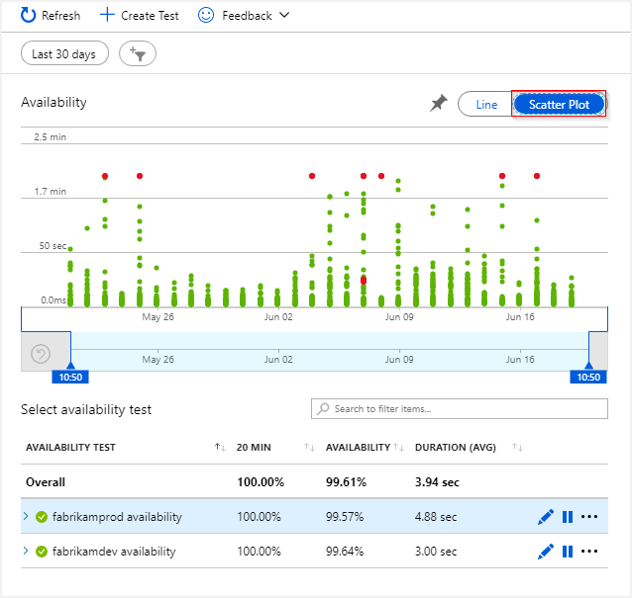
Select a particular test or location. Or you can reduce the time period to see more results around the time period of interest. Use Search Explorer to see results from all executions. Or you can use Log Analytics queries to run custom reports on this data.
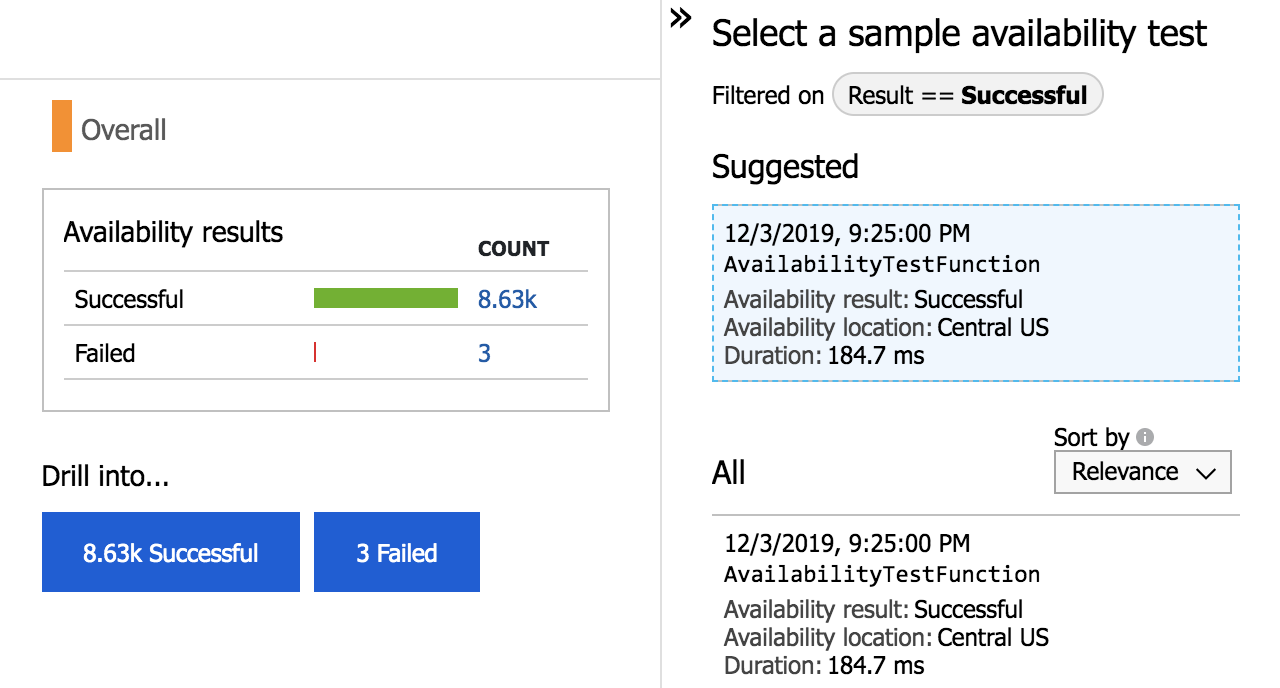
To see the end-to-end transaction details, under Drill into, select Successful or Failed. Then select a sample. You can also get to the end-to-end transaction details by selecting a data point on the graph.

Inspect and edit tests
To edit, temporarily disable, or delete a test, select the ellipses next to a test name. It might take up to 20 minutes for configuration changes to propagate to all test agents after a change is made.
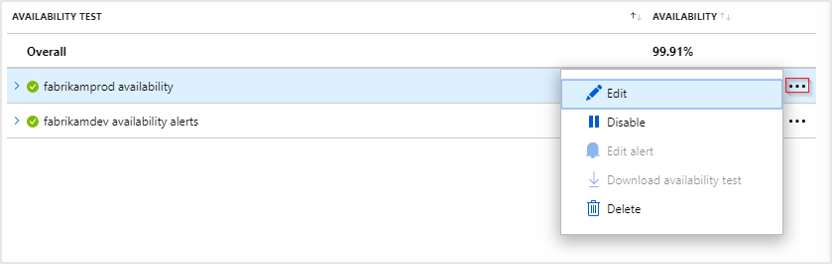
You might want to disable availability tests or the alert rules associated with them while you're performing maintenance on your service.
If you see failures
Select a red dot.
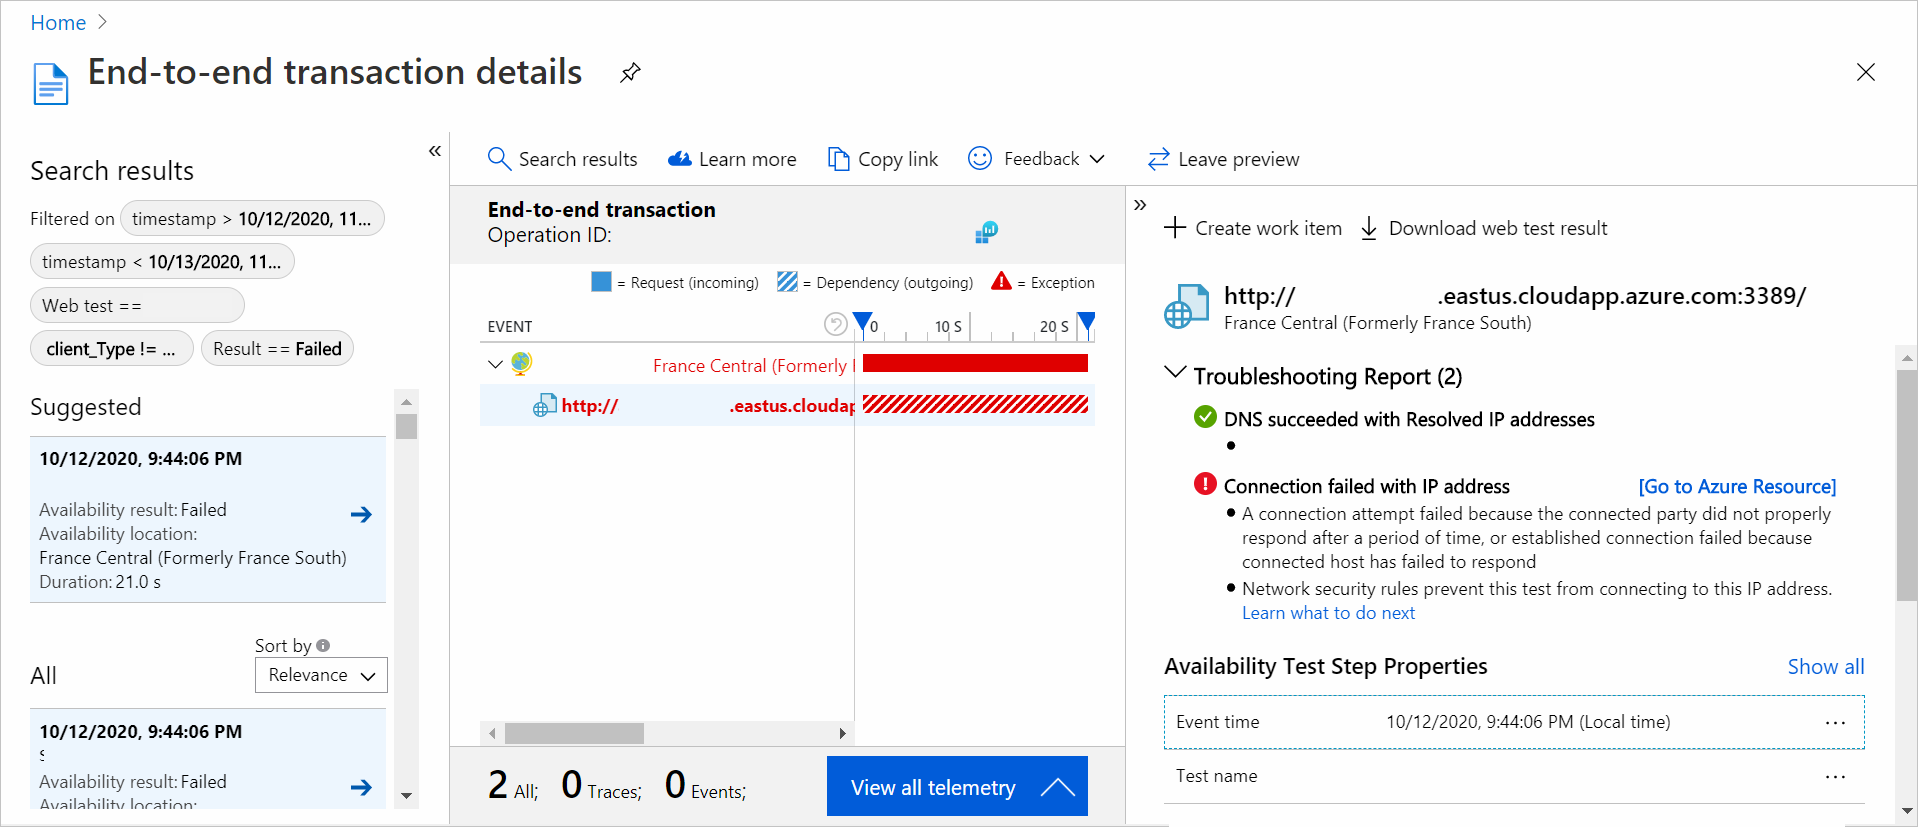
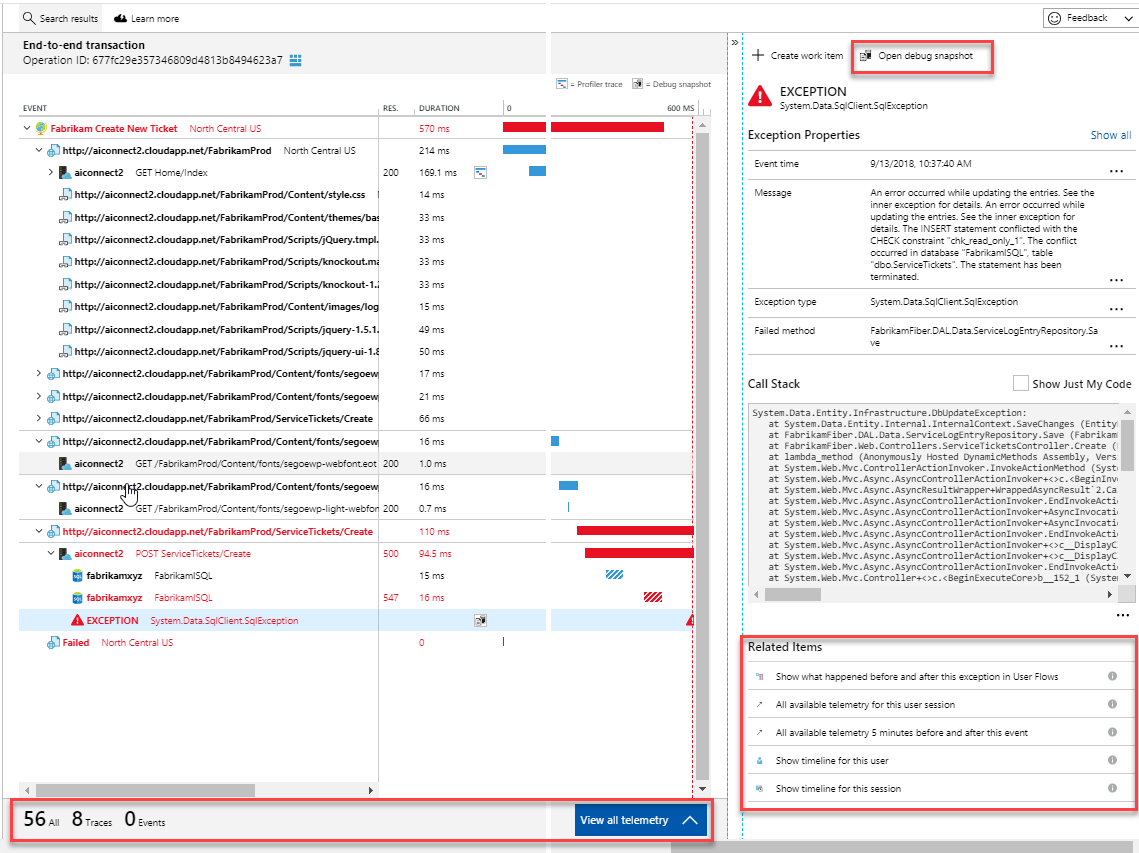
From an availability test result, you can see the transaction details across all components. Here you can:
- Review the troubleshooting report to determine what might have caused your test to fail but your application is still available.
- Inspect the response received from your server.
- Diagnose failure with correlated server-side telemetry collected while processing the failed availability test.
- Log an issue or work item in Git or Azure Boards to track the problem. The bug will contain a link to this event.
- Open the web test result in Visual Studio.
To learn more about the end-to-end transaction diagnostics experience, see the transaction diagnostics documentation.
Select the exception row to see the details of the server-side exception that caused the synthetic availability test to fail. You can also get the debug snapshot for richer code-level diagnostics.
In addition to the raw results, you can also view two key availability metrics in metrics explorer:
- Availability: Percentage of the tests that were successful across all test executions.
- Test Duration: Average test duration across all test executions.
Query in Log Analytics
You can use Log Analytics to view your availability results, dependencies, and more. To learn more about Log Analytics, see Log query overview.


Migrate availability tests
In this article, we guide you through the process of migrating from classic URL ping tests to the modern and efficient standard tests.
We simplify this process by providing clear step-by-step instructions to ensure a seamless transition and equip your applications with the most up-to-date monitoring capabilities.
Migrate classic URL ping tests to standard tests
The following steps walk you through the process of creating standard tests that replicate the functionality of your URL ping tests. It allows you to more easily start using the advanced features of standard tests using your previously created URL ping tests.
Important
A cost is associated with running standard tests. Once you create a standard test, you will be charged for test executions. Refer to Azure Monitor pricing before starting this process.
Prerequisites
- Any URL ping test within Application Insights
- Azure PowerShell access
Get started
Connect to your subscription with Azure PowerShell (Connect-AzAccount + Set-AzContext).
List all URL ping tests in the current subscription:
Get-AzApplicationInsightsWebTest | `
Where-Object { $_.WebTestKind -eq "ping" } | `
Format-Table -Property ResourceGroupName,Name,WebTestKind,Enabled;
Find the URL Ping Test you want to migrate and record its resource group and name.
The following commands create a standard test with the same logic as the URL ping test.
Note
The following commands work for both HTTP and HTTPS endpoints, which are used in your URL ping Tests.
$resourceGroup = "pingTestResourceGroup";
$appInsightsComponent = "componentName";
$pingTestName = "pingTestName";
$newStandardTestName = "newStandardTestName";

$componentId = (Get-AzApplicationInsights -ResourceGroupName $resourceGroup -Name $appInsightsComponent).Id;
$pingTest = Get-AzApplicationInsightsWebTest -ResourceGroupName $resourceGroup -Name $pingTestName;
$pingTestRequest = ([xml]$pingTest.ConfigurationWebTest).WebTest.Items.Request;
$pingTestValidationRule = ([xml]$pingTest.ConfigurationWebTest).WebTest.ValidationRules.ValidationRule;

$dynamicParameters = @{};

if ($pingTestRequest.IgnoreHttpStatusCode -eq [bool]::FalseString) {
$dynamicParameters["RuleExpectedHttpStatusCode"] = [convert]::ToInt32($pingTestRequest.ExpectedHttpStatusCode, 10);
}

if ($pingTestValidationRule -and $pingTestValidationRule.DisplayName -eq "Find Text" `
-and $pingTestValidationRule.RuleParameters.RuleParameter[0].Name -eq "FindText" `
-and $pingTestValidationRule.RuleParameters.RuleParameter[0].Value) {
$dynamicParameters["ContentMatch"] = $pingTestValidationRule.RuleParameters.RuleParameter[0].Value;
$dynamicParameters["ContentPassIfTextFound"] = $true;
}

New-AzApplicationInsightsWebTest @dynamicParameters -ResourceGroupName $resourceGroup -Name $newStandardTestName `
-Location $pingTest.Location -Kind 'standard' -Tag @{ "hidden-link:$componentId" = "Resource" } -TestName $newStandardTestName `
-RequestUrl $pingTestRequest.Url -RequestHttpVerb "GET" -GeoLocation $pingTest.PropertiesLocations -Frequency $pingTest.Frequency `
-Timeout $pingTest.Timeout -RetryEnabled:$pingTest.RetryEnabled -Enabled:$pingTest.Enabled `
-RequestParseDependent:($pingTestRequest.ParseDependentRequests -eq [bool]::TrueString);
The new standard test doesn't have alert rules by default, so it doesn't create noisy alerts. No changes are made to your URL ping test so you can continue to rely on it for alerts.
Once you have validated the functionality of the new standard test, update your alert rules that reference the URL ping test to reference the standard test instead. Then you disable or delete the URL ping test.
To delete a URL ping test with Azure PowerShell, you can use this command:
Remove-AzApplicationInsightsWebTest -ResourceGroupName $resourceGroup -Name $pingTestName;
Testing behind a firewall
To ensure endpoint availability behind firewalls, enable public availability tests or run availability tests in disconnected or no ingress scenarios.
Public availability test enablement
Ensure your internal website has a public Domain Name System (DNS) record. Availability tests fail if DNS can't be resolved. For more information, see Create a custom domain name for internal application.
Warning
The IP addresses used by the availability tests service are shared and can expose your firewall-protected service endpoints to other tests. IP address filtering alone doesn't secure your service's traffic, so it's recommended to add extra custom headers to verify the origin of web request. For more information, see Virtual network service tags.
Authenticate traffic
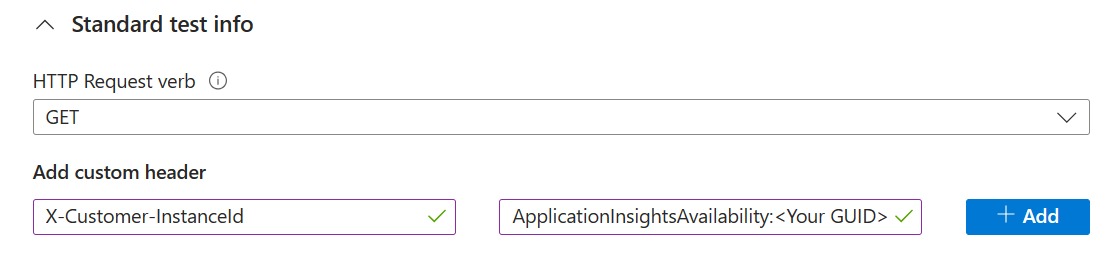
Set custom headers in standard availability tests to validate traffic.
Generate a token or GUID to identify traffic from your availability tests.
Add the custom header "X-Customer-InstanceId" with the value
ApplicationInsightsAvailability:<GUID generated in step 1>under the "Standard test info" section when creating or updating your availability tests.Ensure your service checks if incoming traffic includes the header and value defined in the previous steps.
Alternatively, set the token as a query parameter. For example, https://yourtestendpoint/?x-customer-instanceid=applicationinsightsavailability:<your guid>.
Configure your firewall to permit incoming requests from availability tests
Note
This example is specific to network security group service tag usage. Many Azure services accept service tags, each requiring different configuration steps.
To simplify enabling Azure services without authorizing individual IPs or maintaining an up-to-date IP list, use Service tags. Apply these tags across Azure Firewall and network security groups, allowing the availability test service access to your endpoints. The service tag
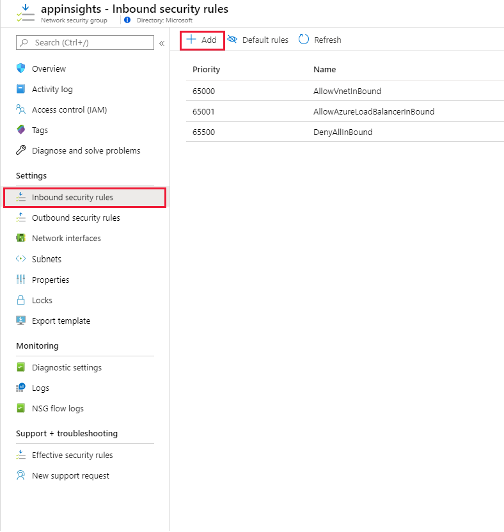
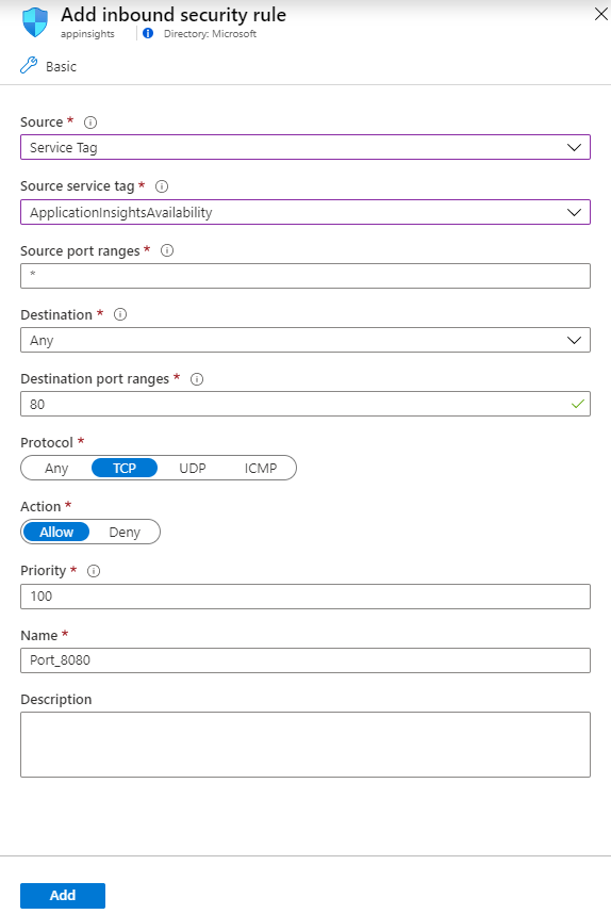
ApplicationInsightsAvailabilityapplies to all availability tests.If you're using Azure network security groups, go to your network security group resource and under Settings, select inbound security rules. Then select Add.
Next, select Service Tag as the source and select ApplicationInsightsAvailability as the source service tag. Use open ports 80 (http) and 443 (https) for incoming traffic from the service tag.
To manage access when your endpoints are outside Azure or when service tags aren't an option, allowlist the IP addresses of our web test agents. You can query IP ranges using PowerShell, Azure CLI, or a REST call with the Service Tag API. For a comprehensive list of current service tags and their IP details, download the JSON file.
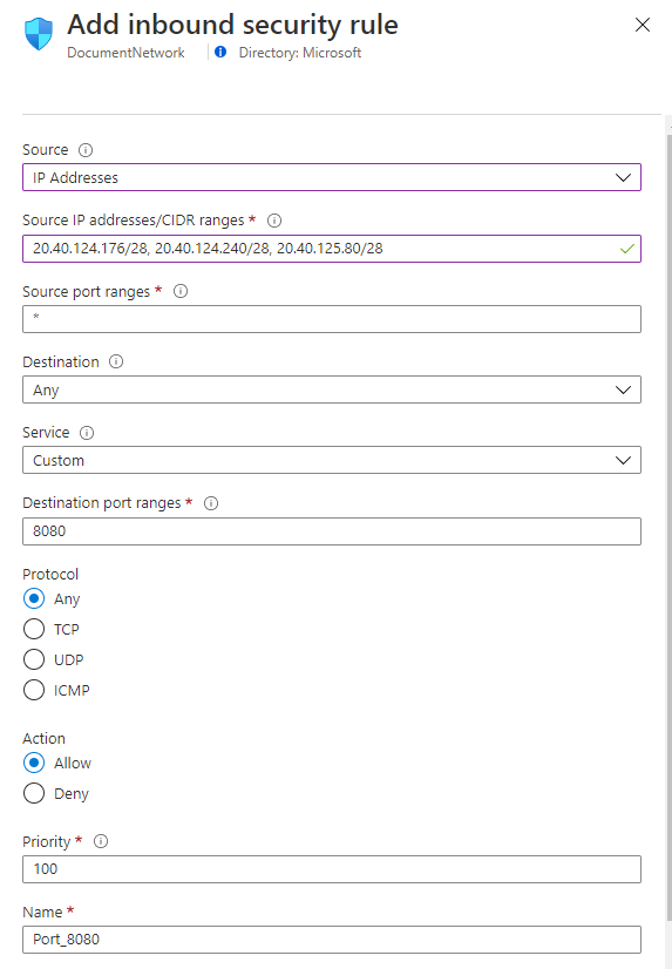
In your network security group resource, under Settings, select inbound security rules. Then select Add.
Next, select IP Addresses as your source. Then add your IP addresses in a comma-delimited list in source IP address/CIRD ranges.
Disconnected or no ingress scenarios
Connect your Application Insights resource to your internal service endpoint using Azure Private Link.
Write custom code to periodically test your internal server or endpoints. Send the results to Application Insights using the TrackAvailability() API in the core SDK package.
Supported TLS configurations
To provide best-in-class encryption, all availability tests use Transport Layer Security (TLS) 1.2 and 1.3 as the encryption mechanisms of choice. In addition, the following Cipher suites and Elliptical curves are also supported within each version.
Note
TLS 1.3 is currently only available in the availability test regions NorthCentralUS, CentralUS, EastUS, SouthCentralUS, and WestUS.
TLS 1.2
Cipher suites
- TLS_ECDHE_ECDSA_WITH_AES_256_GCM_SHA384
- TLS_ECDHE_ECDSA_WITH_AES_128_GCM_SHA256
- TLS_ECDHE_RSA_WITH_AES_256_GCM_SHA384
- TLS_ECDHE_RSA_WITH_AES_128_GCM_SHA256
- TLS_ECDHE_ECDSA_WITH_AES_256_CBC_SHA384
- TLS_ECDHE_ECDSA_WITH_AES_128_CBC_SHA256
- TLS_ECDHE_RSA_WITH_AES_256_CBC_SHA384
- TLS_ECDHE_RSA_WITH_AES_128_CBC_SHA256
Elliptical curves
- NistP384
- NistP256
TLS 1.3
Cipher suites
- TLS_AES_256_GCM_SHA384
- TLS_AES_128_GCM_SHA256
Elliptical curves:
- NistP384
- NistP256
Deprecating TLS configuration
Warning
On 31 October 2024, in alignment with the Azure wide legacy TLS deprecation, TLS 1.0/1.1 protocol versions and the below listed TLS 1.2/1.3 legacy Cipher suites and Elliptical curves will be retired for Application Insights availability tests.
TLS 1.0 and TLS 1.1
Protocol versions will no longer be supported.
TLS 1.2
Cipher suites
- TLS_ECDHE_ECDSA_WITH_AES_256_CBC_SHA
- TLS_ECDHE_ECDSA_WITH_AES_128_CBC_SHA
- TLS_ECDHE_RSA_WITH_AES_256_CBC_SHA
- TLS_ECDHE_RSA_WITH_AES_128_CBC_SHA
- TLS_RSA_WITH_AES_256_GCM_SHA384
- TLS_RSA_WITH_AES_128_GCM_SHA256
- TLS_RSA_WITH_AES_256_CBC_SHA256
- TLS_RSA_WITH_AES_128_CBC_SHA256
- TLS_RSA_WITH_AES_256_CBC_SHA
- TLS_RSA_WITH_AES_128_CBC_SHA
Elliptical curves:
- curve25519
TLS 1.3
Elliptical curves
- curve25519
Troubleshooting
Warning
We have recently enabled TLS 1.3 in availability tests. If you are seeing new error messages as a result, please ensure that clients running on Windows Server 2022 with TLS 1.3 enabled can connect to your endpoint. If you are unable to do this, you may consider temporarily disabling TLS 1.3 on your endpoint so that availability tests will fall back to older TLS versions.
For additional information, please check the troubleshooting article.
See the dedicated troubleshooting article.
Downtime, SLA, and outages workbook
This article introduces a simple way to calculate and report service-level agreement (SLA) for web tests through a single pane of glass across your Application Insights resources and Azure subscriptions. The downtime and outage report provides powerful prebuilt queries and data visualizations to enhance your understanding of your customer's connectivity, typical application response time, and experienced downtime.
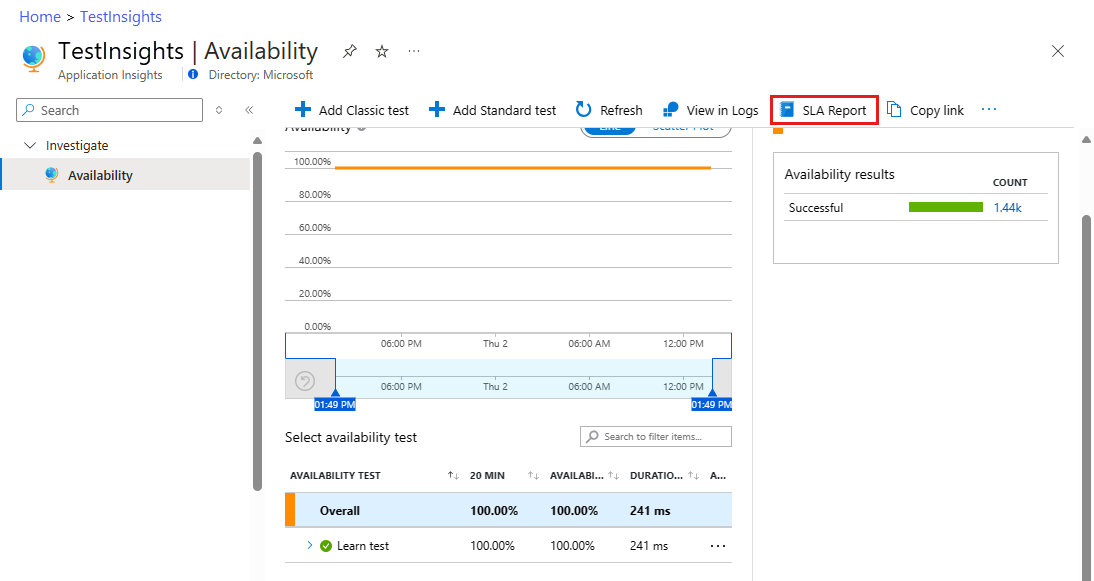
The SLA workbook template can be accessed from your Application Insights resource in two ways:
Open the Availability pane, then select SLA Report at the top of the screen.
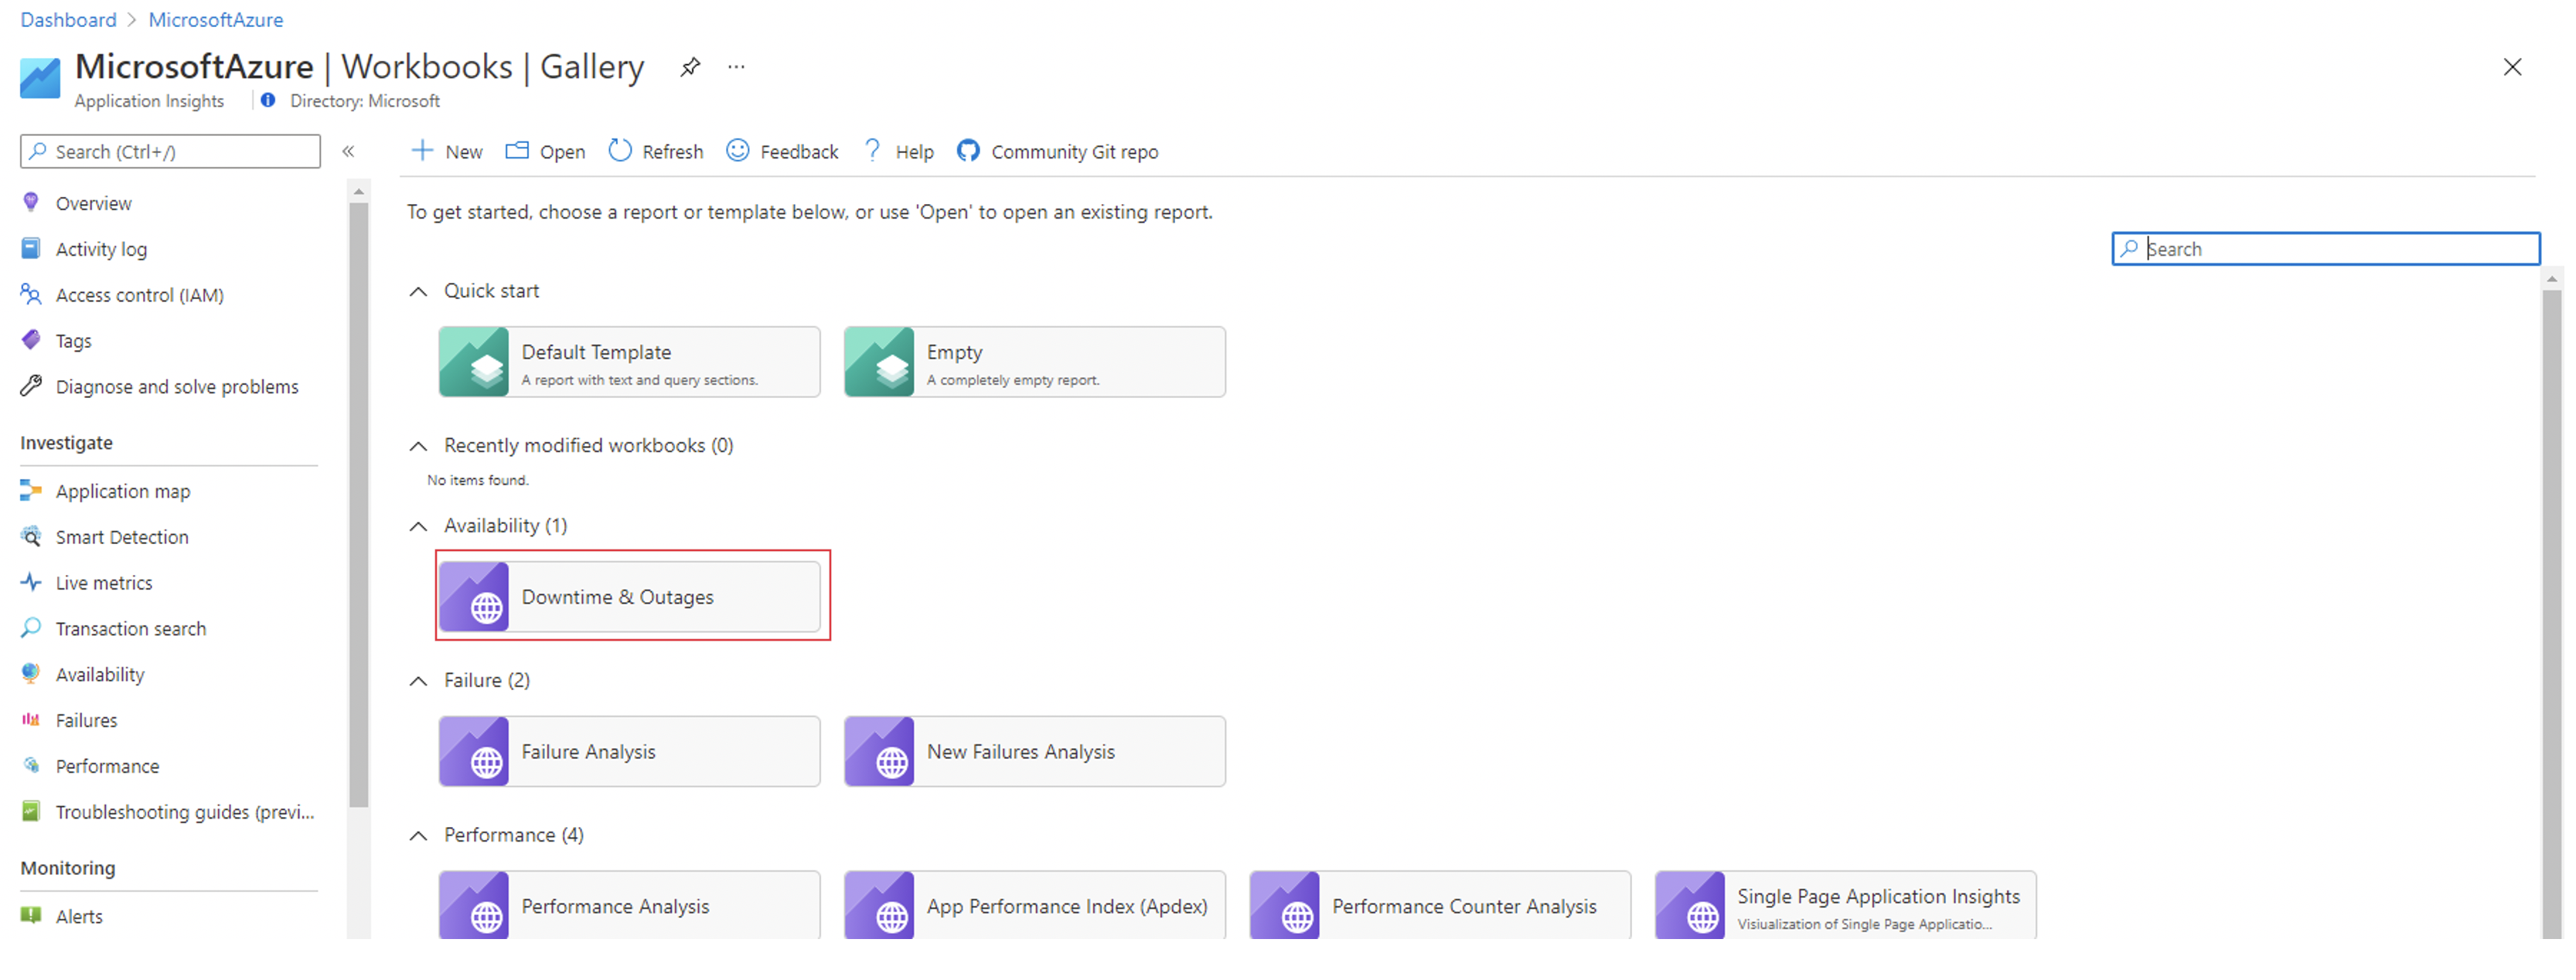
Open the Workbooks pane, then select Downtime & Outages.


Parameter flexibility
The parameters set in the workbook influence the rest of your report.

Subscriptions,App Insights Resources, andWeb Test: These parameters determine your high-level resource options. They're based on Log Analytics queries and are used in every report query.Failure ThresholdandOutage Window: You can use these parameters to determine your own criteria for a service outage. An example is the criteria for an Application Insights availability alert based on a failed location counter over a chosen period. The typical threshold is three locations over a five-minute window.Maintenance Period: You can use this parameter to select your typical maintenance frequency.Maintenance Windowis a datetime selector for an example maintenance period. All data that occurs during the identified period will be ignored in your results.Availability Target %: This parameter specifies your target objective and takes custom values.
Overview page
The overview page contains high-level information about your:
- Total SLA (excluding maintenance periods, if defined)
- End-to-end outage instances
- Application downtime
Outage instances are defined by when a test starts to fail until it's successful, based on your outage parameters. If a test starts failing at 8:00 AM and succeeds again at 10:00 AM, that entire period of data is considered the same outage.

You can also investigate the longest outage that occurred over your reporting period.
Some tests are linkable back to their Application Insights resource for further investigation. But that's only possible in the workspace-based Application Insights resource.
Downtime, outages, and failures
The Outages & Downtime tab has information on total outage instances and total downtime broken down by test.

The Failures by Location tab has a geo-map of failed testing locations to help identify potential problem connection areas.

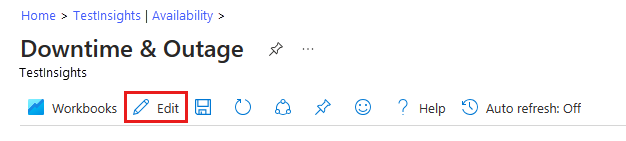
Edit the report
You can edit the report like any other Azure Monitor workbook.
You can customize the queries or visualizations based on your team's needs.

Log Analytics
The queries can all be run in Log Analytics and used in other reports or dashboards.

Remove the parameter restriction and reuse the core query.

Access and sharing
The report can be shared with your teams and leadership or pinned to a dashboard for further use. The user needs to have read permission/access to the Application Insights resource where the actual workbook is stored.

Frequently asked questions
This section provides answers to common questions.
General
Can I run availability tests on an intranet server?
Our web tests run on points of presence that are distributed around the globe. There are two solutions:
- Firewall door: Allow requests to your server from the long and changeable list of web test agents.
- Custom code: Write your own code to send periodic requests to your server from inside your intranet. You could run Visual Studio web tests for this purpose. The tester could send the results to Application Insights by using the
TrackAvailability()API.
What is the user agent string for availability tests?
The user agent string is Mozilla/5.0 (compatible; MSIE 9.0; Windows NT 6.1; Trident/5.0; AppInsights)
TLS support
How does this deprecation impact my web test behavior?
Availability tests act as a distributed client in each of the supported web test locations. Every time a web test is executed the availability test service attempts to reach out to the remote endpoint defined in the web test configuration. A TLS Client Hello message is sent which contains all the currently supported TLS configuration. If the remote endpoint shares a common TLS configuration with the availability test client, then the TLS handshake succeeds. Otherwise, the web test fails with a TLS handshake failure.
How do I ensure my web test isn't impacted?
To avoid any impact, each remote endpoint (including dependent requests) your web test interacts with needs to support at least one combination of the same Protocol Version, Cipher Suite, and Elliptical Curve that availability test does. If the remote endpoint doesn't support the needed TLS configuration, it needs to be updated with support for some combination of the above-mentioned post-deprecation TLS configuration. These endpoints can be discovered through viewing the Transaction Details of your web test (ideally for a successful web test execution).
How do I validate what TLS configuration a remote endpoint supports?
There are several tools available to test what TLS configuration an endpoint supports. One way would be to follow the example detailed on this page. If your remote endpoint isn't available via the Public internet, you need to ensure you validate the TLS configuration supported on the remote endpoint from a machine that has access to call your endpoint.
Note
For steps to enable the needed TLS configuration on your web server, it is best to reach out to the team that owns the hosting platform your web server runs on if the process is not known.
After October 31, 2024, what will the web test behavior be for impacted tests?
There's no one exception type that all TLS handshake failures impacted by this deprecation would present themselves with. However, the most common exception your web test would start failing with would be The request was aborted: Couldn't create SSL/TLS secure channel. You should also be able to see any TLS related failures in the TLS Transport Troubleshooting Step for the web test result that is potentially impacted.
Can I view what TLS configuration is currently in use by my web test?
The TLS configuration negotiated during a web test execution can't be viewed. As long as the remote endpoint supports common TLS configuration with availability tests, no impact should be seen post-deprecation.
Which components does the deprecation affect in the availability test service?
The TLS deprecation detailed in this document should only affect the availability test web test execution behavior after October 31, 2024. For more information about interacting with the availability test service for CRUD operations, see Azure Resource Manager TLS Support. This resource provides more details on TLS support and deprecation timelines.
Where can I get TLS support?
For any general questions around the legacy TLS problem, see Solving TLS problems.
Next steps
Feedback
Coming soon: Throughout 2024 we will be phasing out GitHub Issues as the feedback mechanism for content and replacing it with a new feedback system. For more information see: https://aka.ms/ContentUserFeedback.
Submit and view feedback for