Note
Access to this page requires authorization. You can try signing in or changing directories.
Access to this page requires authorization. You can try changing directories.
This article describes how to enable Application Insights for an ASP.NET Core application deployed as an Azure Web App. This implementation uses an SDK-based approach. An autoinstrumentation approach is also available.
Application Insights can collect the following telemetry from your ASP.NET Core application:
- Requests
- Dependencies
- Exceptions
- Performance counters
- Heartbeats
- Logs
For a sample application, we'll use an ASP.NET Core MVC application that targets net6.0. However, you can apply these instructions to all ASP.NET Core applications. If you're using the Worker Service, use the instructions from here.
Note
An OpenTelemetry-based .NET offering is available. Learn more.
Note
On March 31, 2025, support for instrumentation key ingestion will end. Instrumentation key ingestion will continue to work, but we'll no longer provide updates or support for the feature. Transition to connection strings to take advantage of new capabilities.
Supported scenarios
The Application Insights SDK for ASP.NET Core can monitor your applications no matter where or how they run. If your application is running and has network connectivity to Azure, Application Insights can collect telemetry from it. Application Insights monitoring is supported everywhere .NET Core is supported. The following scenarios are supported:
- Operating system: Windows, Linux, or Mac
- Hosting method: In process or out of process
- Deployment method: Framework dependent or self-contained
- Web server: Internet Information Server (IIS) or Kestrel
- Hosting platform: The Web Apps feature of Azure App Service, Azure VM, Docker, Azure Kubernetes Service (AKS), and so on
- .NET Core version: All officially supported .NET Core versions that aren't in preview
- IDE: Visual Studio, Visual Studio Code, or command line
Prerequisites
To complete this tutorial, you need:
- Visual Studio 2022
- The following Visual Studio workloads:
- ASP.NET and web development
- Data storage and processing
- Azure development
- .NET 6.0
- Azure subscription and user account (with the ability to create and delete resources)
Deploy Azure resources
Please follow the guidance to deploy the sample application from its GitHub repository..
In order to provide globally unique names to resources, a six-character suffix is assigned to some resources. Please make note of this suffix for use later on in this article.

Create an Application Insights resource
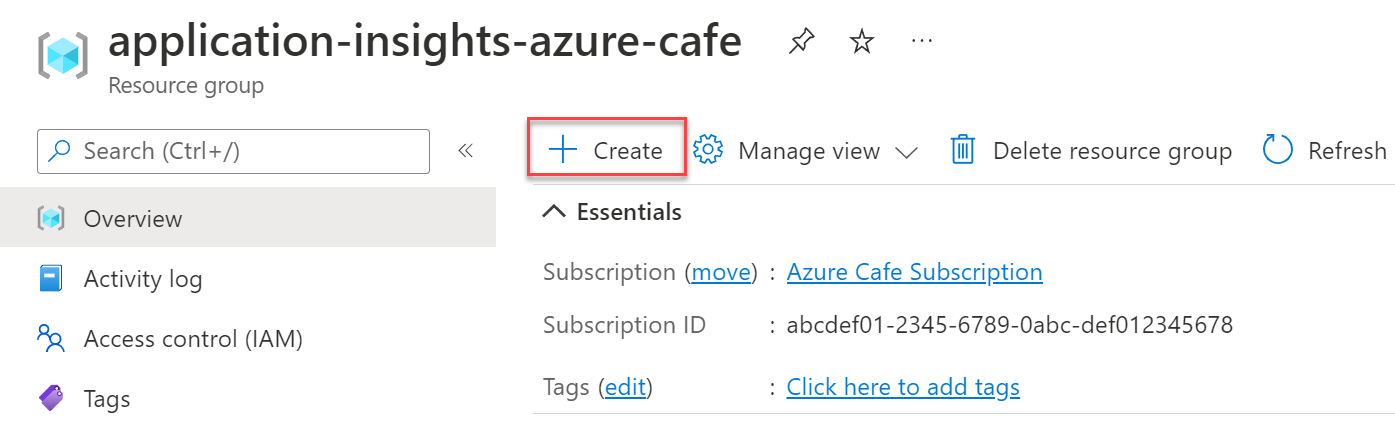
In the Azure portal, select the application-insights-azure-cafe resource group.
From the top toolbar menu, select + Create.
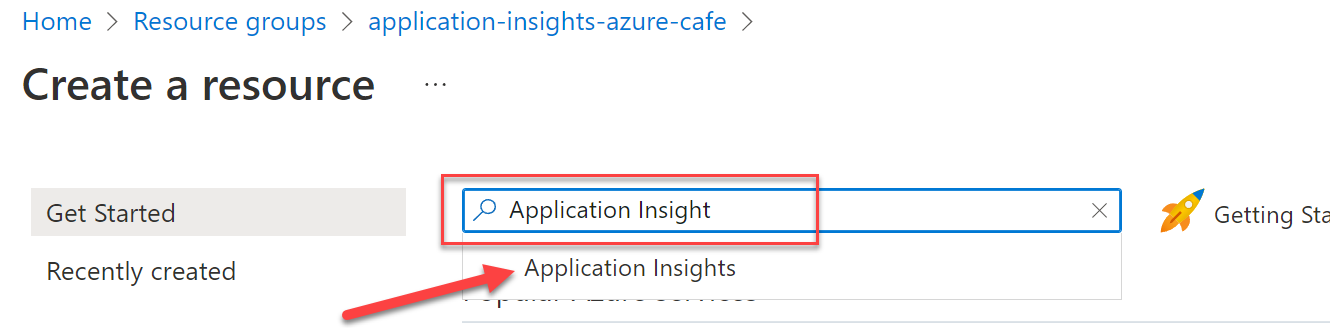
On the Create a resource screen, search for and select Application Insights in the marketplace search textbox.
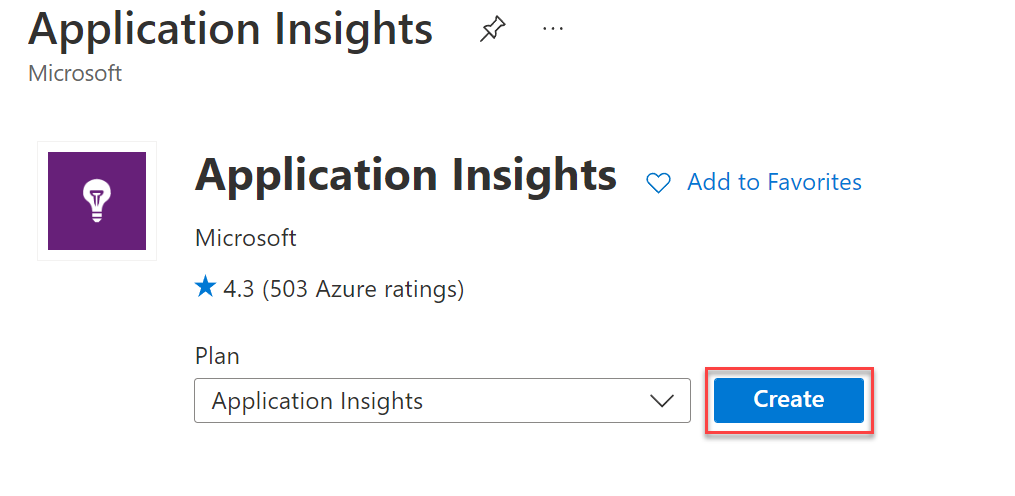
On the Application Insights resource overview screen, select Create.
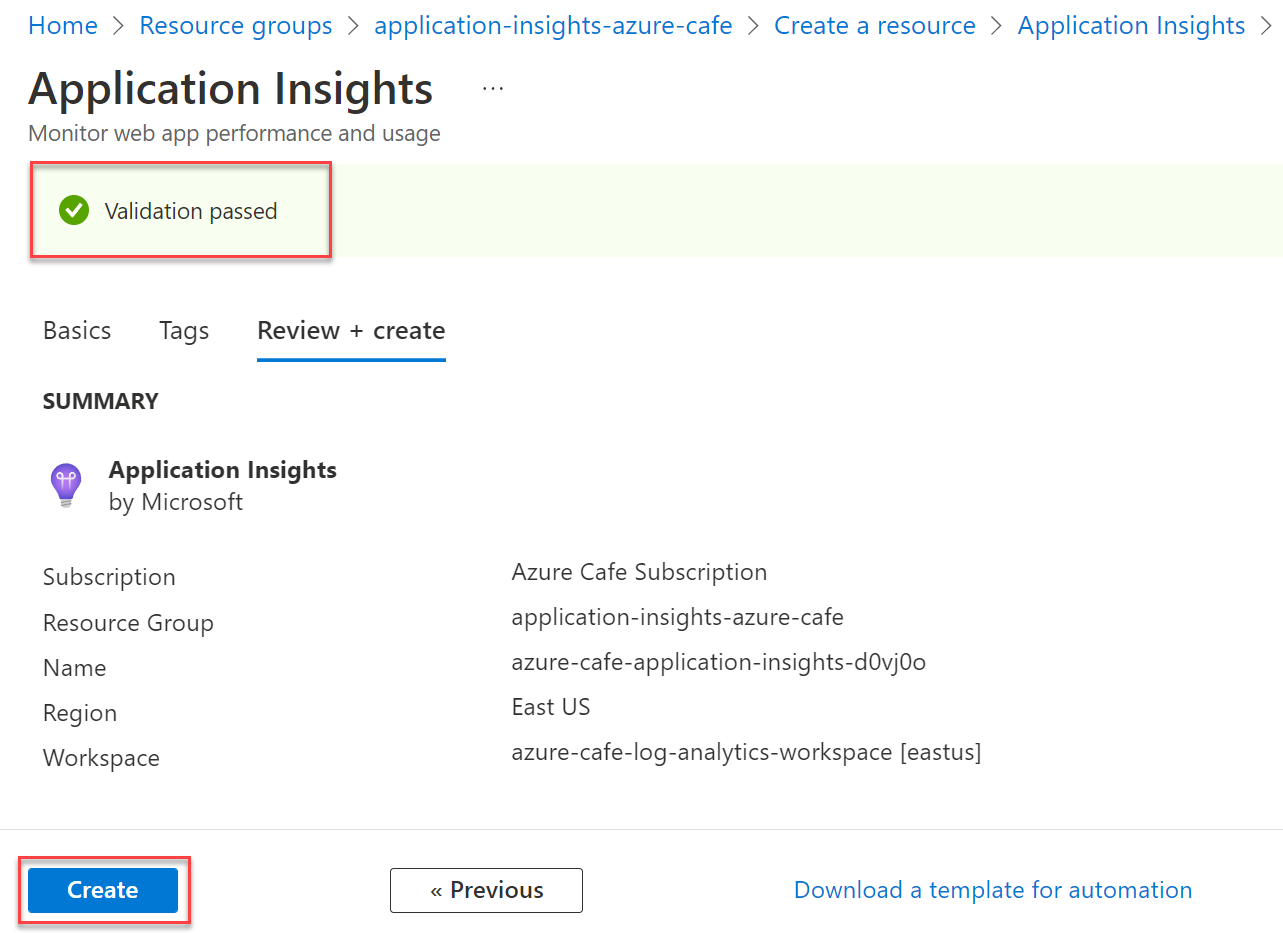
On the Application Insights screen, Basics tab, complete the form by using the following table, then select the Review + create button. Fields not specified in the table below may retain their default values.
Field Value Name Enter azure-cafe-application-insights-{SUFFIX}, replacing {SUFFIX} with the appropriate suffix value recorded earlier.Region Select the same region chosen when deploying the article resources. Log Analytics Workspace Select azure-cafe-log-analytics-workspace. Alternatively, you can create a new log analytics workspace. 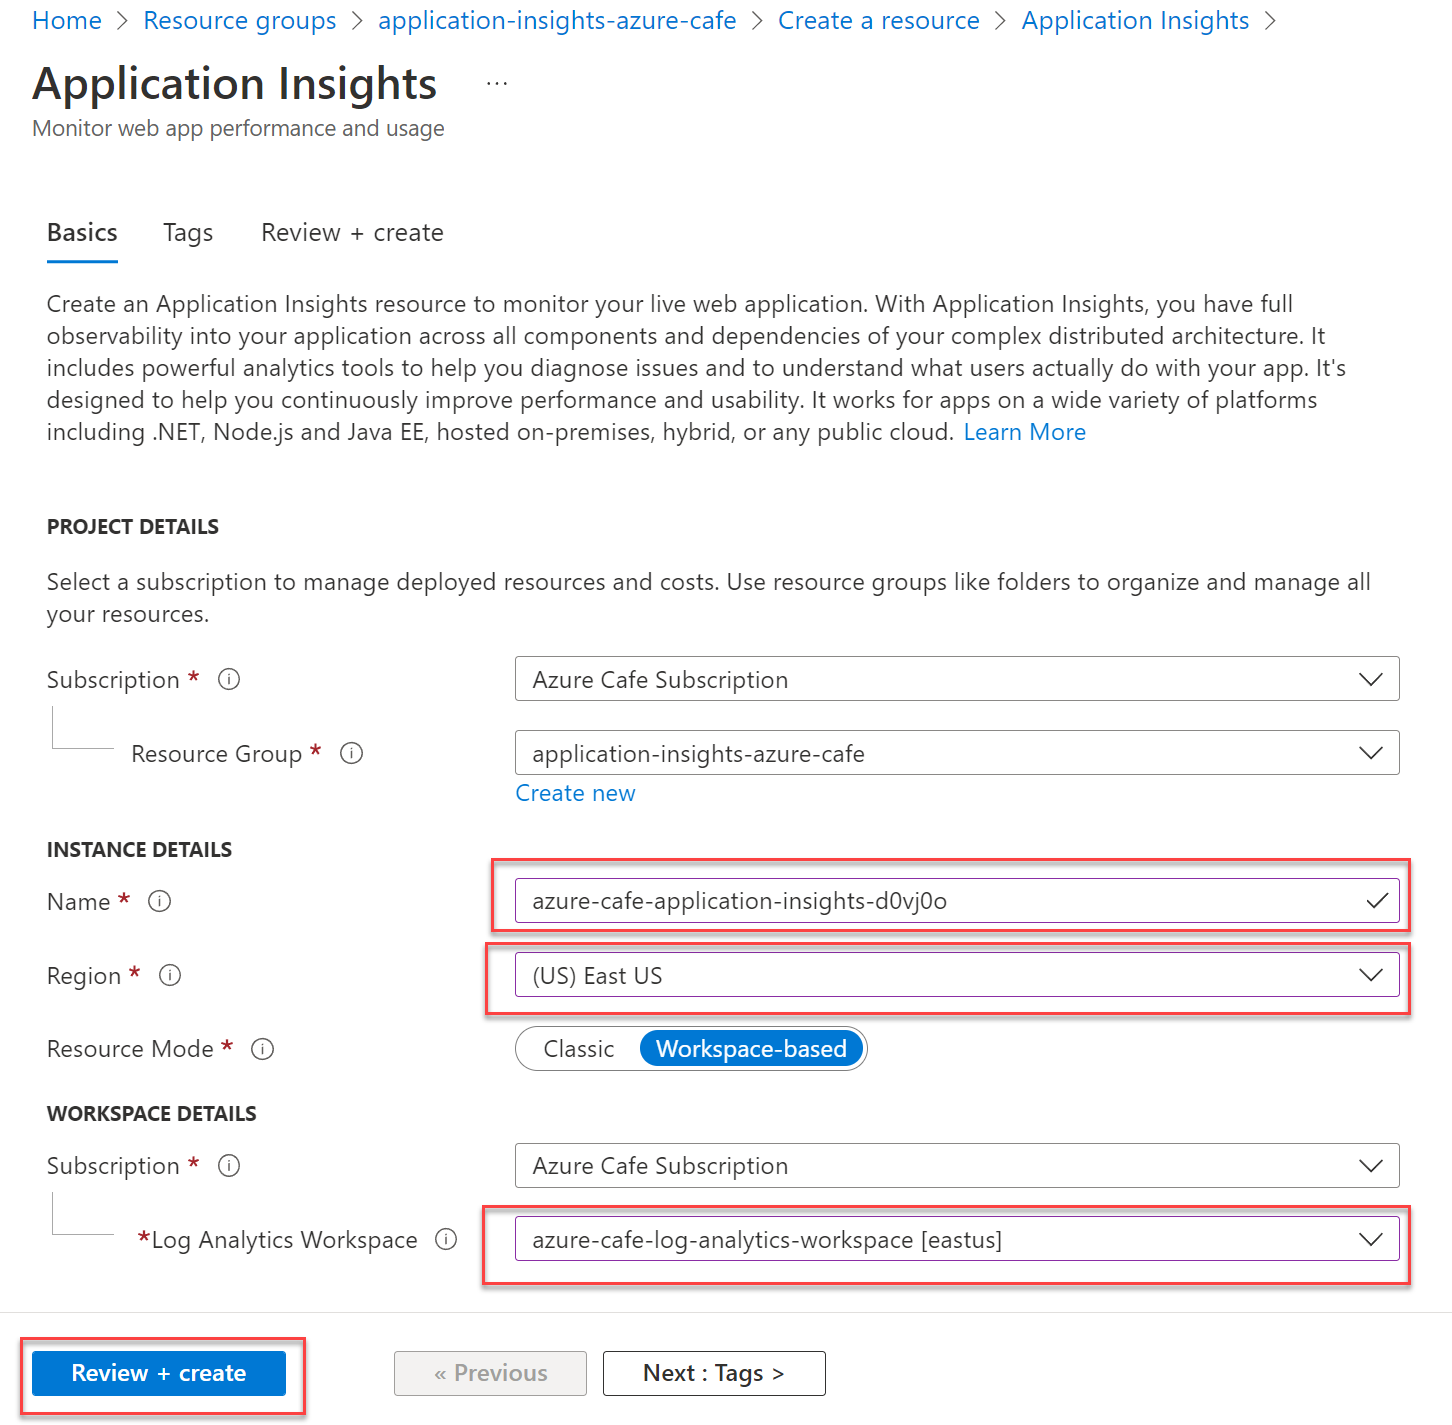
Once validation has passed, select Create to deploy the resource.
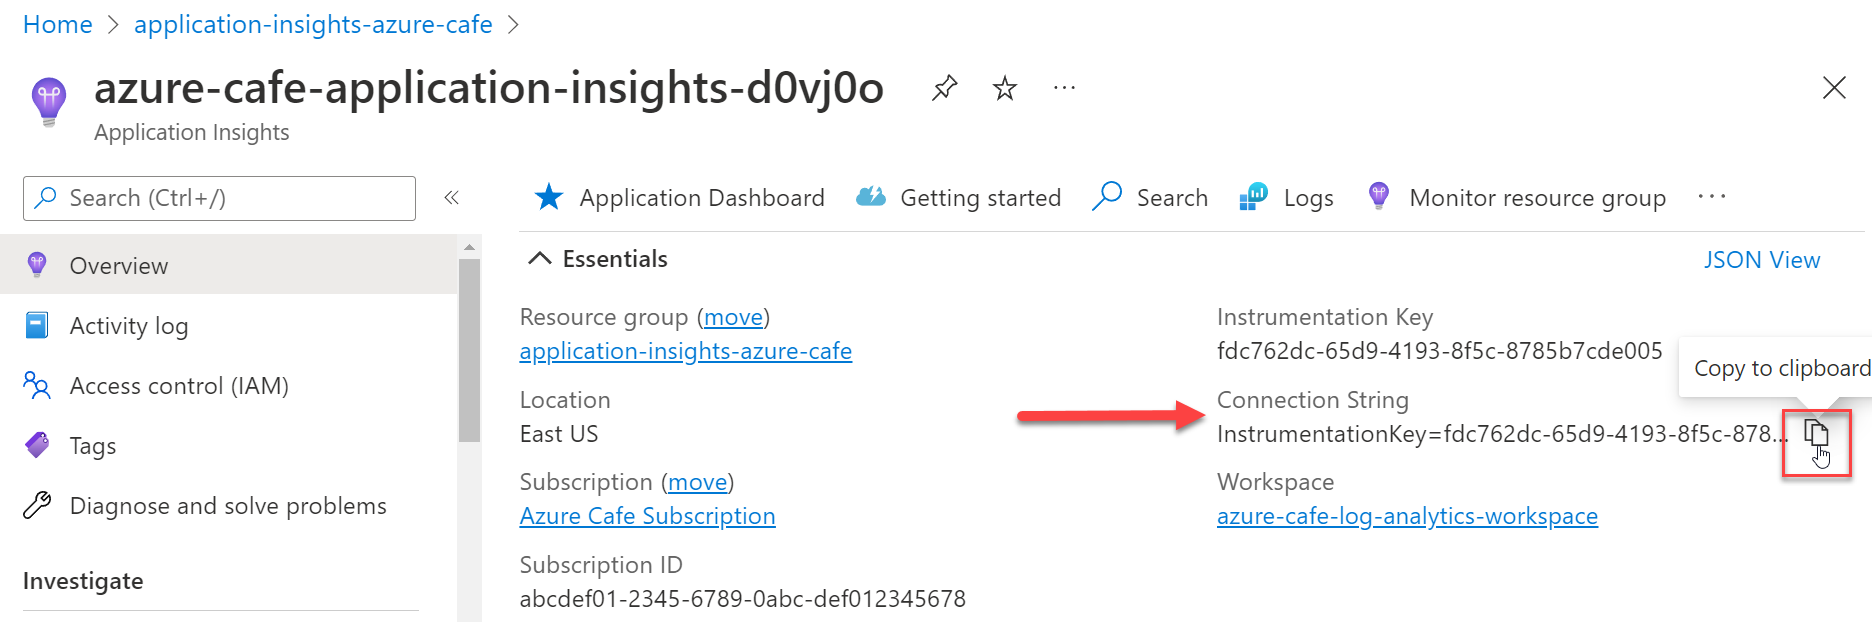
Once the resource is deployed, return to the
application-insights-azure-caferesource group, and select the Application Insights resource you deployed.
On the Overview screen of the Application Insights resource, select the Copy to clipboard button to copy the connection string value. You will use the connection string value in the next section of this article.


Configure the Application Insights connection string application setting in the web App Service
Return to the
application-insights-azure-caferesource group and open the azure-cafe-web-{SUFFIX} App Service resource.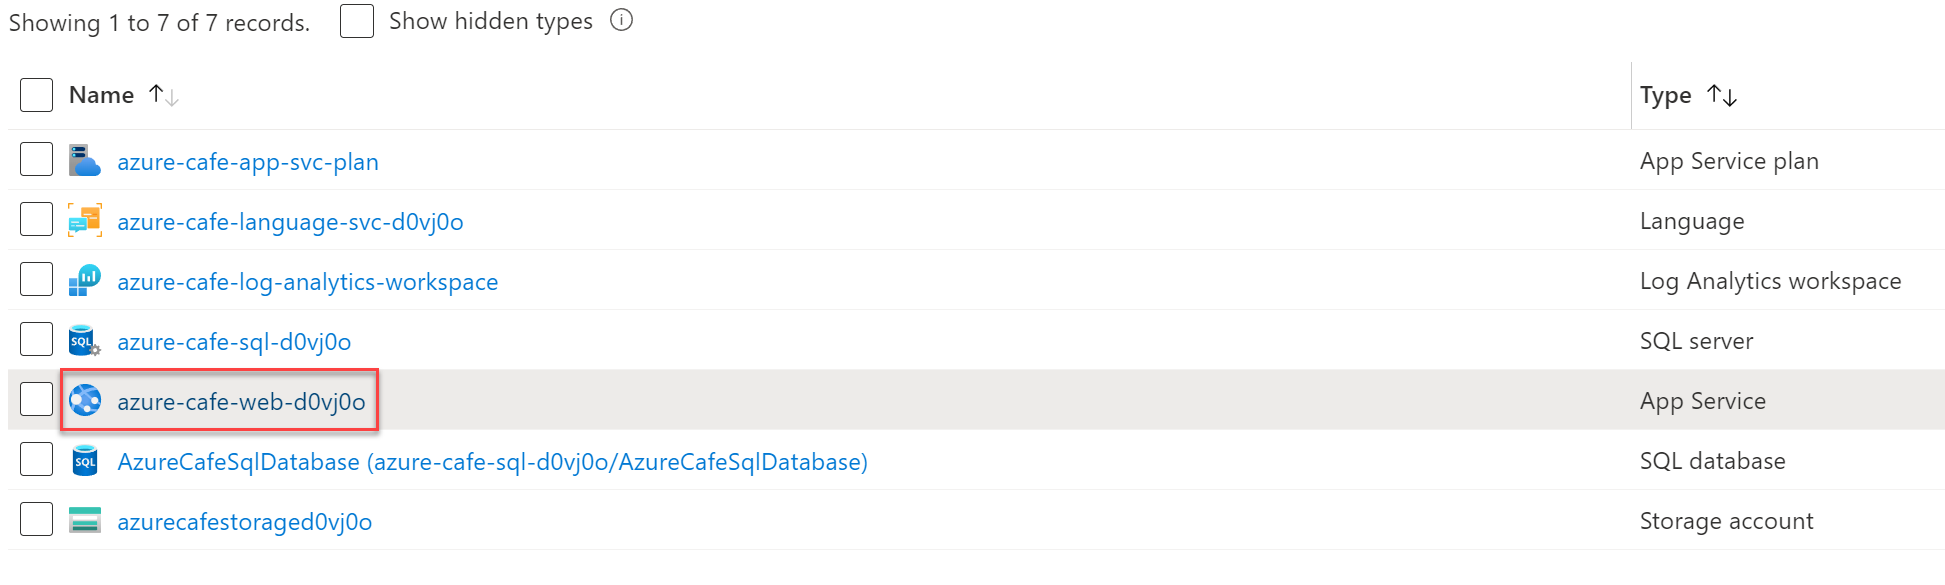
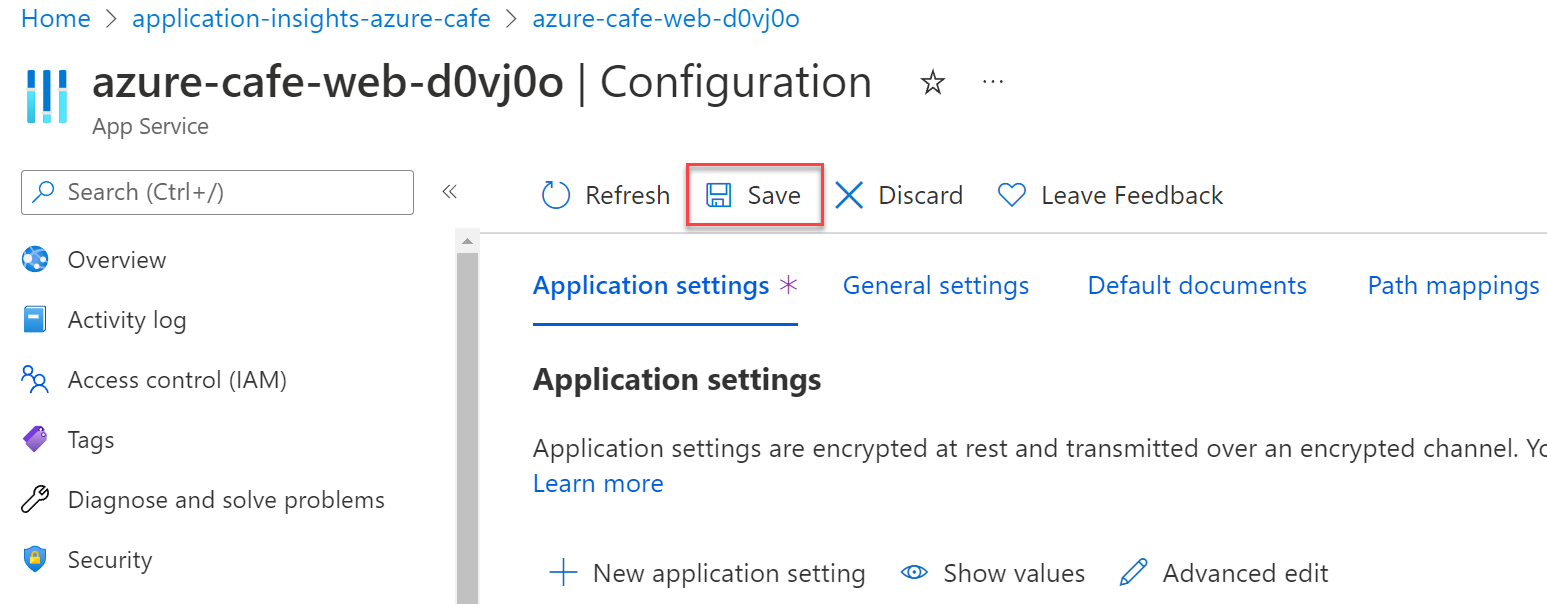
From the left menu, under the Settings section, select Configuration. Then, on the Application settings tab, select + New application setting beneath the Application settings header.
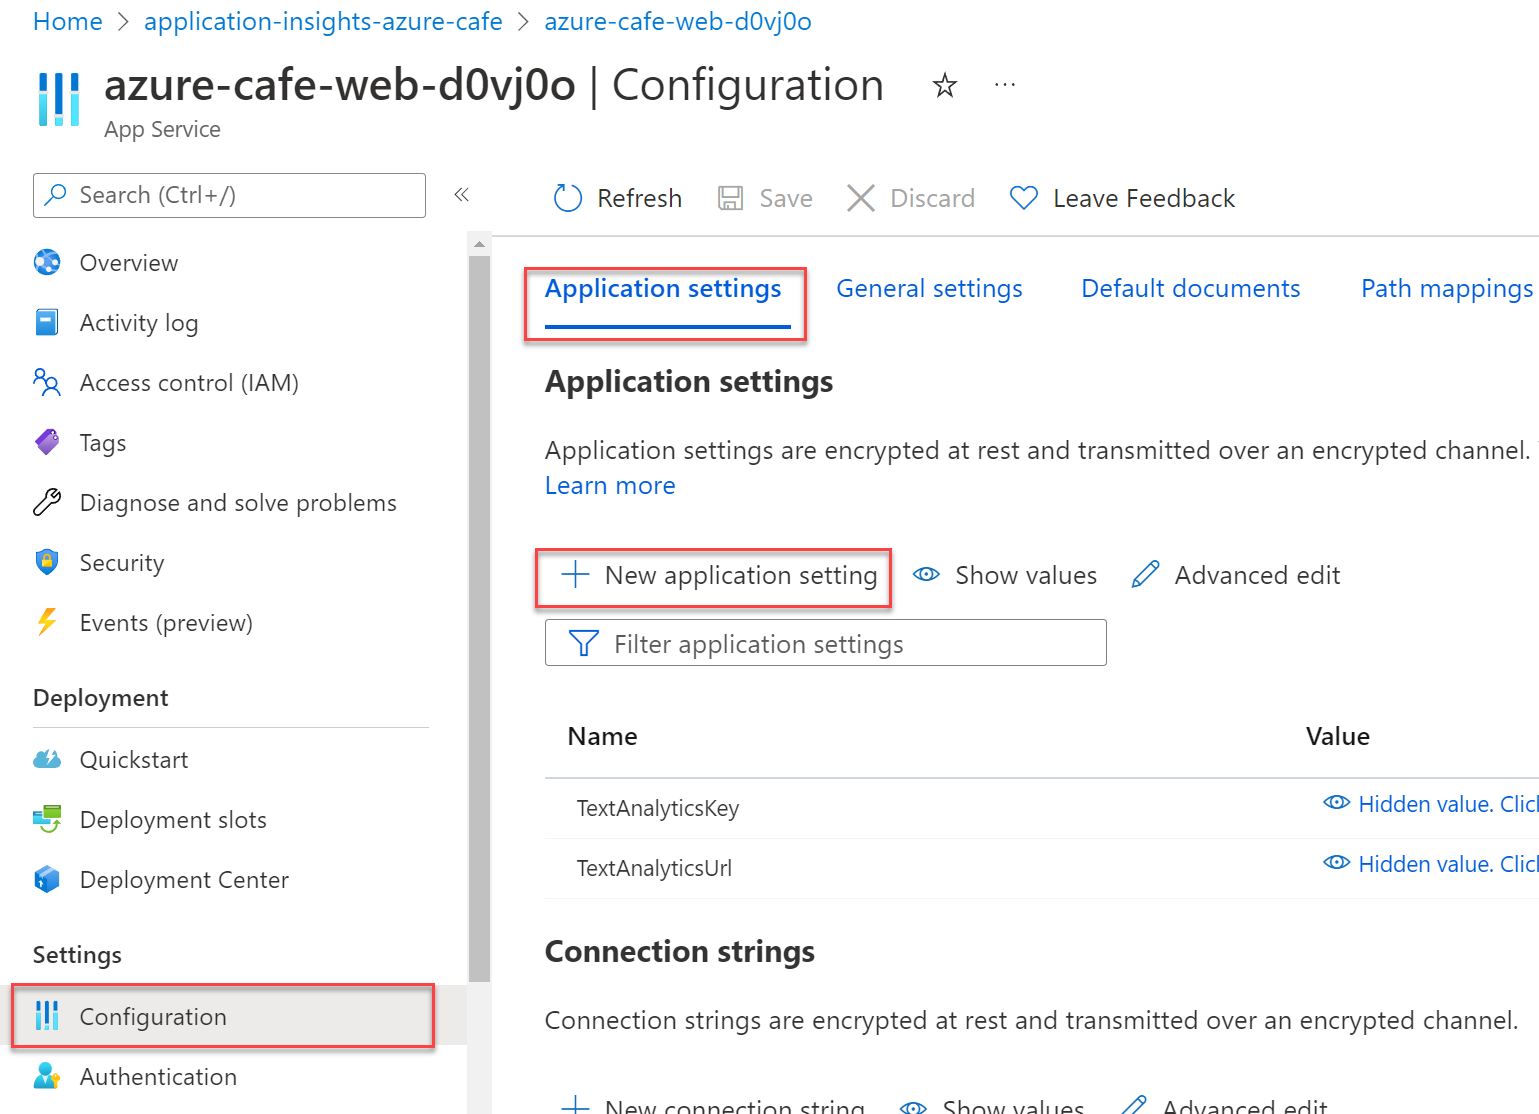
In the Add/Edit application setting pane, complete the form as follows and select OK.
Field Value Name APPLICATIONINSIGHTS_CONNECTION_STRING Value Paste the Application Insights connection string value you copied in the preceding section. 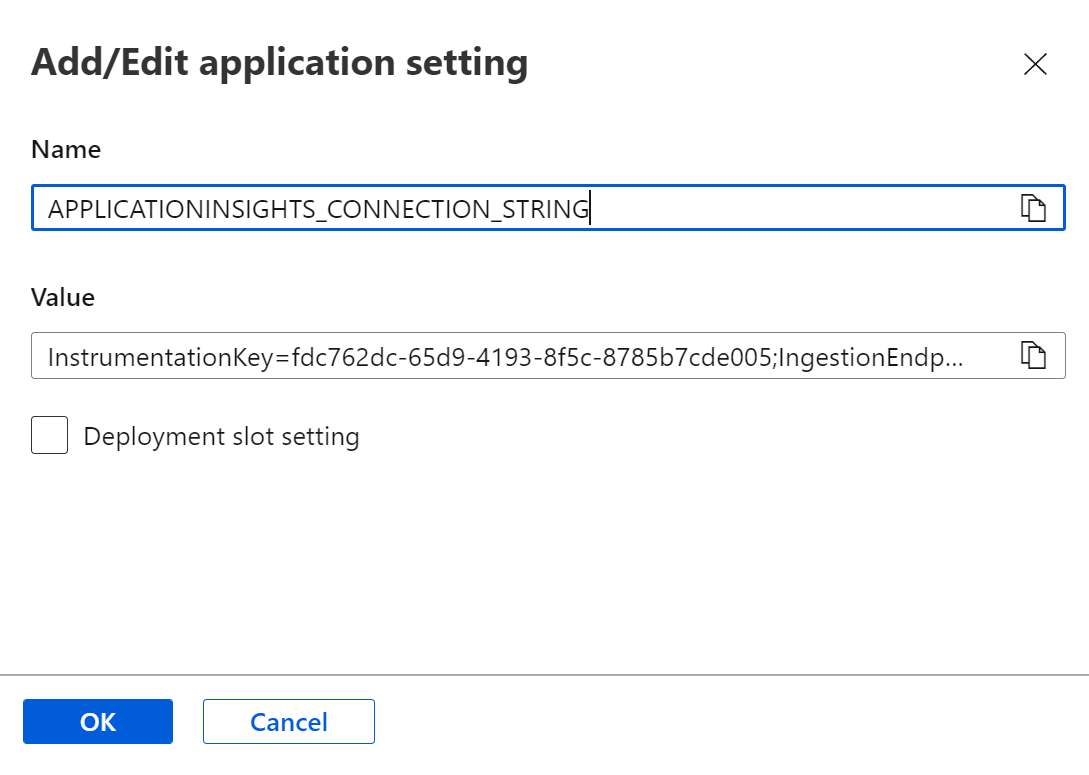
On the App Service Configuration screen, select the Save button from the toolbar menu. When prompted to save the changes, select Continue.


Install the Application Insights NuGet Package
We need to configure the ASP.NET Core MVC web application to send telemetry. This is accomplished using the Application Insights for ASP.NET Core web applications NuGet package.
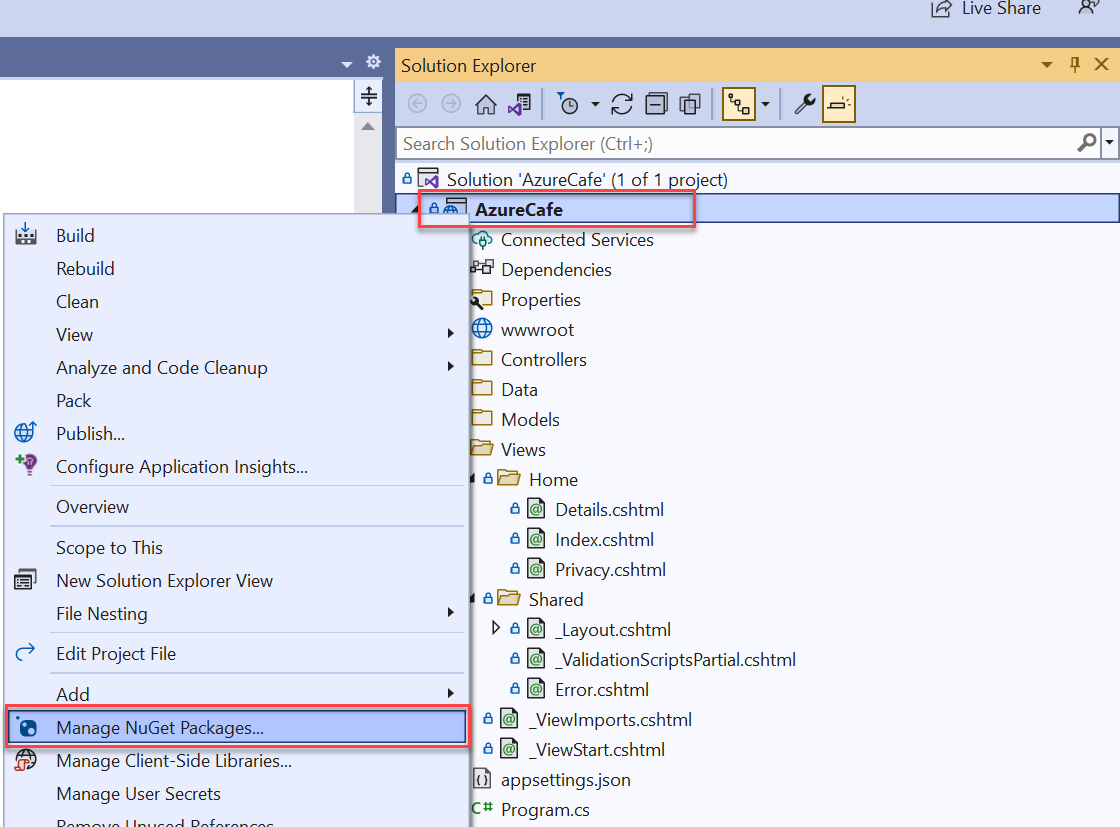
In Visual Studio, open
1 - Starter Application\src\AzureCafe.sln.In the Visual Studio Solution Explorer panel, right-click on the AzureCafe project file and select Manage NuGet Packages.
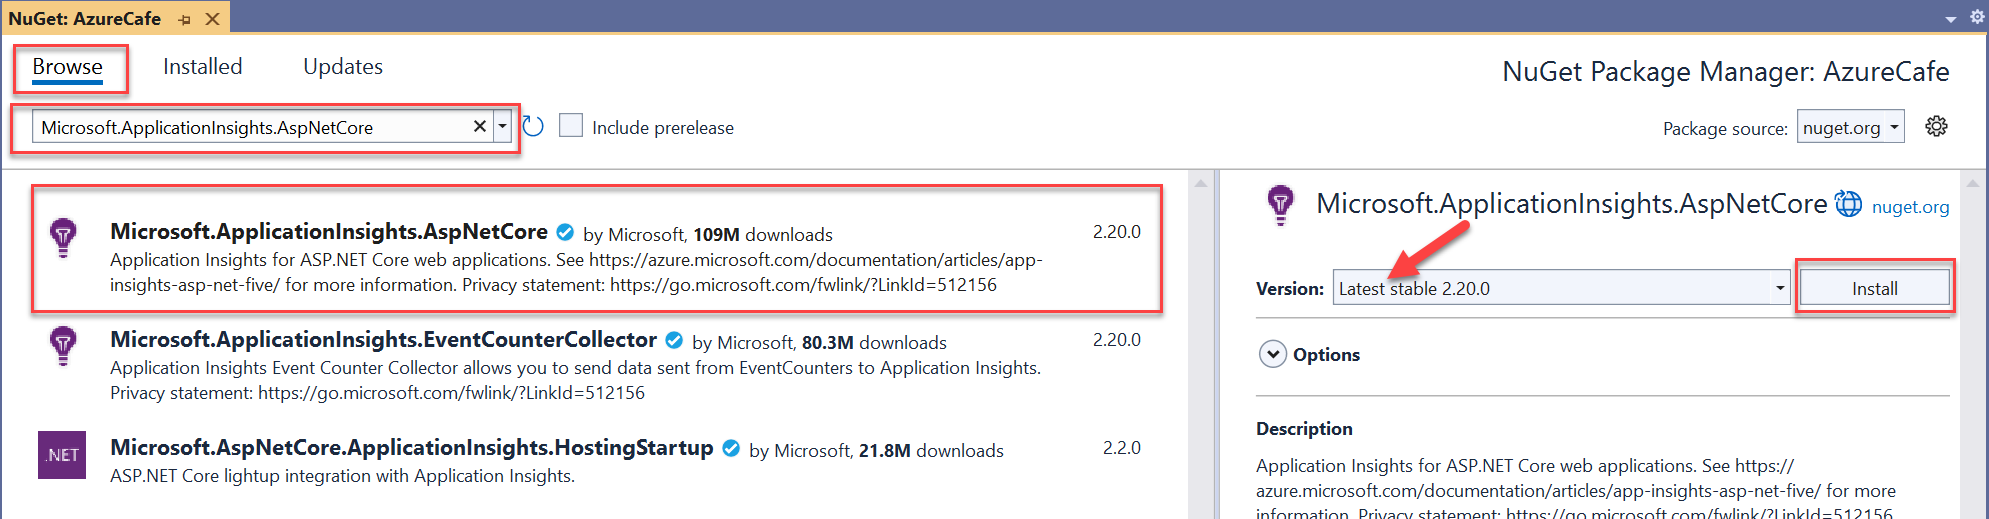
Select the Browse tab and then search for and select Microsoft.ApplicationInsights.AspNetCore. Select Install, and accept the license terms. It is recommended you use the latest stable version. For the full release notes for the SDK, see the open-source GitHub repo.
Keep Visual Studio open for the next section of the article.


Enable Application Insights server-side telemetry
The Application Insights for ASP.NET Core web applications NuGet package encapsulates features to enable sending server-side telemetry to the Application Insights resource in Azure.
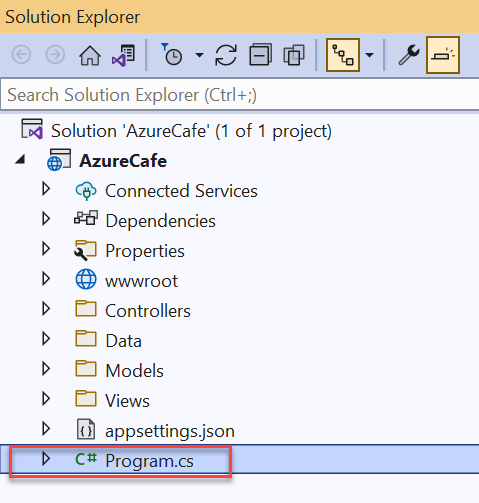
From the Visual Studio Solution Explorer, open the Program.cs file.
Insert the following code prior to the
builder.Services.AddControllersWithViews()statement. This code automatically reads the Application Insights connection string value from configuration. TheAddApplicationInsightsTelemetrymethod registers theApplicationInsightsLoggerProviderwith the built-in dependency injection container that will then be used to fulfill ILogger and ILogger<TCategoryName> implementation requests.builder.Services.AddApplicationInsightsTelemetry();
Tip
Learn more about the configuration options in ASP.NET Core.


Enable client-side telemetry for web applications
The preceding steps are enough to help you start collecting server-side telemetry. The sample application has client-side components. Follow the next steps to start collecting usage telemetry.
In Visual Studio Solution Explorer, open
\Views\_ViewImports.cshtml.Add the following code at the end of the existing file.
@inject Microsoft.ApplicationInsights.AspNetCore.JavaScriptSnippet JavaScriptSnippet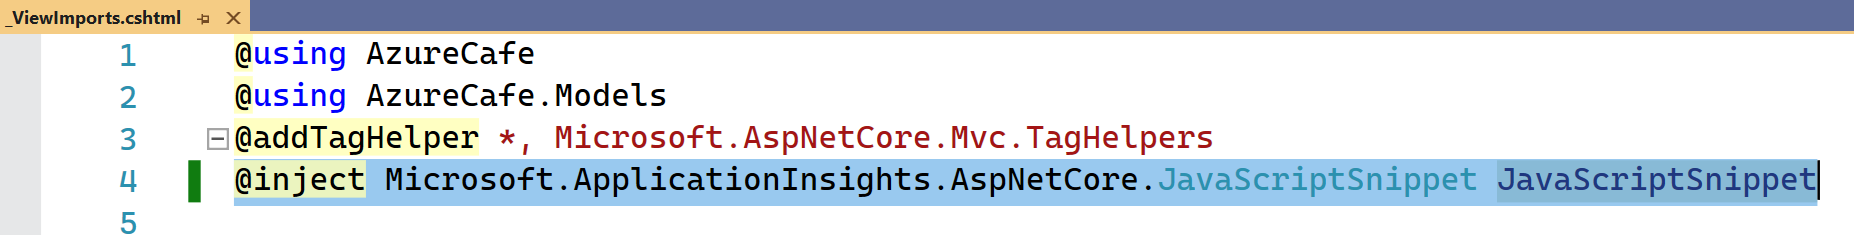
To properly enable client-side monitoring for your application, in Visual Studio Solution Explorer, open
\Views\Shared\_Layout.cshtmland insert the following code immediately before the closing<\head>tag. This JavaScript snippet must be inserted in the<head>section of each page of your application that you want to monitor.@Html.Raw(JavaScriptSnippet.FullScript)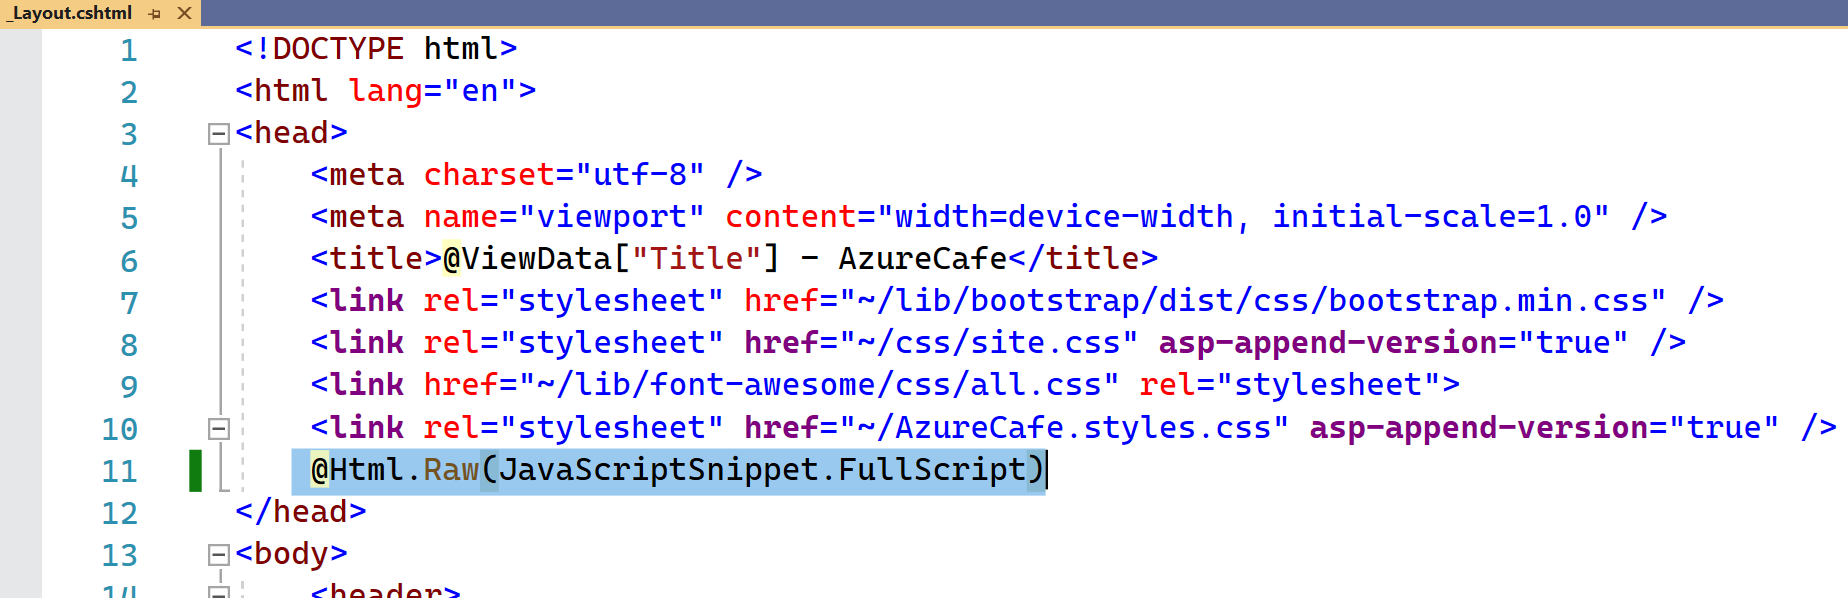
Tip
An alternative to using
FullScriptisScriptBody. UseScriptBodyif you need to control the<script>tag to set a Content Security Policy:<script> // apply custom changes to this script tag. @Html.Raw(JavaScriptSnippet.ScriptBody) </script>


Note
JavaScript injection provides a default configuration experience. If you require configuration beyond setting the connection string, you are required to remove auto-injection as described above and manually add the JavaScript SDK.
Enable monitoring of database queries
When investigating causes for performance degradation, it is important to include insights into database calls. You enable monitoring by configuring the dependency module. Dependency monitoring, including SQL, is enabled by default.
Follow these steps to capture the full SQL query text.
Note
SQL text may contain sensitive data such as passwords and PII. Be careful when enabling this feature.
From the Visual Studio Solution Explorer, open the Program.cs file.
At the top of the file, add the following
usingstatement.using Microsoft.ApplicationInsights.DependencyCollector;To enable SQL command text instrumentation, insert the following code immediately after the
builder.Services.AddApplicationInsightsTelemetry()code.builder.Services.ConfigureTelemetryModule<DependencyTrackingTelemetryModule>((module, o) => { module.EnableSqlCommandTextInstrumentation = true; });

Run the Azure Cafe web application
After you deploy the web application code, telemetry will flow to Application Insights. The Application Insights SDK automatically collects incoming web requests to your application.
From the Visual Studio Solution Explorer, right-click on the AzureCafe project and select Publish from the context menu.
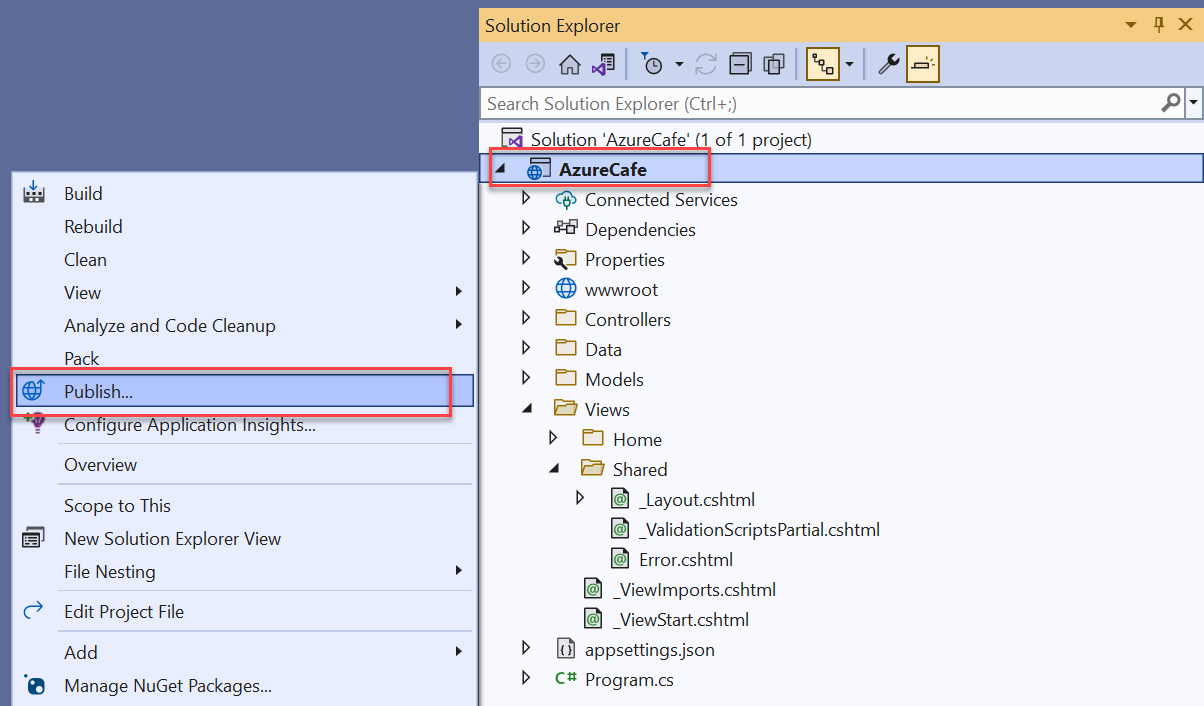
Select Publish to promote the new code to the Azure App Service.
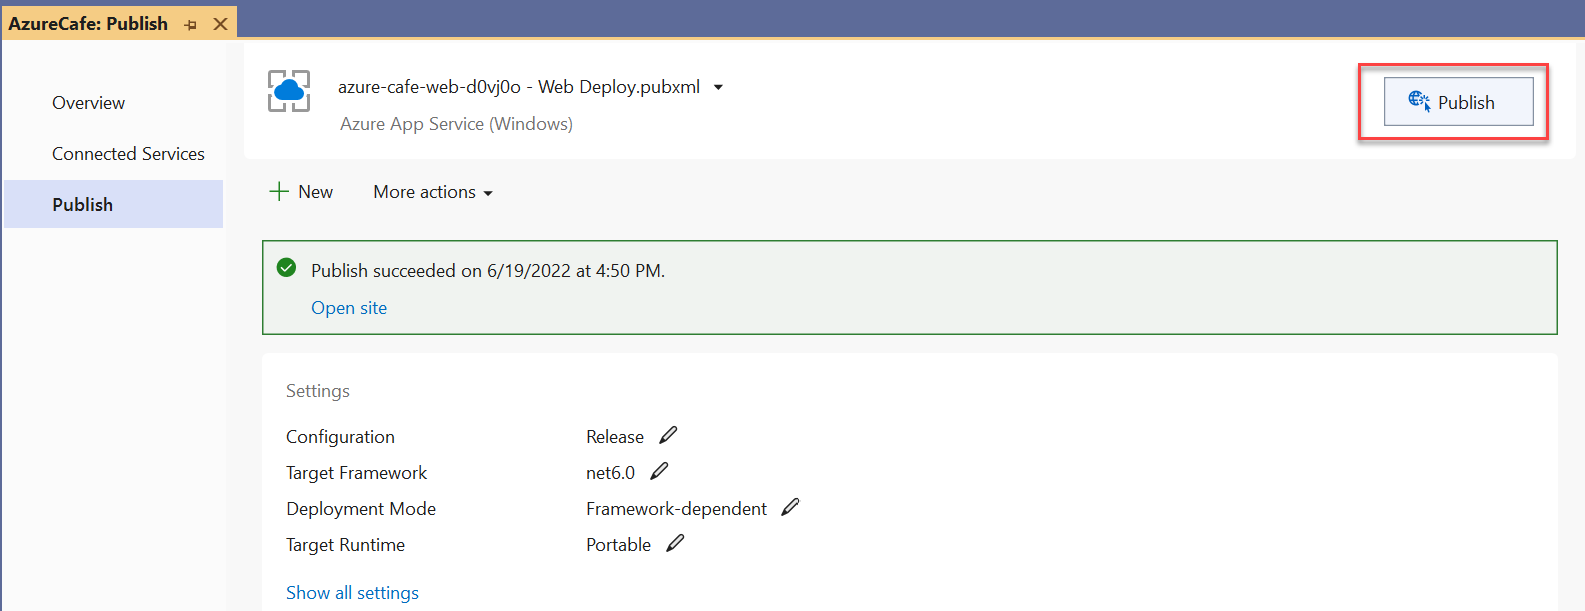
When the Azure Cafe web application is successfully published, a new browser window opens to the Azure Cafe web application.
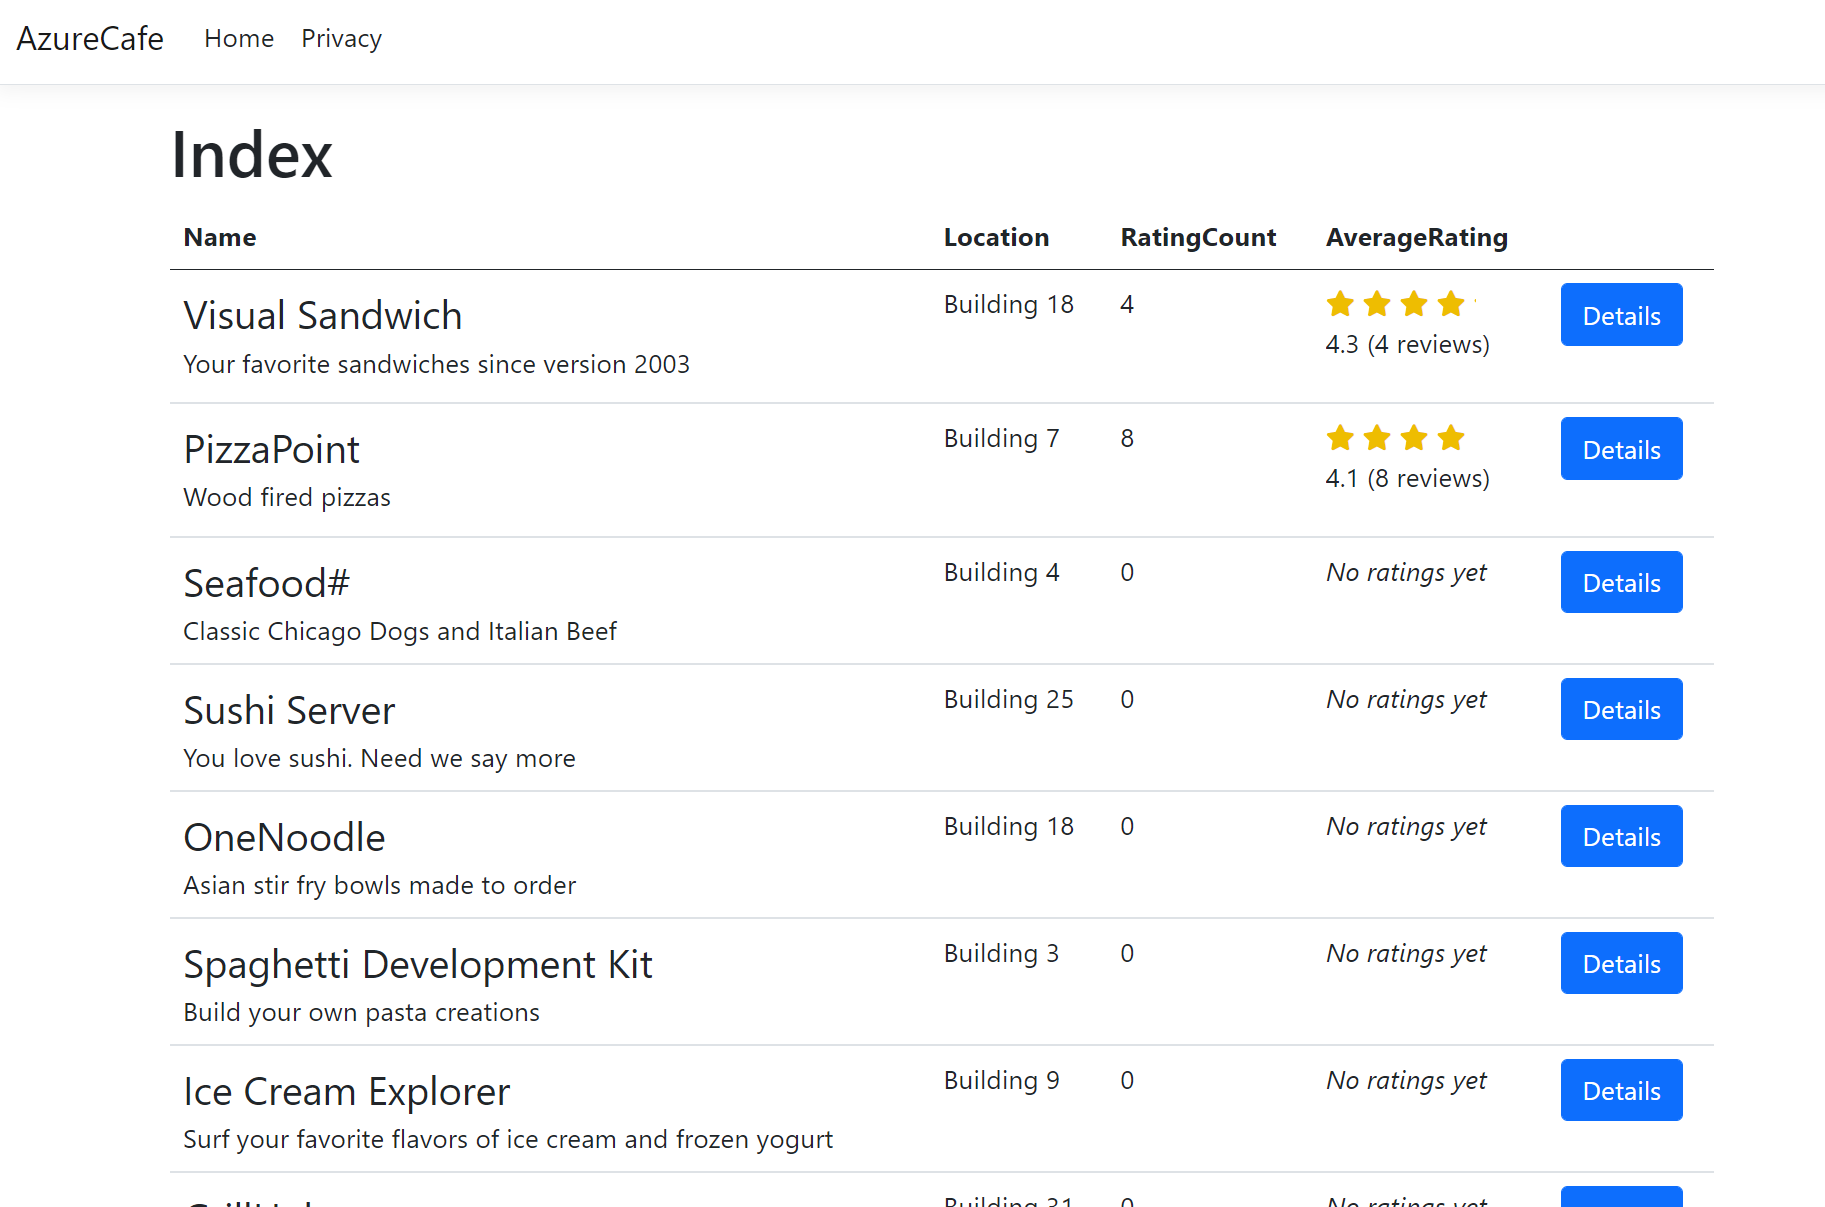
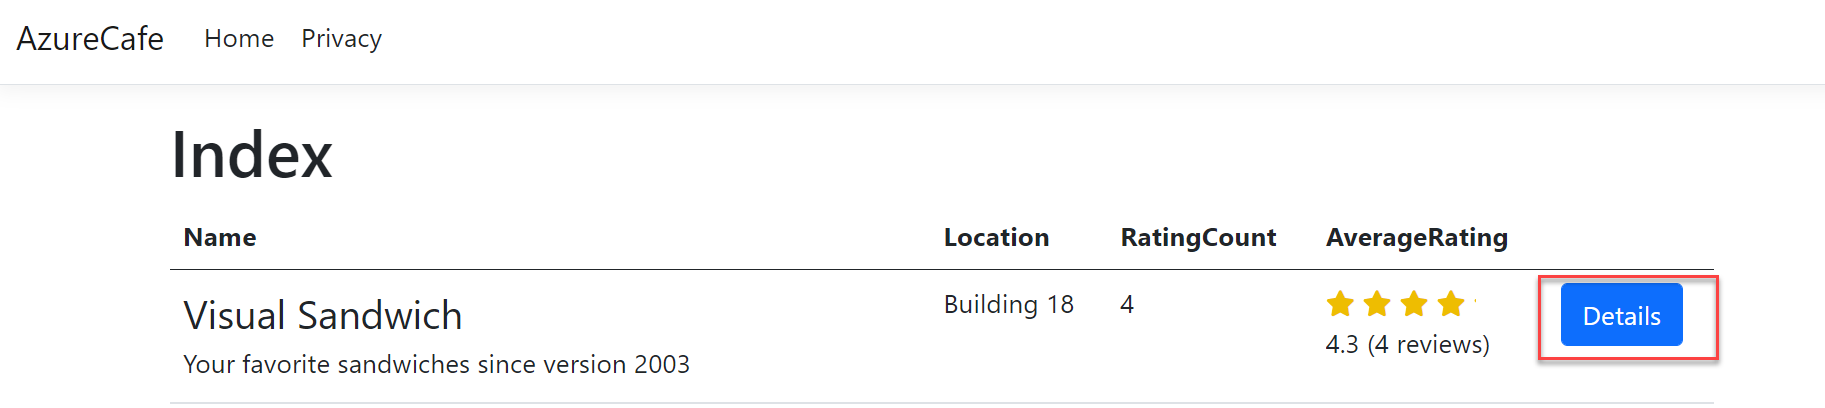
To generate some telemetry, follow these steps in the web application to add a review.
To view a cafe's menu and reviews, select Details next to a cafe.
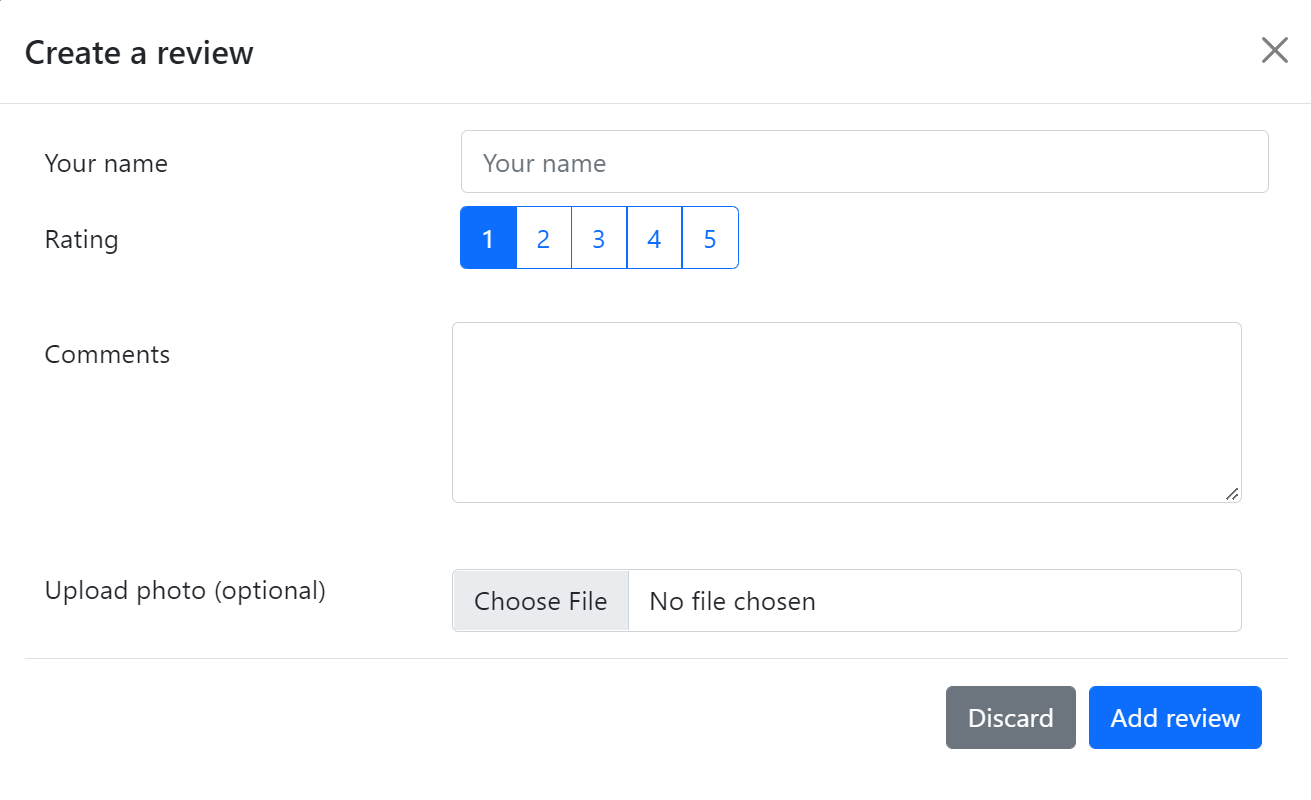
To view and add reviews, on the Cafe screen, select the Reviews tab. Select the Add review button to add a review.
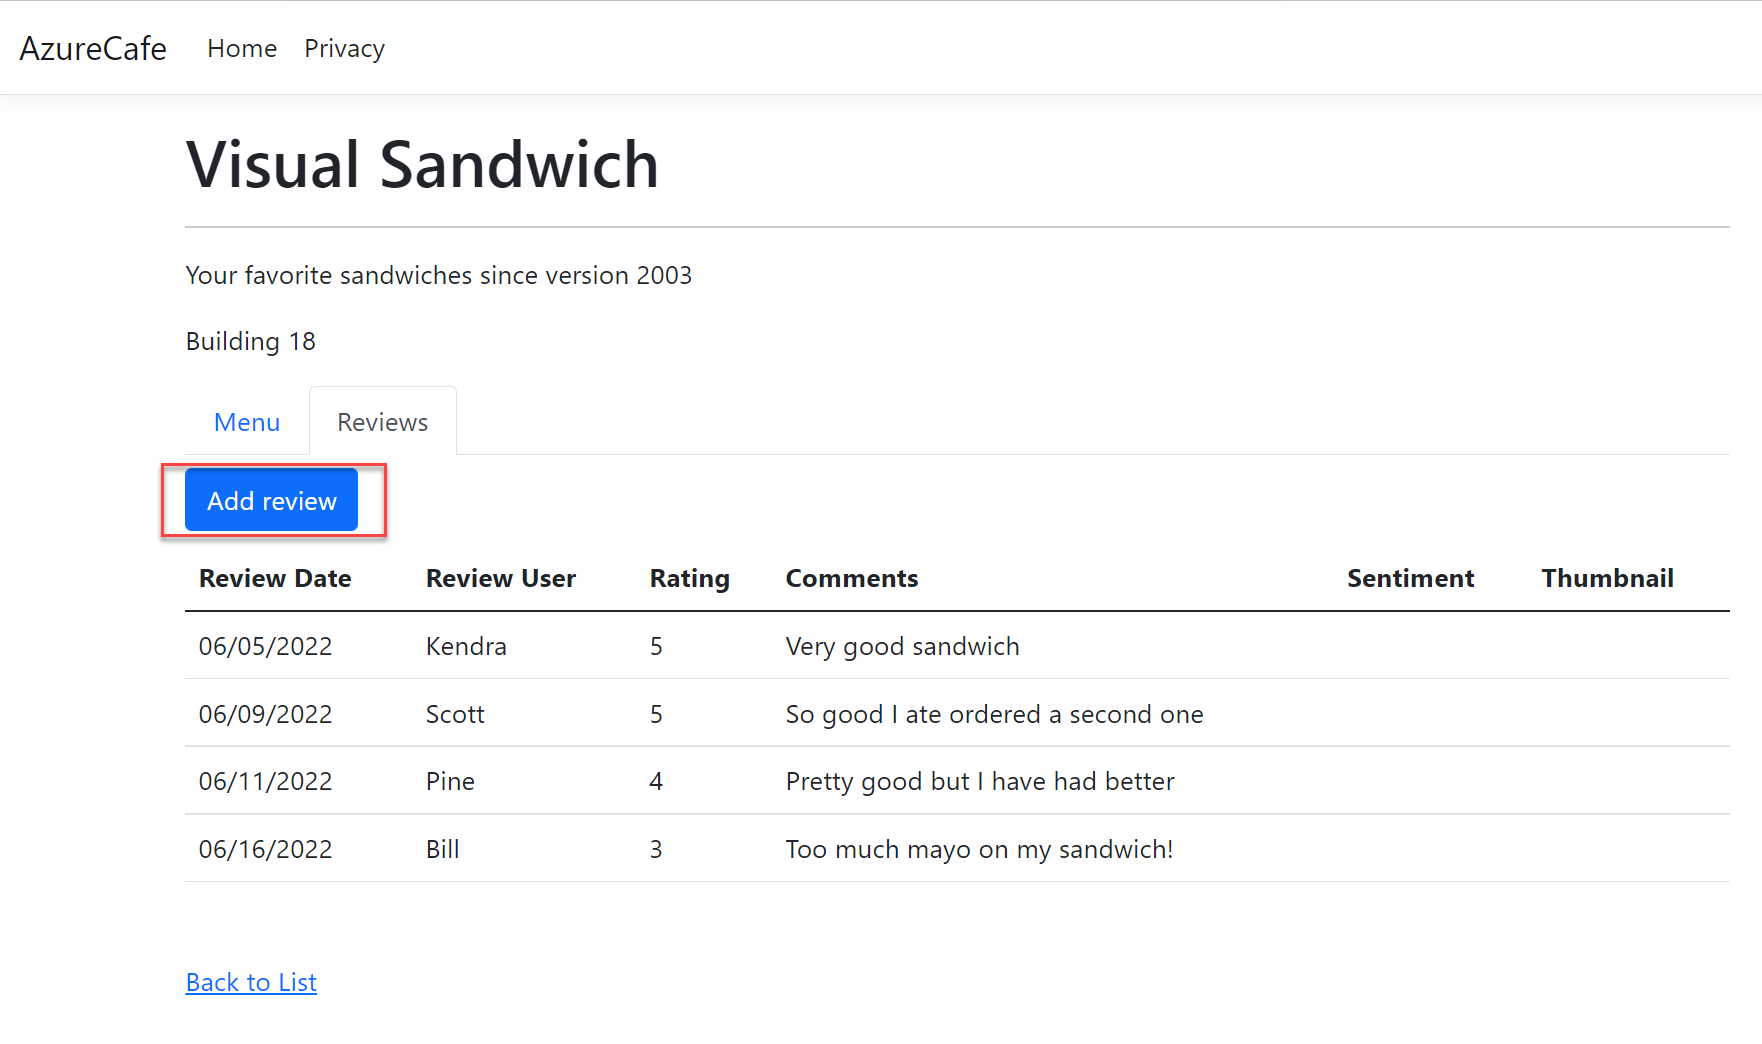
On the Create a review dialog, enter a name, rating, comments, and upload a photo for the review. When finished, select Add review.
If you need to generate additional telemetry, add additional reviews.


Live metrics
You can use Live Metrics to quickly verify if Application Insights monitoring is configured correctly. Live Metrics shows CPU usage of the running process in near real time. It can also show other telemetry such as Requests, Dependencies, and Traces. Note that it might take a few minutes for the telemetry to appear in the portal and analytics.
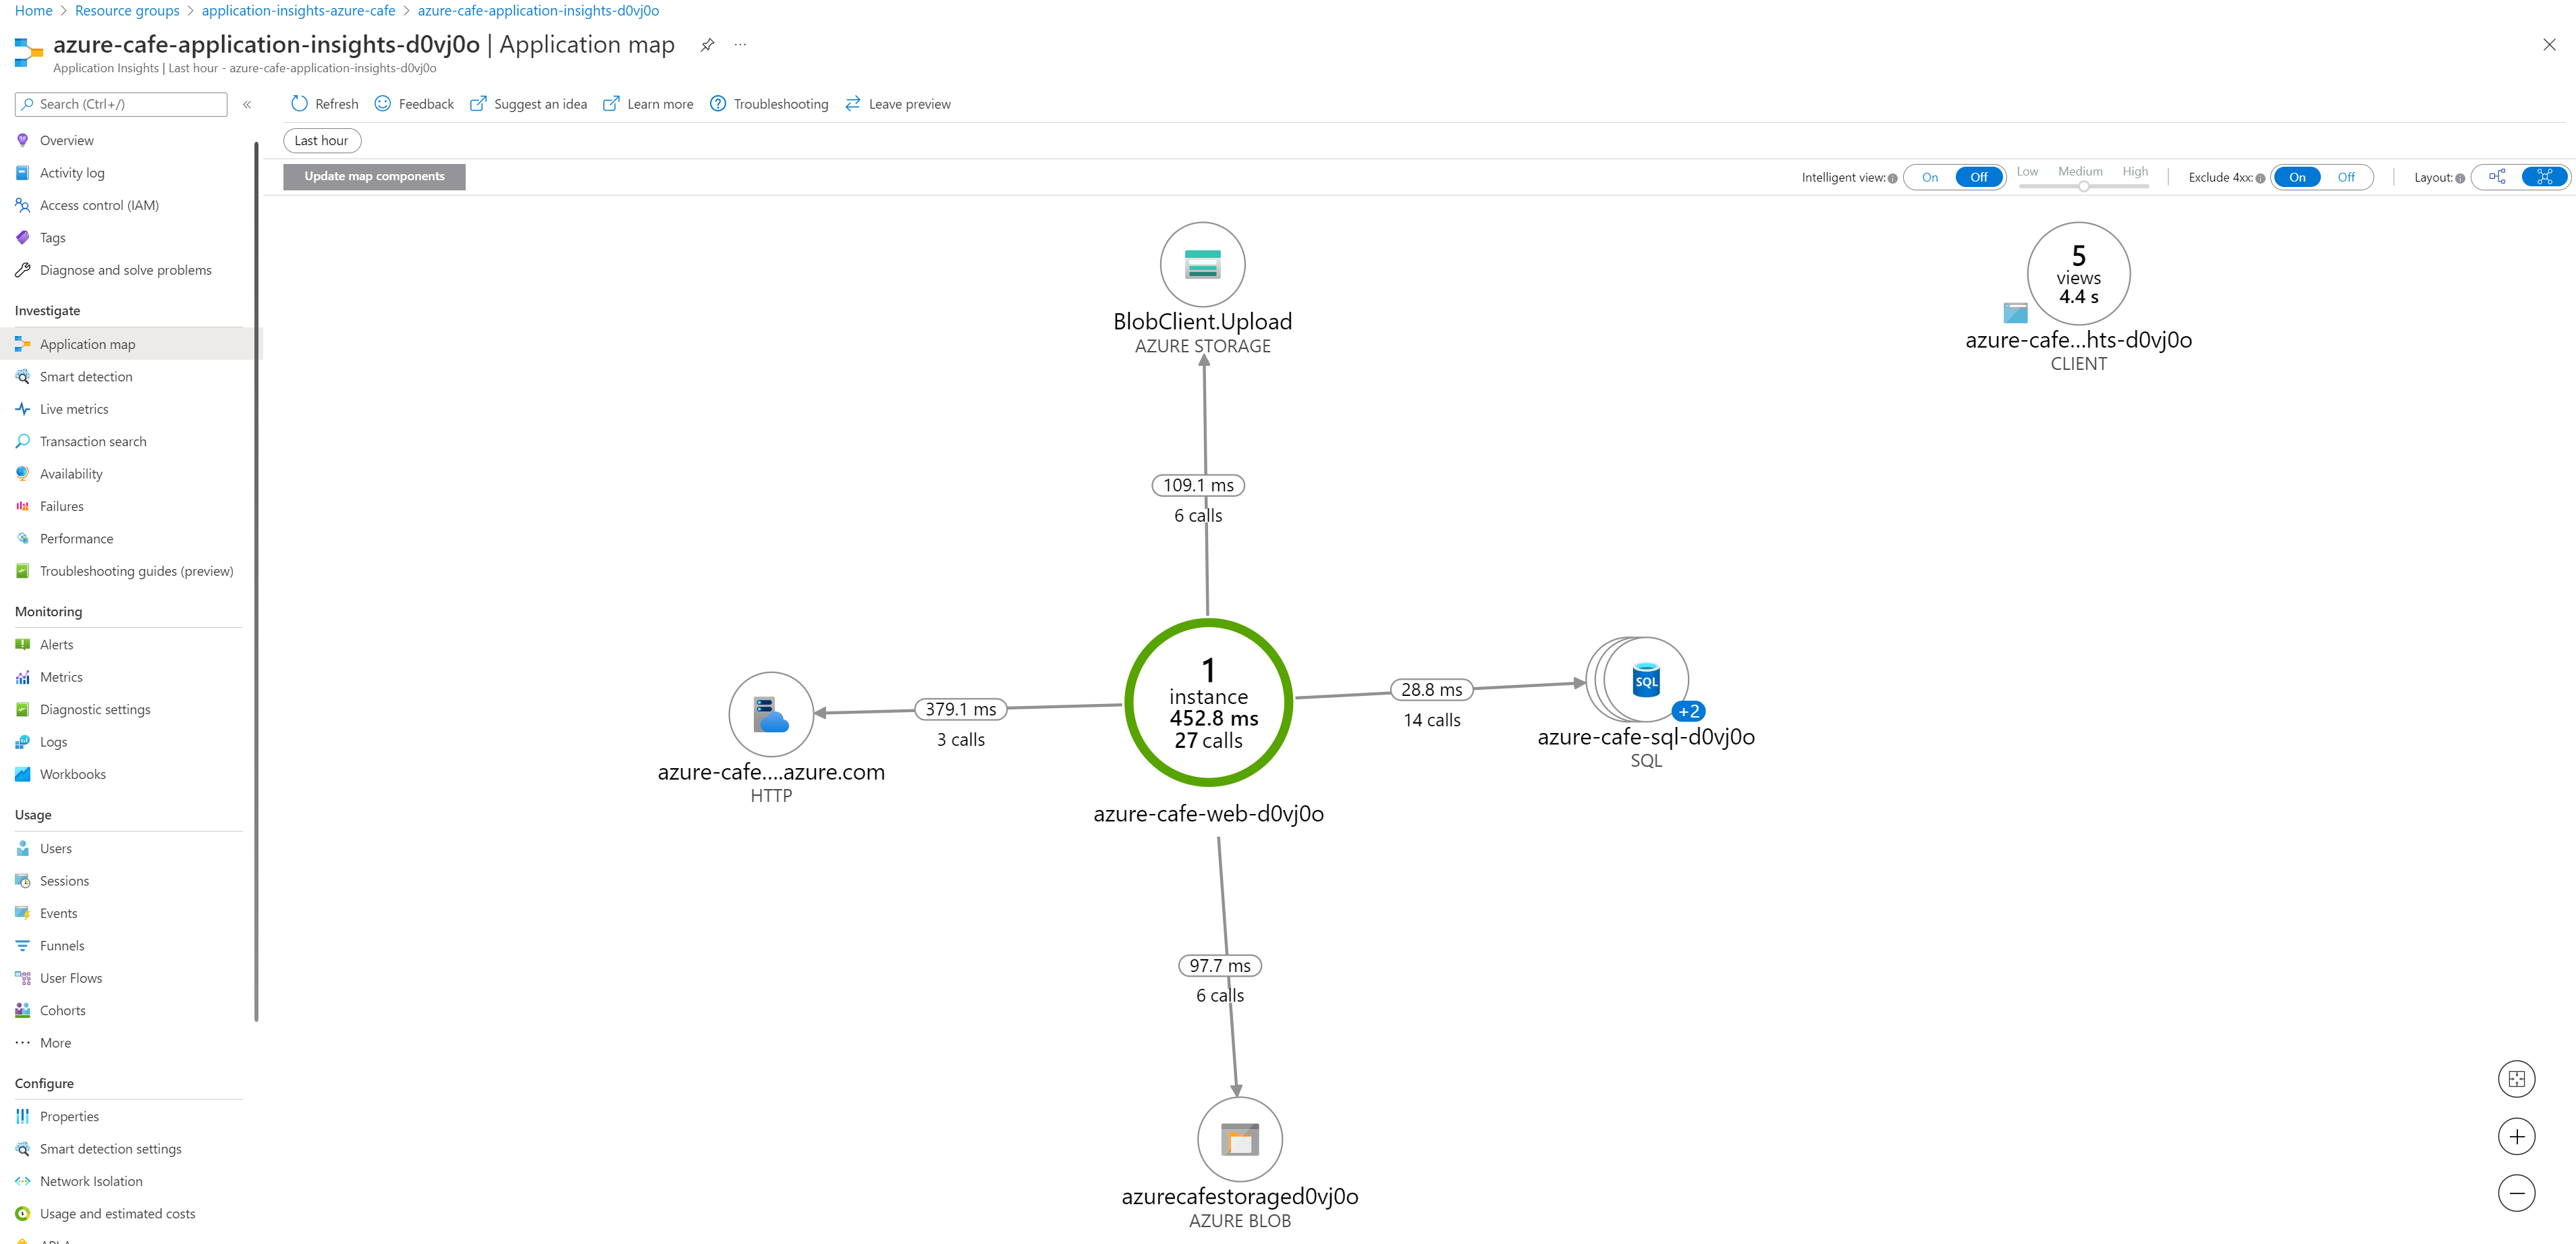
Viewing the application map
The sample application makes calls to multiple Azure resources, including Azure SQL, Azure Blob Storage, and the Azure Language Service (for review sentiment analysis).

Application Insights introspects the incoming telemetry data and is able to generate a visual map of the system integrations it detects.
Sign in to the Azure portal.
Open the resource group for the sample application, which is
application-insights-azure-cafe.From the list of resources, select the
azure-cafe-insights-{SUFFIX}Application Insights resource.From the left menu, beneath the Investigate heading, select Application map. Observe the generated Application map.

Viewing HTTP calls and database SQL command text
In the Azure portal, open the Application Insights resource.
On the left menu, beneath the Investigate header, select Performance.
The Operations tab contains details of the HTTP calls received by the application. To toggle between Server and Browser (client-side) views of the data, use the Server/Browser toggle.
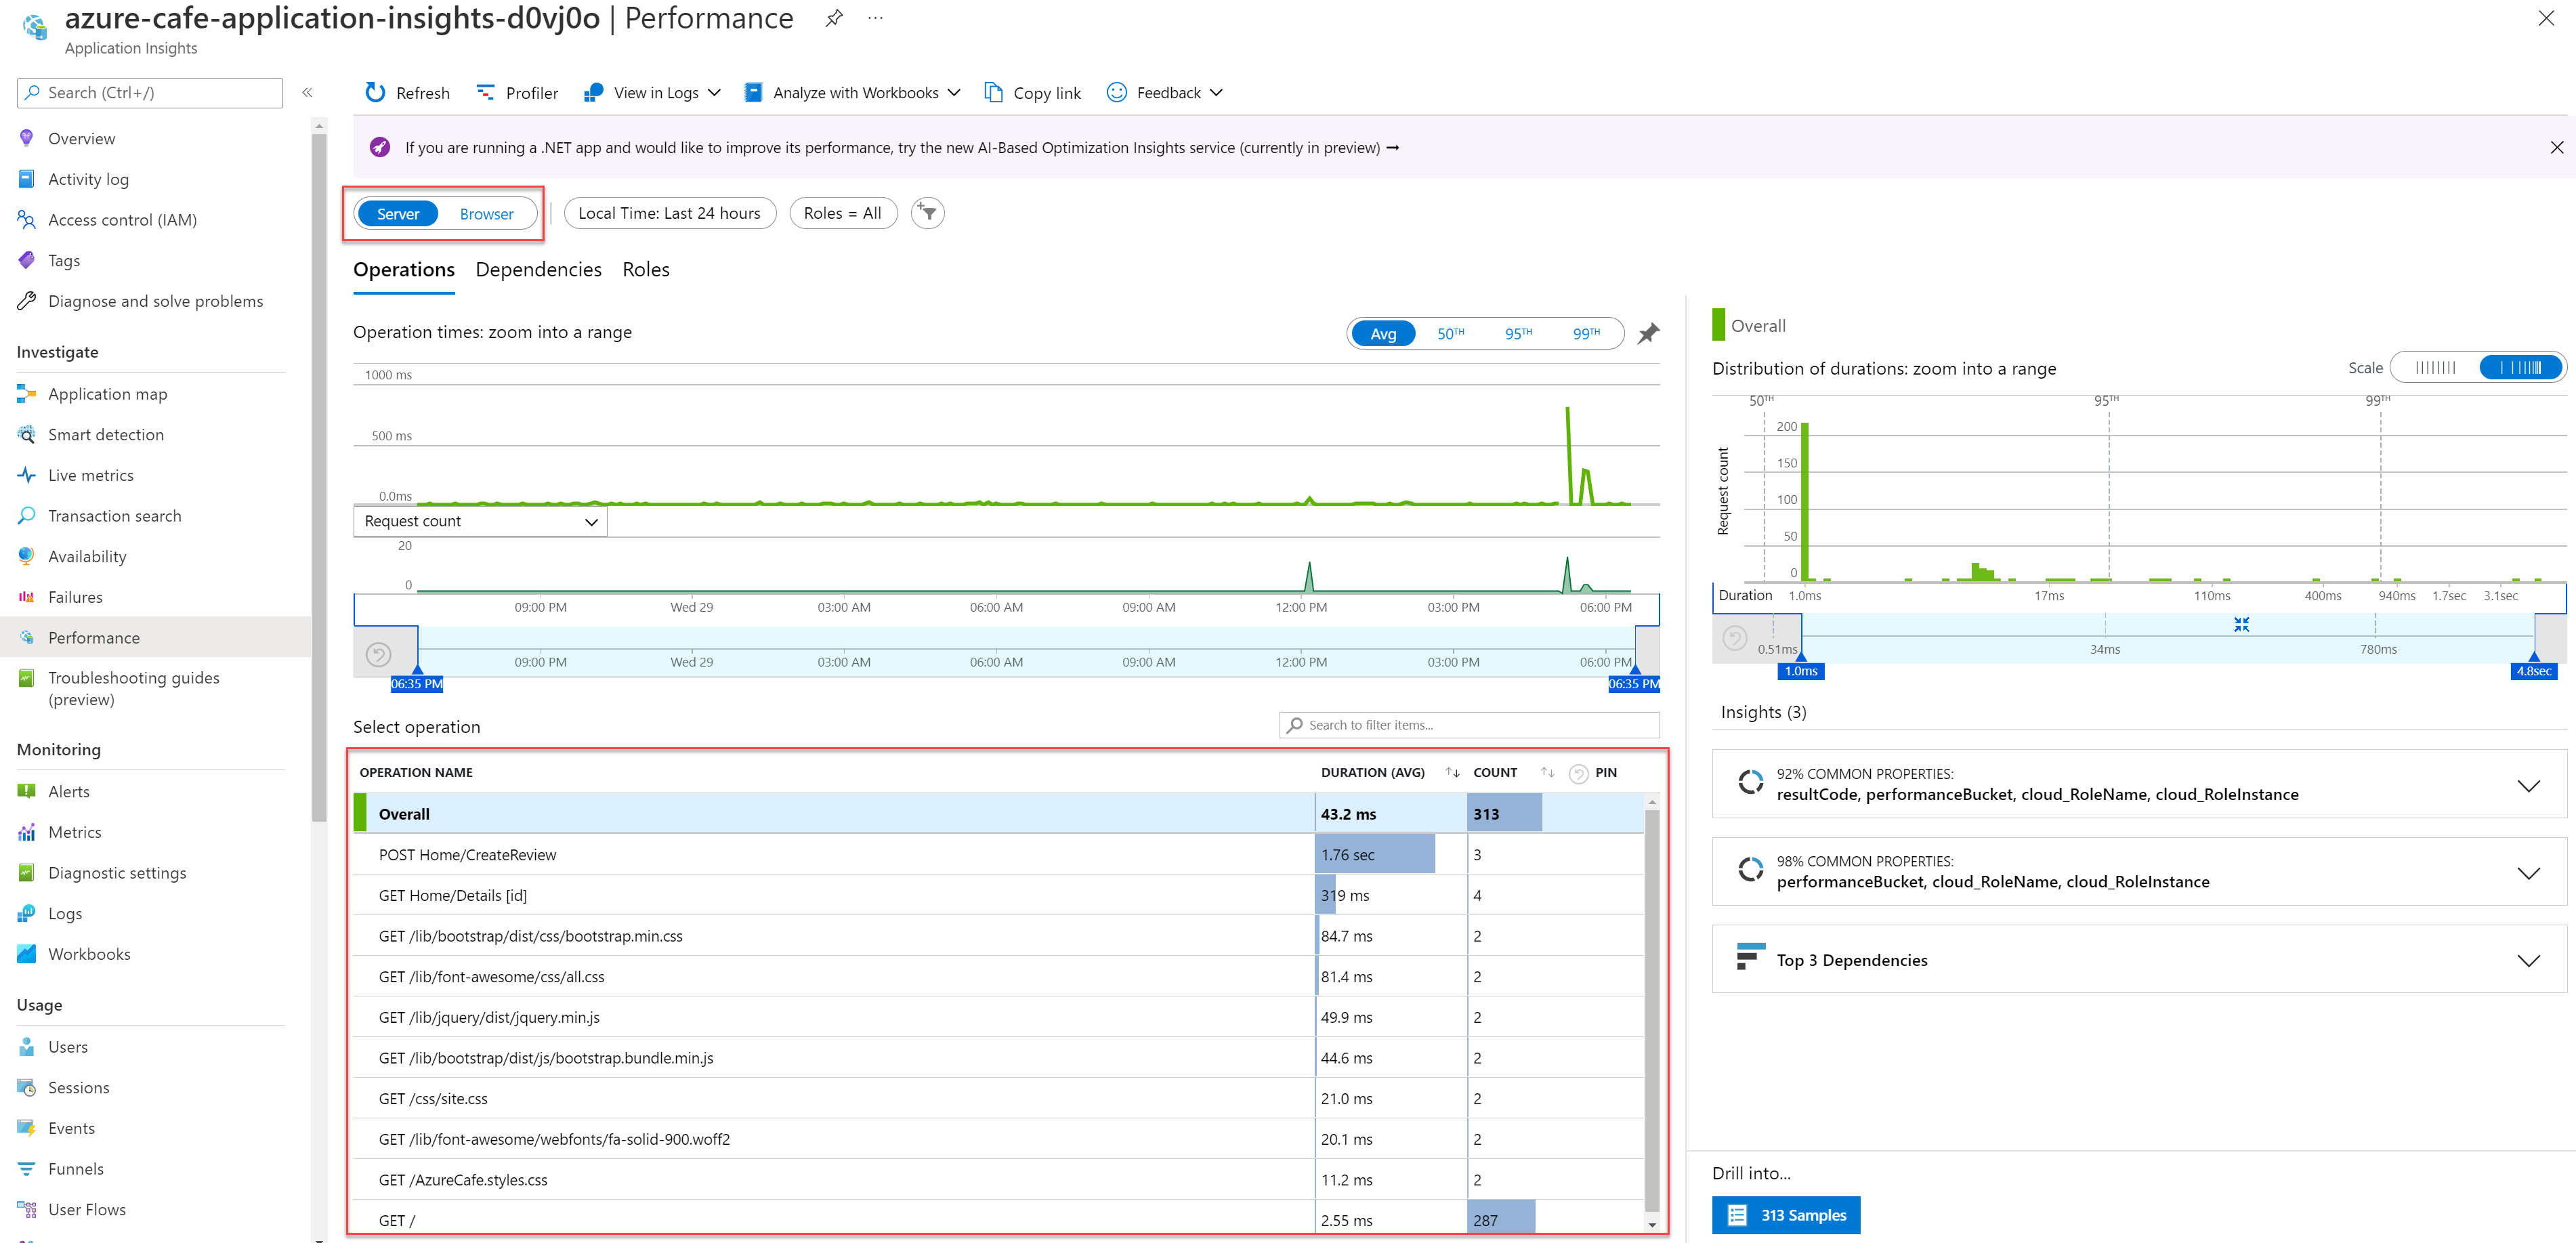
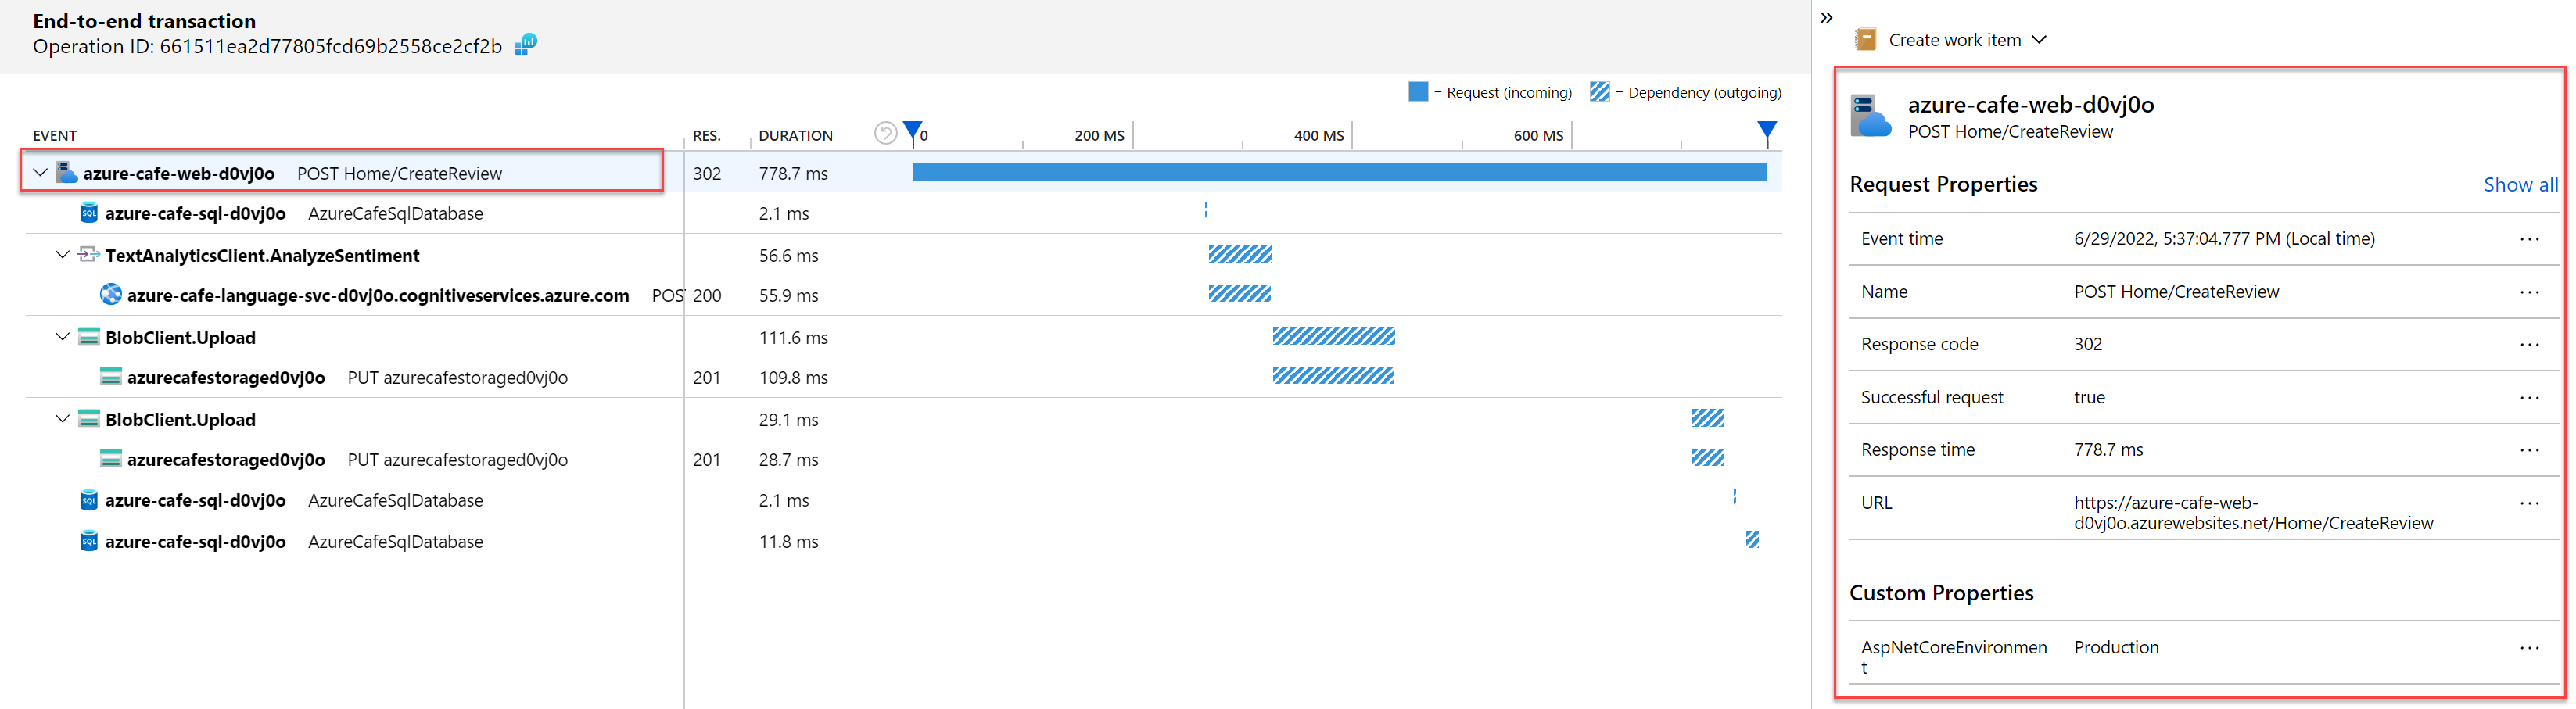
Select an Operation from the table, and choose to drill into a sample of the request.
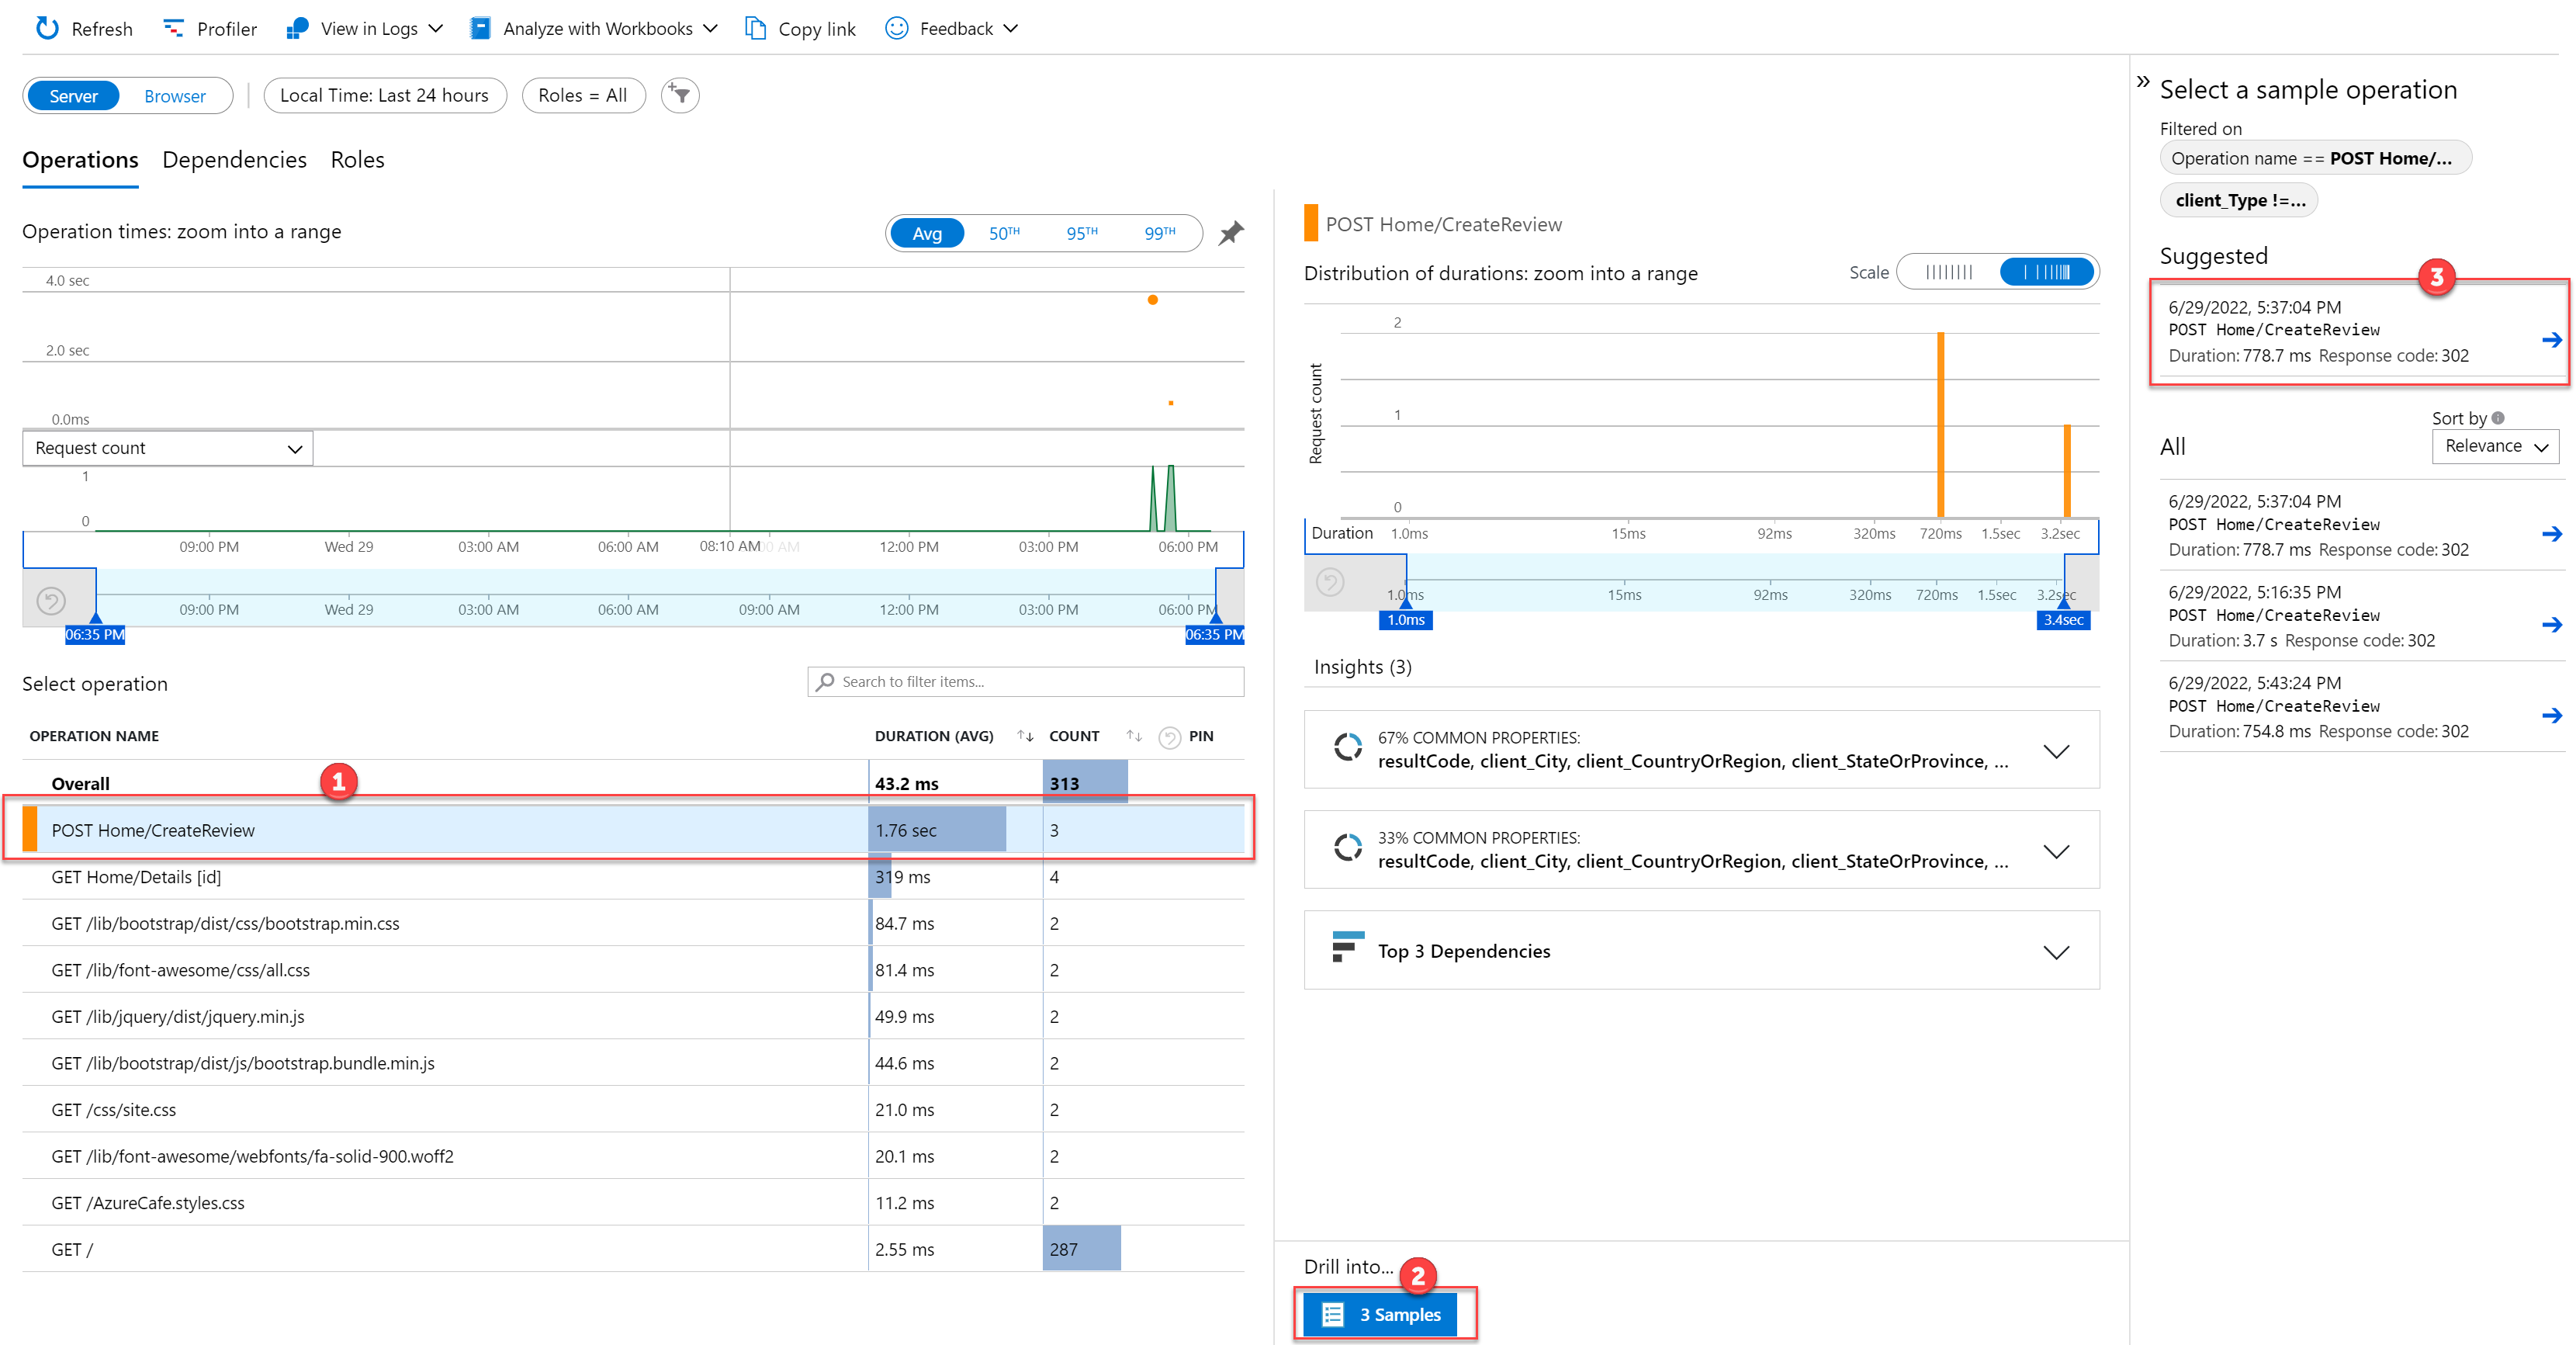
The end-to-end transaction displays for the selected request. In this case, a review was created, including an image, so it includes calls to Azure Storage and the Language Service (for sentiment analysis). It also includes database calls into SQL Azure to persist the review. In this example, the first selected Event displays information relative to the HTTP POST call.
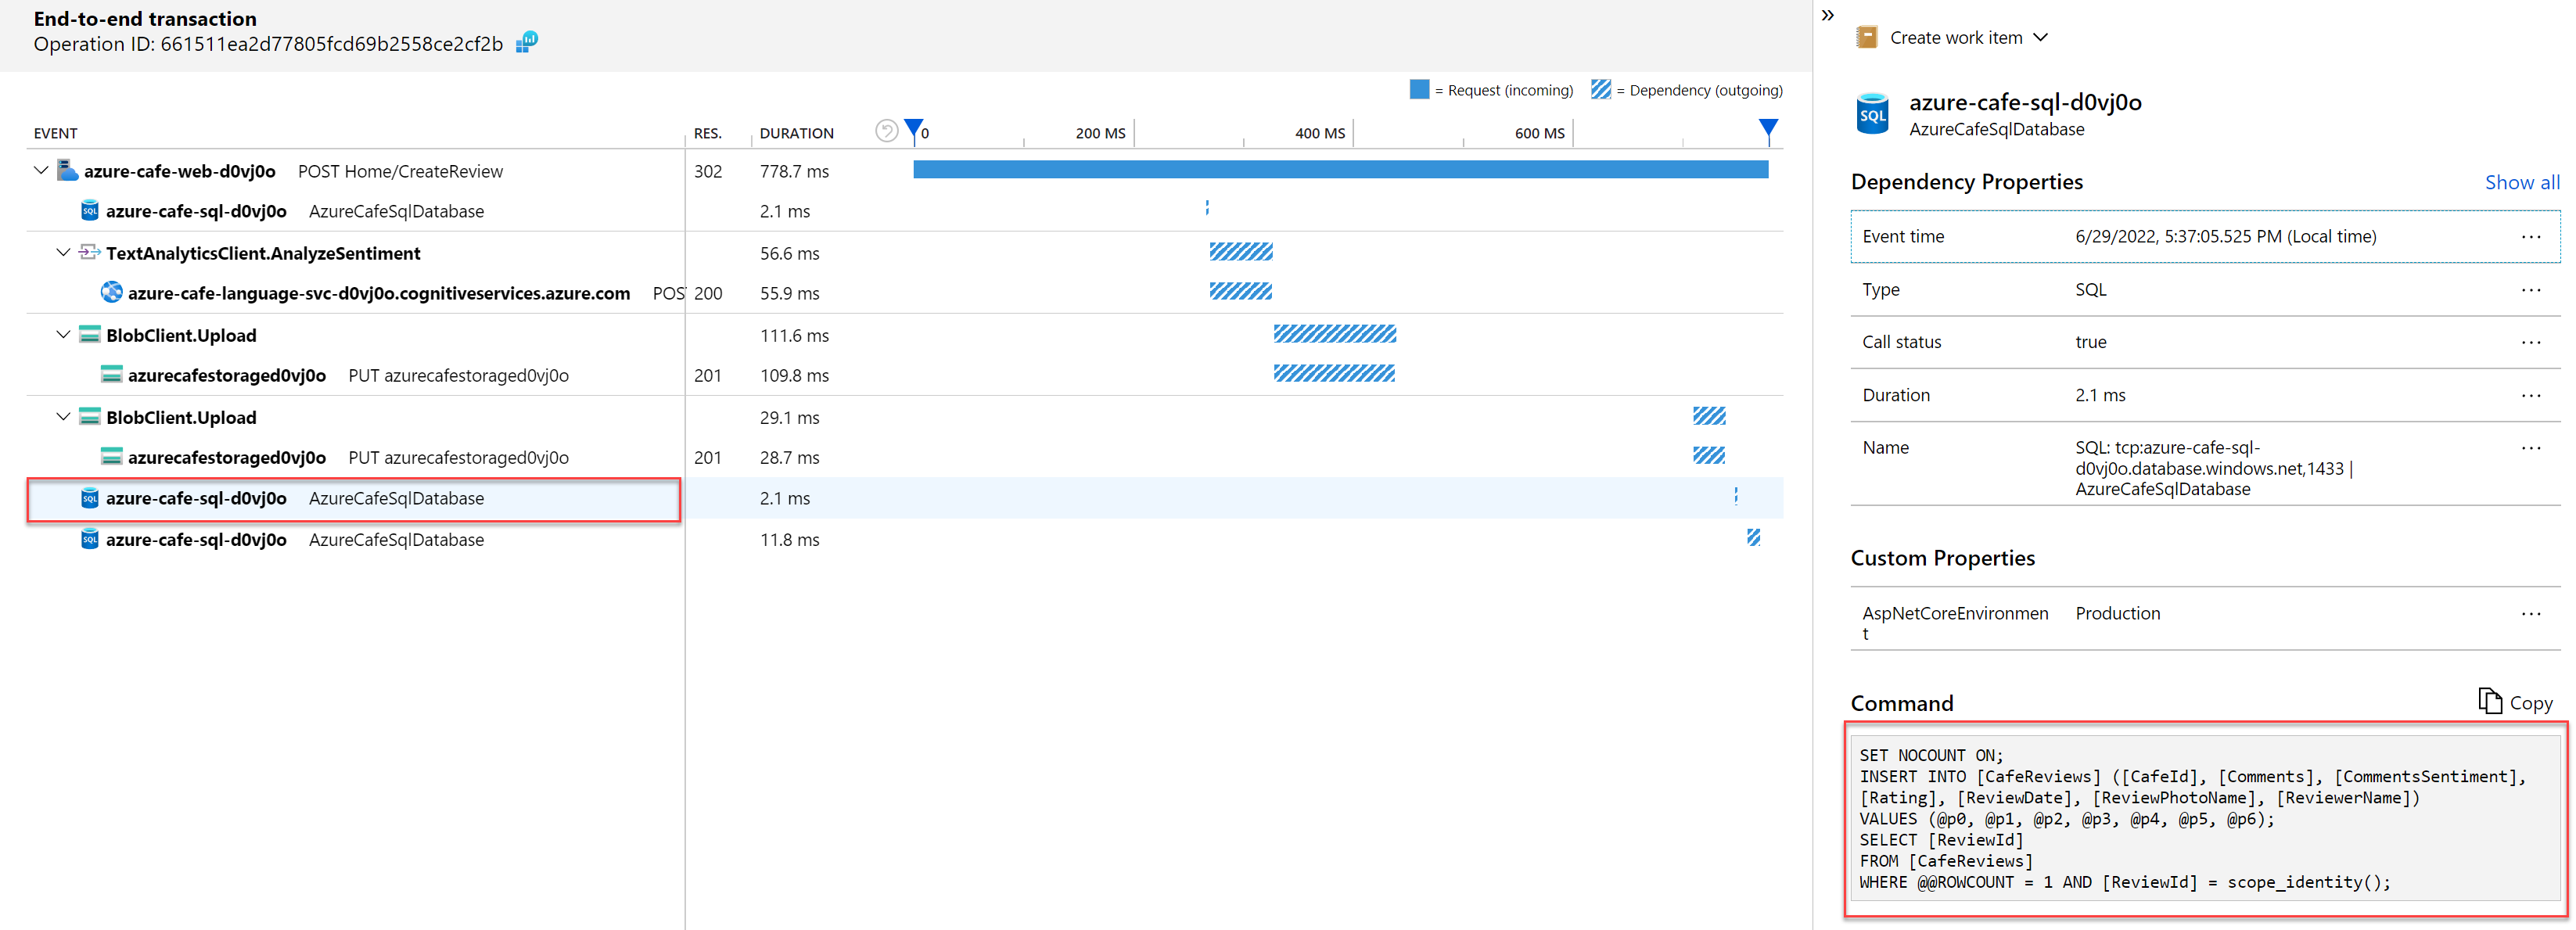
Select a SQL item to review the SQL command text issued to the database.
Optionally, select the Dependency (outgoing) requests to Azure Storage or the Language Service.
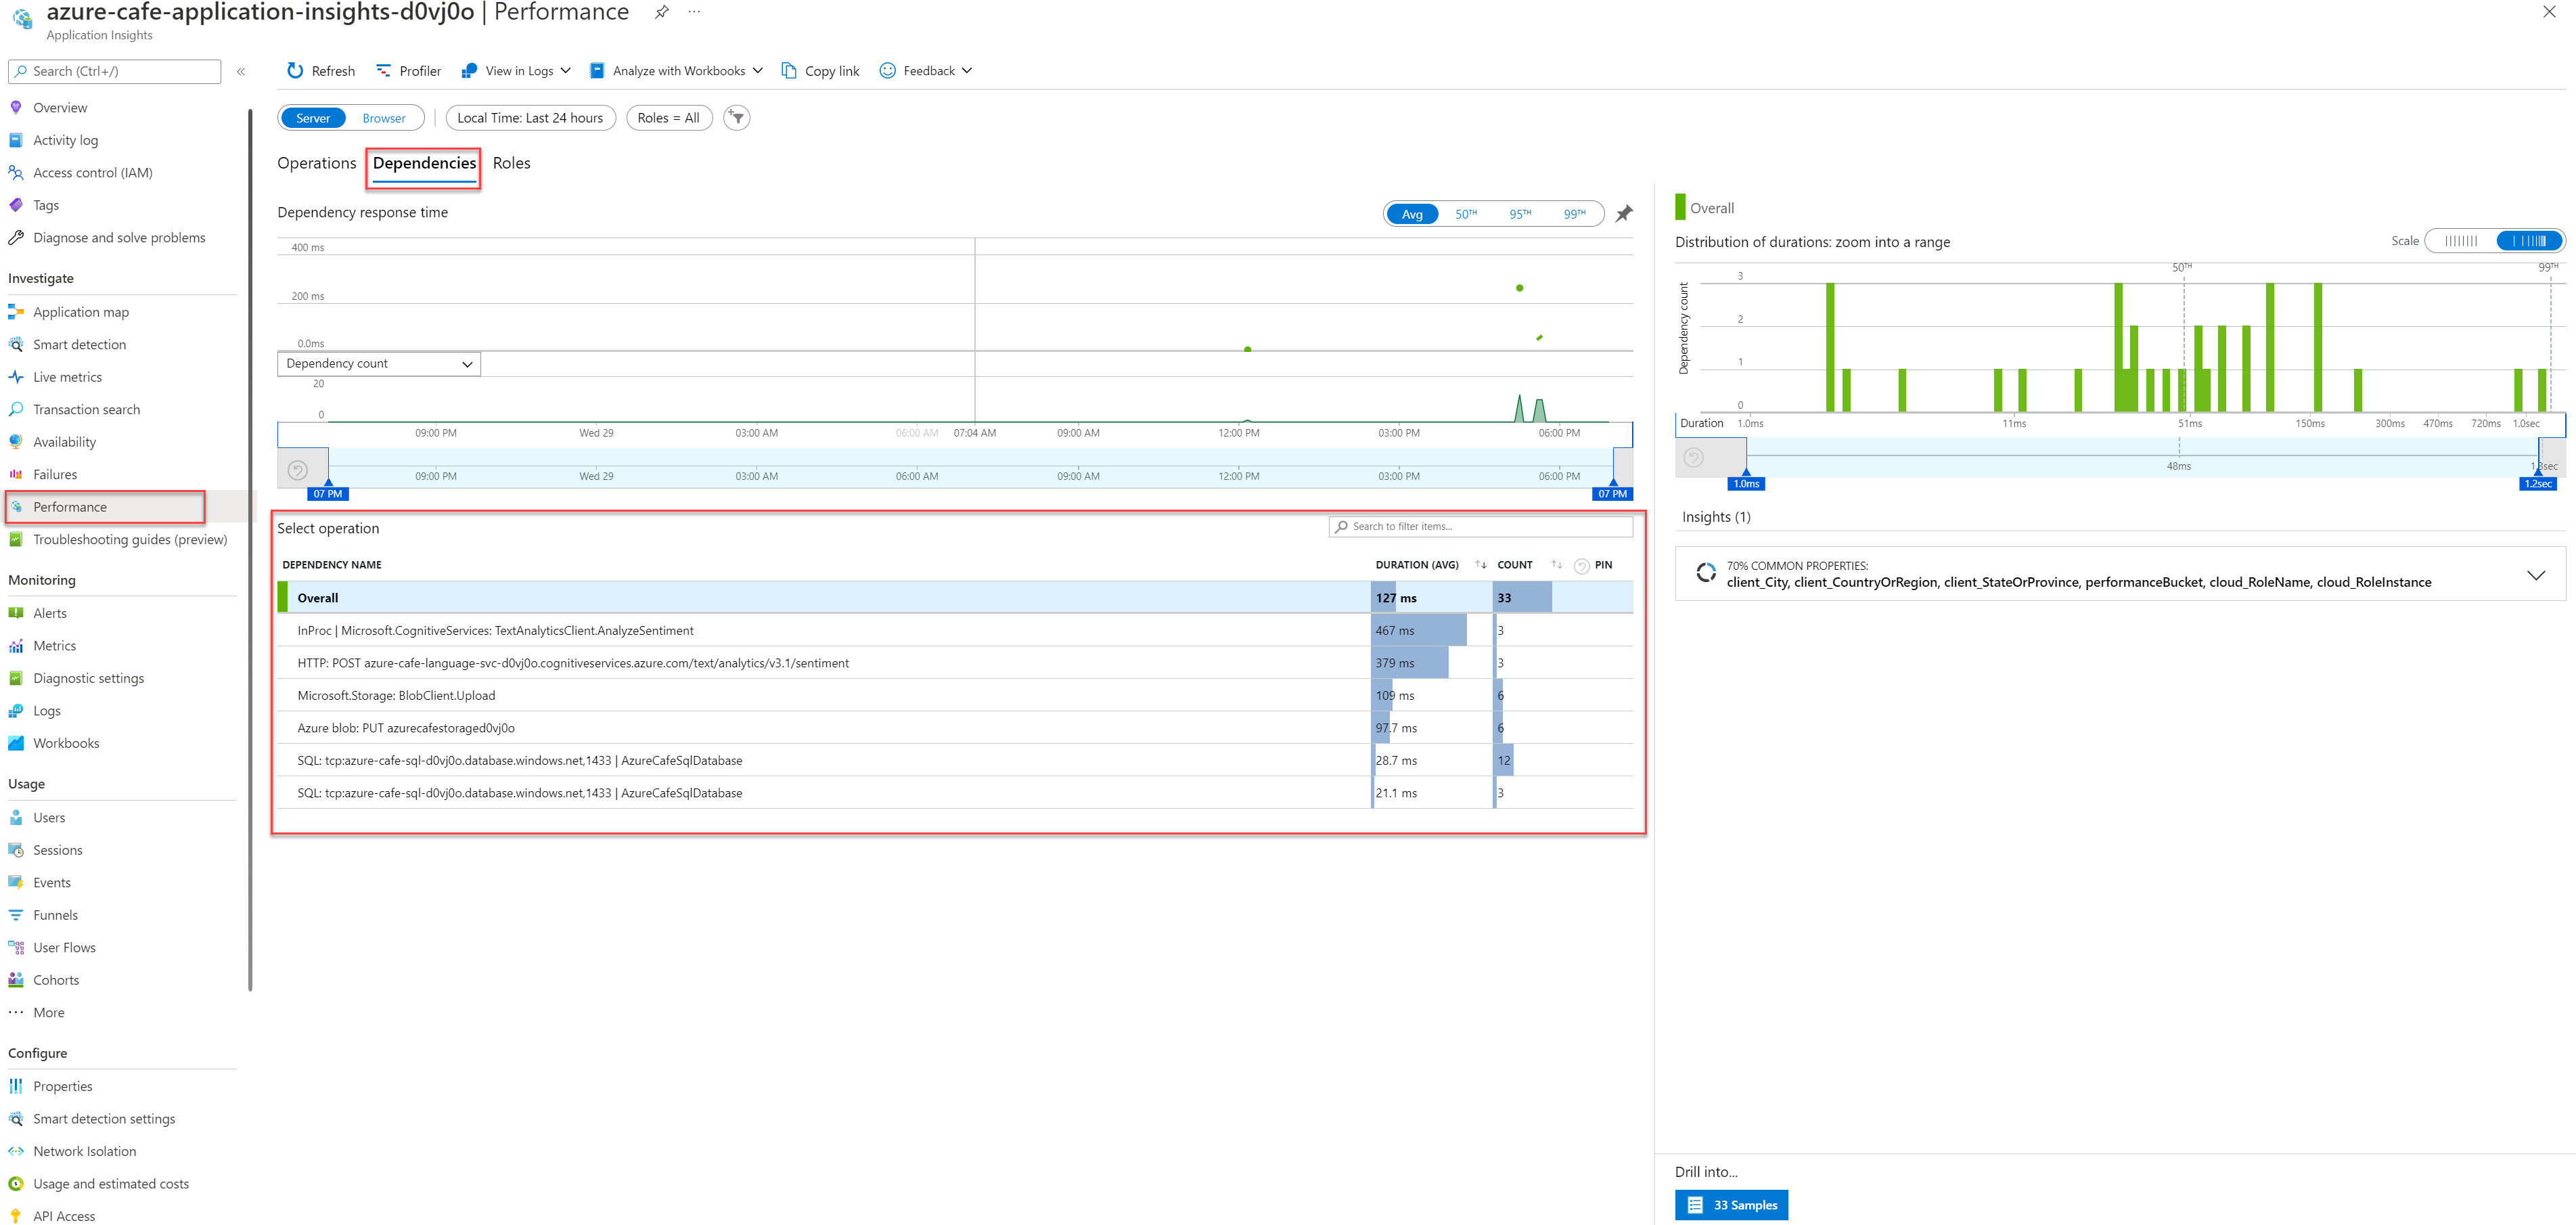
Return to the Performance screen and select the Dependencies tab to investigate calls into external resources. Notice the Operations table includes calls into Sentiment Analysis, Blob Storage, and Azure SQL.


Application logging with Application Insights
Logging overview
Application Insights is one type of logging provider available to ASP.NET Core applications that becomes available to applications when the Application Insights for ASP.NET Core NuGet package is installed and server-side telemetry collection is enabled.
As a reminder, the following code in Program.cs registers the ApplicationInsightsLoggerProvider with the built-in dependency injection container.
builder.Services.AddApplicationInsightsTelemetry();
With the ApplicationInsightsLoggerProvider registered as the logging provider, the app is ready to log into Application Insights by using either constructor injection with ILogger or the generic-type alternative ILogger<TCategoryName>.
Note
By default, the logging provider is configured to automatically capture log events with a severity of LogLevel.Warning or greater.
Consider the following example controller. It demonstrates the injection of ILogger, which is resolved with the ApplicationInsightsLoggerProvider that is registered with the dependency injection container. Observe in the Get method that an Informational, Warning, and Error message are recorded.
Note
By default, the Information level trace will not be recorded. Only the Warning and above levels are captured.
using Microsoft.AspNetCore.Mvc;

[Route("api/[controller]")]
[ApiController]
public class ValuesController : ControllerBase
{
    private readonly ILogger _logger;

    public ValuesController(ILogger<ValuesController> logger)
    {
        _logger = logger;
    }

    [HttpGet]
    public ActionResult<IEnumerable<string>> Get()
    {
        //Info level traces are not captured by default
        _logger.LogInformation("An example of an Info trace..");
        _logger.LogWarning("An example of a Warning trace..");
        _logger.LogError("An example of an Error level message");

        return new string[] { "value1", "value2" };
    }
}
For more information, see Logging in ASP.NET Core.
View logs in Application Insights
The ValuesController above is deployed with the sample application and is located in the Controllers folder of the project.
Using an internet browser, open the sample application. In the address bar, append
/api/Valuesand press Enter.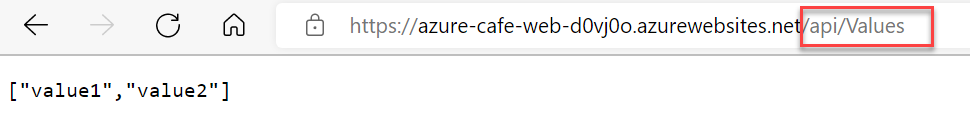
In the Azure portal, wait a few moments and then select the azure-cafe-insights-{SUFFIX} Application Insights resource.
From the left menu of the Application Insights resource, under the Monitoring section, select Logs.
In the Tables pane, under the Application Insights tree, double-click on the traces table.
Modify the query to retrieve traces for the Values controller as follows, then select Run to filter the results.
traces
| where operation_Name == "GET Values/Get"
The results display the logging messages present in the controller. A log severity of 2 indicates a warning level, and a log severity of 3 indicates an Error level.
Alternatively, you can also write the query to retrieve results based on the category of the log. By default, the category is the fully qualified name of the class where the ILogger is injected. In this case, the category name is ValuesController (if there is a namespace associated with the class, the name will be prefixed with the namespace). Re-write and run the following query to retrieve results based on category.
traces
| where customDimensions.CategoryName == "ValuesController"

Control the level of logs sent to Application Insights
ILogger implementations have a built-in mechanism to apply log filtering. This filtering lets you control the logs that are sent to each registered provider, including the Application Insights provider. You can use the filtering either in configuration (using an appsettings.json file) or in code. For more information about log levels and guidance on how to use them appropriately, see the Log Level documentation.
The following examples show how to apply filter rules to the ApplicationInsightsLoggerProvider to control the level of logs sent to Application Insights.
Create filter rules with configuration
The ApplicationInsightsLoggerProvider is aliased as ApplicationInsights in configuration. The following section of an appsettings.json file sets the default log level for all providers to LogLevel.Warning. The configuration for the ApplicationInsights provider, specifically for categories that start with "ValuesController," overrides this default value with LogLevel.Error and higher.
{
  //... additional code removed for brevity
  "Logging": {
    "LogLevel": { // No provider, LogLevel applies to all the enabled providers.
      "Default": "Warning"
    },
    "ApplicationInsights": { // Specific to the provider, LogLevel applies to the Application Insights provider.
      "LogLevel": {
        "ValuesController": "Error" //Log Level for the "ValuesController" category
      }
    }
  }
}
Deploying the sample application with the preceding code in appsettings.json will yield only the error trace being sent to Application Insights when interacting with the ValuesController. This is because the LogLevel for the ValuesController category is set to Error. Therefore, the Warning trace is suppressed.
Turn off logging to Application Insights
To disable logging by using configuration, set all LogLevel values to "None".
{
  //... additional code removed for brevity
  "Logging": {
    "LogLevel": { // No provider, LogLevel applies to all the enabled providers.
      "Default": "None"
    },
    "ApplicationInsights": { // Specific to the provider, LogLevel applies to the Application Insights provider.
      "LogLevel": {
        "ValuesController": "None" //Log Level for the "ValuesController" category
      }
    }
  }
}
Similarly, within the code, set the default level for the ApplicationInsightsLoggerProvider and any subsequent log levels to None.
var builder = WebApplication.CreateBuilder(args);
builder.Logging.AddFilter<ApplicationInsightsLoggerProvider>("", LogLevel.None);
builder.Logging.AddFilter<Microsoft.Extensions.Logging.ApplicationInsights.ApplicationInsightsLoggerProvider>("ValuesController", LogLevel.None);
Open-source SDK
For the latest updates and bug fixes, see the release notes.
Next steps
- Explore user flows to understand how users navigate through your app.
- Configure a snapshot collection to see the state of source code and variables at the moment an exception is thrown.
- Use the API to send your own events and metrics for a detailed view of your app's performance and usage.
- Availability overview
- Dependency Injection in ASP.NET Core
- Logging in ASP.NET Core
- .NET trace logs in Application Insights
- Autoinstrumentation for Application Insights