Enable monitoring for Kubernetes clusters
This article describes how to enable complete monitoring of your Kubernetes clusters using the following Azure Monitor features:
- Managed Prometheus for metric collection
- Container insights for log collection
- Managed Grafana for visualization.
Using the Azure portal, you can enable all of the features at the same time. You can also enable them individually by using the Azure CLI, Azure Resource Manager template, Terraform, or Azure Policy. Each of these methods is described in this article.
Important
Kubernetes clusters generate a lot of log data, which can result in significant costs if you aren't selective about the logs that you collect. Before you enable monitoring for your cluster, see the following articles to ensure that your environment is optimized for cost and that you limit your log collection to only the data that you require:
- Configure data collection and cost optimization in Container insights using data collection rule
Details on customizing log collection once you've enabled monitoring, including using preset cost optimization configurations. - Best practices for monitoring Kubernetes with Azure Monitor
Best practices for monitoring Kubernetes clusters organized by the five pillars of the Azure Well-Architected Framework, including cost optimization. - Cost optimization in Azure Monitor
Best practices for configuring all features of Azure Monitor to optimize you costs and limit the amount of data that you collect.
Supported clusters
This article provides onboarding guidance for the following types of clusters. Any differences in the process for each type are noted in the relevant sections.
Prerequisites
Permissions
- You require at least Contributor access to the cluster for onboarding.
- You require Monitoring Reader or Monitoring Contributor to view data after monitoring is enabled.
Managed Prometheus prerequisites
- The cluster must use managed identity authentication.
- The following resource providers must be registered in the subscription of the AKS cluster and the Azure Monitor workspace:
- Microsoft.ContainerService
- Microsoft.Insights
- Microsoft.AlertsManagement
- Microsoft.Monitor
- The following resource providers must be registered in the subscription of the Grafana workspace subscription:
- Microsoft.Dashboard
Arc-Enabled Kubernetes clusters prerequisites
- Prerequisites for Azure Arc-enabled Kubernetes cluster extensions.
- Verify the firewall requirements in addition to the Azure Arc-enabled Kubernetes network requirements.
- If you previously installed monitoring for AKS, ensure that you have disabled monitoring before proceeding to avoid issues during the extension install.
- If you previously installed monitoring on a cluster using a script without cluster extensions, follow the instructions at Disable monitoring of your Kubernetes cluster to delete this Helm chart.
Note
The Managed Prometheus Arc-Enabled Kubernetes extension does not support the following configurations:
- Red Hat Openshift distributions
- Windows nodes
Workspaces
The following table describes the workspaces that are required to support Managed Prometheus and Container insights. You can create each workspace as part of the onboarding process or use an existing workspace. See Design a Log Analytics workspace architecture for guidance on how many workspaces to create and where they should be placed.
| Feature | Workspace | Notes |
|---|---|---|
| Managed Prometheus | Azure Monitor workspace | Contributor permission is enough for enabling the addon to send data to the Azure Monitor workspace. You will need Owner level permission to link your Azure Monitor Workspace to view metrics in Azure Managed Grafana. This is required because the user executing the onboarding step, needs to be able to give the Azure Managed Grafana System Identity Monitoring Reader role on the Azure Monitor Workspace to query the metrics. |
| Container insights | Log Analytics workspace | You can attach an AKS cluster to a Log Analytics workspace in a different Azure subscription in the same Microsoft Entra tenant, but you must use the Azure CLI or an Azure Resource Manager template. You can't currently perform this configuration with the Azure portal. If you're connecting an existing AKS cluster to a Log Analytics workspace in another subscription, the Microsoft.ContainerService resource provider must be registered in the subscription with the Log Analytics workspace. For more information, see Register resource provider. For a list of the supported mapping pairs to use for the default workspace, see Region mappings supported by Container insights. |
| Managed Grafana | Azure Managed Grafana workspace | Link your Grafana workspace to your Azure Monitor workspace to make the Prometheus metrics collected from your cluster available to Grafana dashboards. |
Enable Prometheus and Grafana
Use one of the following methods to enable scraping of Prometheus metrics from your cluster and enable Managed Grafana to visualize the metrics. See Link a Grafana workspace for options to connect your Azure Monitor workspace and Azure Managed Grafana workspace.
Note
If you have a single Azure Monitor Resource that is private-linked, then Prometheus enablement won't work if the AKS cluster and Azure Monitor Workspace are in different regions. The configuration needed for the Prometheus add-on isn't available cross region because of the private link constraint. To resolve this, create a new DCE in the AKS cluster location and a new DCRA (association) in the same AKS cluster region. Associate the new DCE with the AKS cluster and name the new association (DCRA) as configurationAccessEndpoint. For full instructions on how to configure the DCEs associated with your Azure Monitor workspace to use a Private Link for data ingestion, see Use a private link for Managed Prometheus data ingestion.
If you don't specify an existing Azure Monitor workspace in the following commands, the default workspace for the resource group will be used. If a default workspace doesn't already exist in the cluster's region, one with a name in the format DefaultAzureMonitorWorkspace-<mapped_region> will be created in a resource group with the name DefaultRG-<cluster_region>.
Prerequisites
- Az CLI version of 2.49.0 or higher is required.
- The aks-preview extension must be uninstalled from AKS clusters by using the command
az extension remove --name aks-preview. - The k8s-extension extension must be installed using the command
az extension add --name k8s-extension. - The k8s-extension version 1.4.1 or higher is required.
AKS cluster
Use the -enable-azure-monitor-metrics option az aks create or az aks update (depending whether you're creating a new cluster or updating an existing cluster) to install the metrics add-on that scrapes Prometheus metrics.
Sample commands
### Use default Azure Monitor workspace
az aks create/update --enable-azure-monitor-metrics --name <cluster-name> --resource-group <cluster-resource-group>

### Use existing Azure Monitor workspace
az aks create/update --enable-azure-monitor-metrics --name <cluster-name> --resource-group <cluster-resource-group> --azure-monitor-workspace-resource-id <workspace-name-resource-id>

### Use an existing Azure Monitor workspace and link with an existing Grafana workspace
az aks create/update --enable-azure-monitor-metrics --name <cluster-name> --resource-group <cluster-resource-group> --azure-monitor-workspace-resource-id <azure-monitor-workspace-name-resource-id> --grafana-resource-id  <grafana-workspace-name-resource-id>

### Use optional parameters
az aks create/update --enable-azure-monitor-metrics --name <cluster-name> --resource-group <cluster-resource-group> --ksm-metric-labels-allow-list "namespaces=[k8s-label-1,k8s-label-n]" --ksm-metric-annotations-allow-list "pods=[k8s-annotation-1,k8s-annotation-n]"
Arc-enabled cluster
### Use default Azure Monitor workspace
az k8s-extension create --name azuremonitor-metrics --cluster-name <cluster-name> --resource-group <resource-group> --cluster-type connectedClusters --extension-type Microsoft.AzureMonitor.Containers.Metrics

## Use existing Azure Monitor workspace
az k8s-extension create --name azuremonitor-metrics --cluster-name <cluster-name> --resource-group <resource-group> --cluster-type connectedClusters --extension-type Microsoft.AzureMonitor.Containers.Metrics --configuration-settings azure-monitor-workspace-resource-id=<workspace-name-resource-id>

### Use an existing Azure Monitor workspace and link with an existing Grafana workspace
az k8s-extension create --name azuremonitor-metrics --cluster-name <cluster-name> --resource-group <resource-group> --cluster-type connectedClusters --extension-type Microsoft.AzureMonitor.Containers.Metrics --configuration-settings azure-monitor-workspace-resource-id=<workspace-name-resource-id> grafana-resource-id=<grafana-workspace-name-resource-id>

### Use optional parameters
az k8s-extension create --name azuremonitor-metrics --cluster-name <cluster-name> --resource-group <resource-group> --cluster-type connectedClusters --extension-type Microsoft.AzureMonitor.Containers.Metrics --configuration-settings azure-monitor-workspace-resource-id=<workspace-name-resource-id> grafana-resource-id=<grafana-workspace-name-resource-id> AzureMonitorMetrics.KubeStateMetrics.MetricAnnotationsAllowList="pods=[k8s-annotation-1,k8s-annotation-n]" AzureMonitorMetrics.KubeStateMetrics.MetricLabelsAllowlist "namespaces=[k8s-label-1,k8s-label-n]"
Any of the commands can use the following optional parameters:
- AKS:
--ksm-metric-annotations-allow-list
Arc:--AzureMonitorMetrics.KubeStateMetrics.MetricAnnotationsAllowList
Comma-separated list of Kubernetes annotations keys used in the resource's kube_resource_annotations metric. For example, kube_pod_annotations is the annotations metric for the pods resource. By default, this metric contains only name and namespace labels. To include more annotations, provide a list of resource names in their plural form and Kubernetes annotation keys that you want to allow for them. A single*can be provided for each resource to allow any annotations, but this has severe performance implications. For example,pods=[kubernetes.io/team,...],namespaces=[kubernetes.io/team],.... - AKS:
--ksm-metric-labels-allow-list
Arc:--AzureMonitorMetrics.KubeStateMetrics.MetricLabelsAllowlist
Comma-separated list of more Kubernetes label keys that is used in the resource's kube_resource_labels metric kube_resource_labels metric. For example, kube_pod_labels is the labels metric for the pods resource. By default this metric contains only name and namespace labels. To include more labels, provide a list of resource names in their plural form and Kubernetes label keys that you want to allow for them A single*can be provided for each resource to allow any labels, but i this has severe performance implications. For example,pods=[app],namespaces=[k8s-label-1,k8s-label-n,...],.... - AKS:
--enable-windows-recording-rulesLets you enable the recording rule groups required for proper functioning of the Windows dashboards.
Enable Container insights
Use one of the following methods to enable Container insights on your cluster. Once this is complete, see Configure agent data collection for Container insights to customize your configuration to ensure that you aren't collecting more data than you require.
Use one of the following commands to enable monitoring of your AKS and Arc-enabled clusters. If you don't specify an existing Log Analytics workspace, the default workspace for the resource group will be used. If a default workspace doesn't already exist in the cluster's region, one will be created with a name in the format DefaultWorkspace-<GUID>-<Region>.
Prerequisites
- Azure CLI version 2.43.0 or higher
- Managed identity authentication is default in CLI version 2.49.0 or higher.
- Azure k8s-extension version 1.3.7 or higher
- Managed identity authentication is the default in k8s-extension version 1.43.0 or higher.
- Managed identity authentication is not supported for Arc-enabled Kubernetes clusters with ARO (Azure Red Hat Openshift) or Windows nodes. Use legacy authentication.
- For CLI version 2.54.0 or higher, the logging schema will be configured to ContainerLogV2 using ConfigMap.
Note
You can enable the ContainerLogV2 schema for a cluster either using the cluster's Data Collection Rule (DCR) or ConfigMap. If both settings are enabled, the ConfigMap will take precedence. Stdout and stderr logs will only be ingested to the ContainerLog table when both the DCR and ConfigMap are explicitly set to off.
AKS cluster
### Use default Log Analytics workspace
az aks enable-addons --addon monitoring --name <cluster-name> --resource-group <cluster-resource-group-name>

### Use existing Log Analytics workspace
az aks enable-addons --addon monitoring --name <cluster-name> --resource-group <cluster-resource-group-name> --workspace-resource-id <workspace-resource-id>
Example
az aks enable-addons --addon monitoring --name "my-cluster" --resource-group "my-resource-group" --workspace-resource-id "/subscriptions/my-subscription/resourceGroups/my-resource-group/providers/Microsoft.OperationalInsights/workspaces/my-workspace"
Arc-enabled cluster
### Use default Log Analytics workspace
az k8s-extension create --name azuremonitor-containers --cluster-name <cluster-name> --resource-group <resource-group> --cluster-type connectedClusters --extension-type Microsoft.AzureMonitor.Containers

### Use existing Log Analytics workspace
az k8s-extension create --name azuremonitor-containers --cluster-name <cluster-name> --resource-group <resource-group> --cluster-type connectedClusters --extension-type Microsoft.AzureMonitor.Containers --configuration-settings logAnalyticsWorkspaceResourceID=<workspace-resource-id>

### Use managed identity authentication (default as k8s-extension version 1.43.0)
az k8s-extension create --name azuremonitor-containers --cluster-name <cluster-name> --resource-group <resource-group> --cluster-type connectedClusters --extension-type Microsoft.AzureMonitor.Containers --configuration-settings amalogs.useAADAuth=true

### Use advanced configuration settings
az k8s-extension create --name azuremonitor-containers --cluster-name <cluster-name> --resource-group <resource-group> --cluster-type connectedClusters --extension-type Microsoft.AzureMonitor.Containers --configuration-settings  amalogs.resources.daemonset.limits.cpu=150m amalogs.resources.daemonset.limits.memory=600Mi amalogs.resources.deployment.limits.cpu=1 amalogs.resources.deployment.limits.memory=750Mi

### With custom mount path for container stdout & stderr logs
### Custom mount path not required for Azure Stack Edge version > 2318. Custom mount path must be /home/data/docker for Azure Stack Edge cluster with version <= 2318
az k8s-extension create --name azuremonitor-containers --cluster-name <cluster-name> --resource-group <resource-group> --cluster-type connectedClusters --extension-type Microsoft.AzureMonitor.Containers --configuration-settings amalogs.logsettings.custommountpath=<customMountPath>
See the resource requests and limits section of Helm chart for the available configuration settings.
Example
az k8s-extension create --name azuremonitor-containers --cluster-name "my-cluster" --resource-group "my-resource-group" --cluster-type connectedClusters --extension-type Microsoft.AzureMonitor.Containers --configuration-settings logAnalyticsWorkspaceResourceID="/subscriptions/my-subscription/resourceGroups/my-resource-group/providers/Microsoft.OperationalInsights/workspaces/my-workspace"
Arc-enabled cluster with forward proxy
If the cluster is configured with a forward proxy, then proxy settings are automatically applied to the extension. In the case of a cluster with AMPLS + proxy, proxy config should be ignored. Onboard the extension with the configuration setting amalogs.ignoreExtensionProxySettings=true.
az k8s-extension create --name azuremonitor-containers --cluster-name <cluster-name> --resource-group <resource-group> --cluster-type connectedClusters --extension-type Microsoft.AzureMonitor.Containers --configuration-settings amalogs.ignoreExtensionProxySettings=true
Arc-enabled cluster with ARO or OpenShift or Windows nodes
Managed identity authentication is not supported for Arc-enabled Kubernetes clusters with ARO (Azure Red Hat OpenShift) or OpenShift or Windows nodes. Use legacy authentication by specifying amalogs.useAADAuth=false as in the following example.
az k8s-extension create --name azuremonitor-containers --cluster-name <cluster-name> --resource-group <resource-group> --cluster-type connectedClusters --extension-type Microsoft.AzureMonitor.Containers --configuration-settings amalogs.useAADAuth=false
Delete extension instance
The following command only deletes the extension instance, but doesn't delete the Log Analytics workspace. The data in the Log Analytics resource is left intact.
az k8s-extension delete --name azuremonitor-containers --cluster-type connectedClusters --cluster-name <cluster-name> --resource-group <resource-group>
Enable full monitoring with Azure portal
Using the Azure portal, you can enable both Managed Prometheus and Container insights at the same time.
Note
If you want to enabled Managed Prometheus without Container insights, then enable it from the Azure Monitor workspace as described below.
New AKS cluster (Prometheus and Container insights)
When you create a new AKS cluster in the Azure portal, you can enable Prometheus, Container insights, and Grafana from the Integrations tab. In the Azure Monitor section, select either Default configuration or Custom configuration if you want to specify which workspaces to use. You can perform additional configuration once the cluster is created.

Existing cluster (Prometheus and Container insights)
This option enables Container insights and optionally Prometheus and Grafana on an existing AKS cluster.
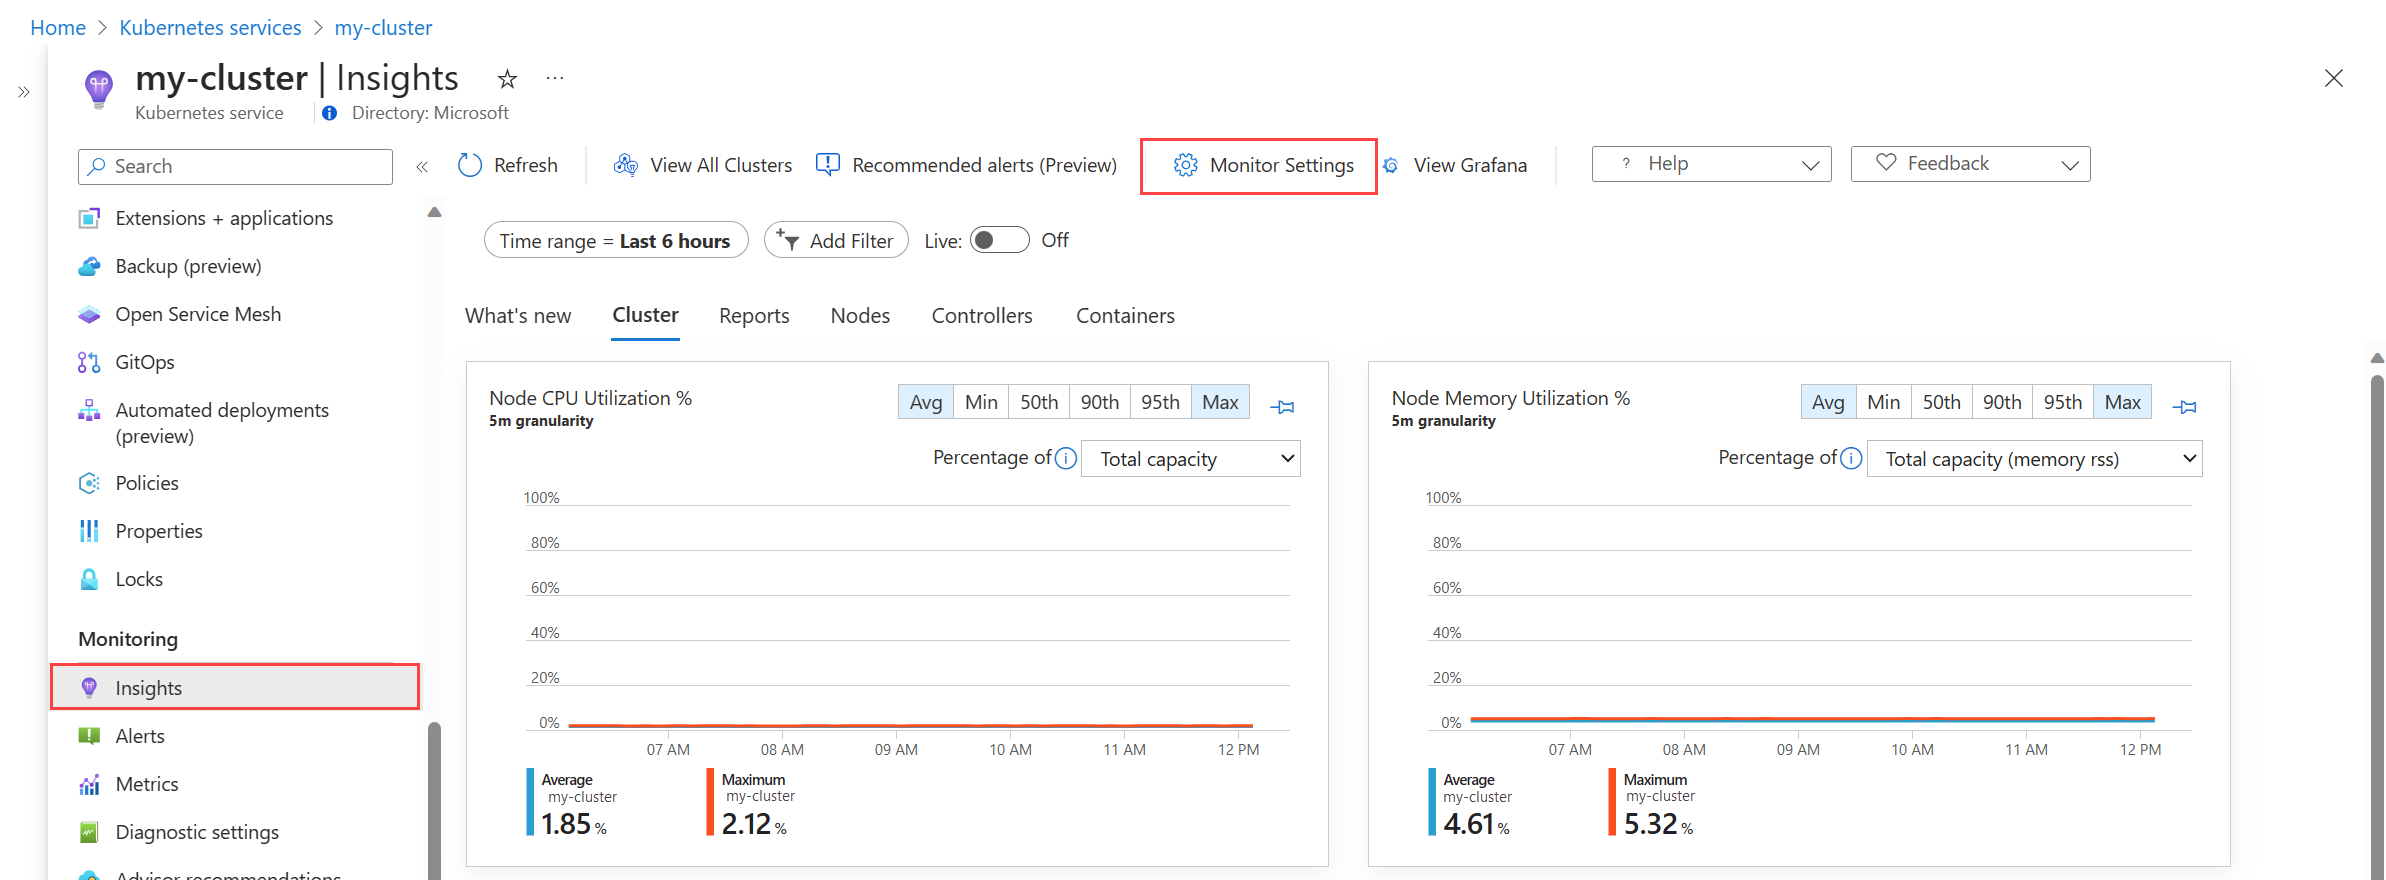
Either select Insights from the cluster's menu OR select Containers from the Monitor menu, Unmonitored clusters tab, and click Enable next to a cluster.
- If Container insights isn't enabled for the cluster, then you're presented with a screen identifying which of the features have been enabled. Click Configure monitoring.

- If Container insights has already been enabled on the cluster, select the Monitoring Settings button to modify the configuration.
Container insights will be enabled. Select the checkboxes for Enable Prometheus metrics and Enable Grafana if you also want to enable them for the cluster. If you have existing Azure Monitor workspace and Grafana workspace, then they're selected for you.
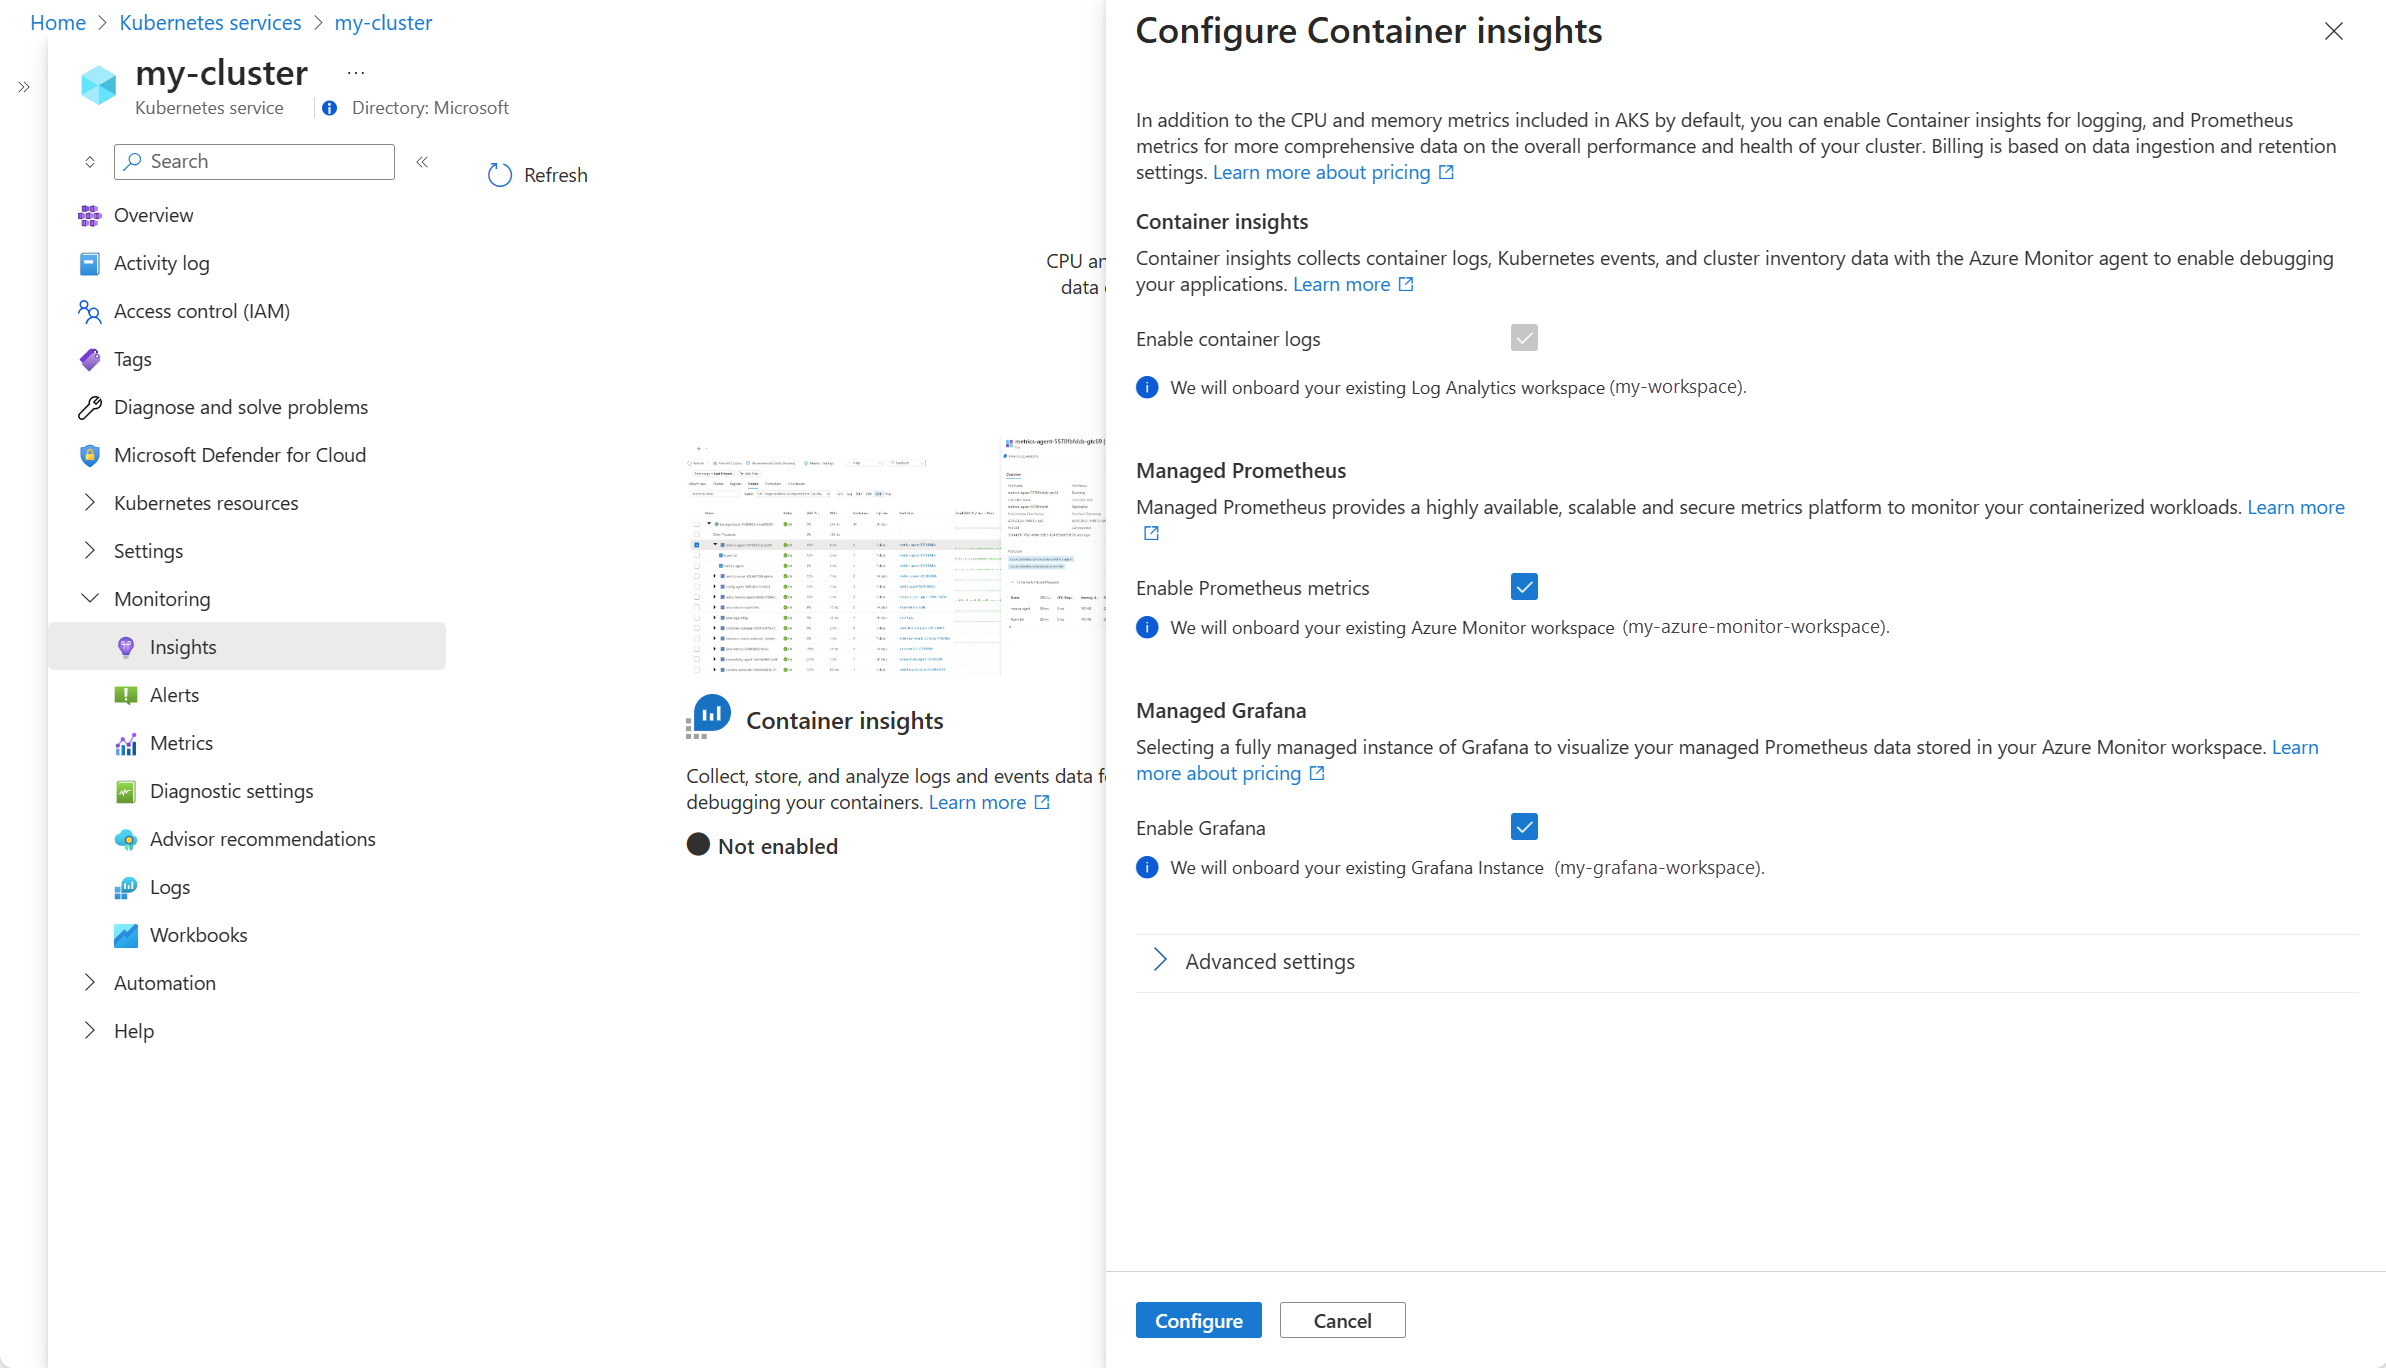
Click Advanced settings to select alternate workspaces or create new ones. The Cost presets setting allows you to modify the default collection details to reduce your monitoring costs. See Enable cost optimization settings in Container insights for details.
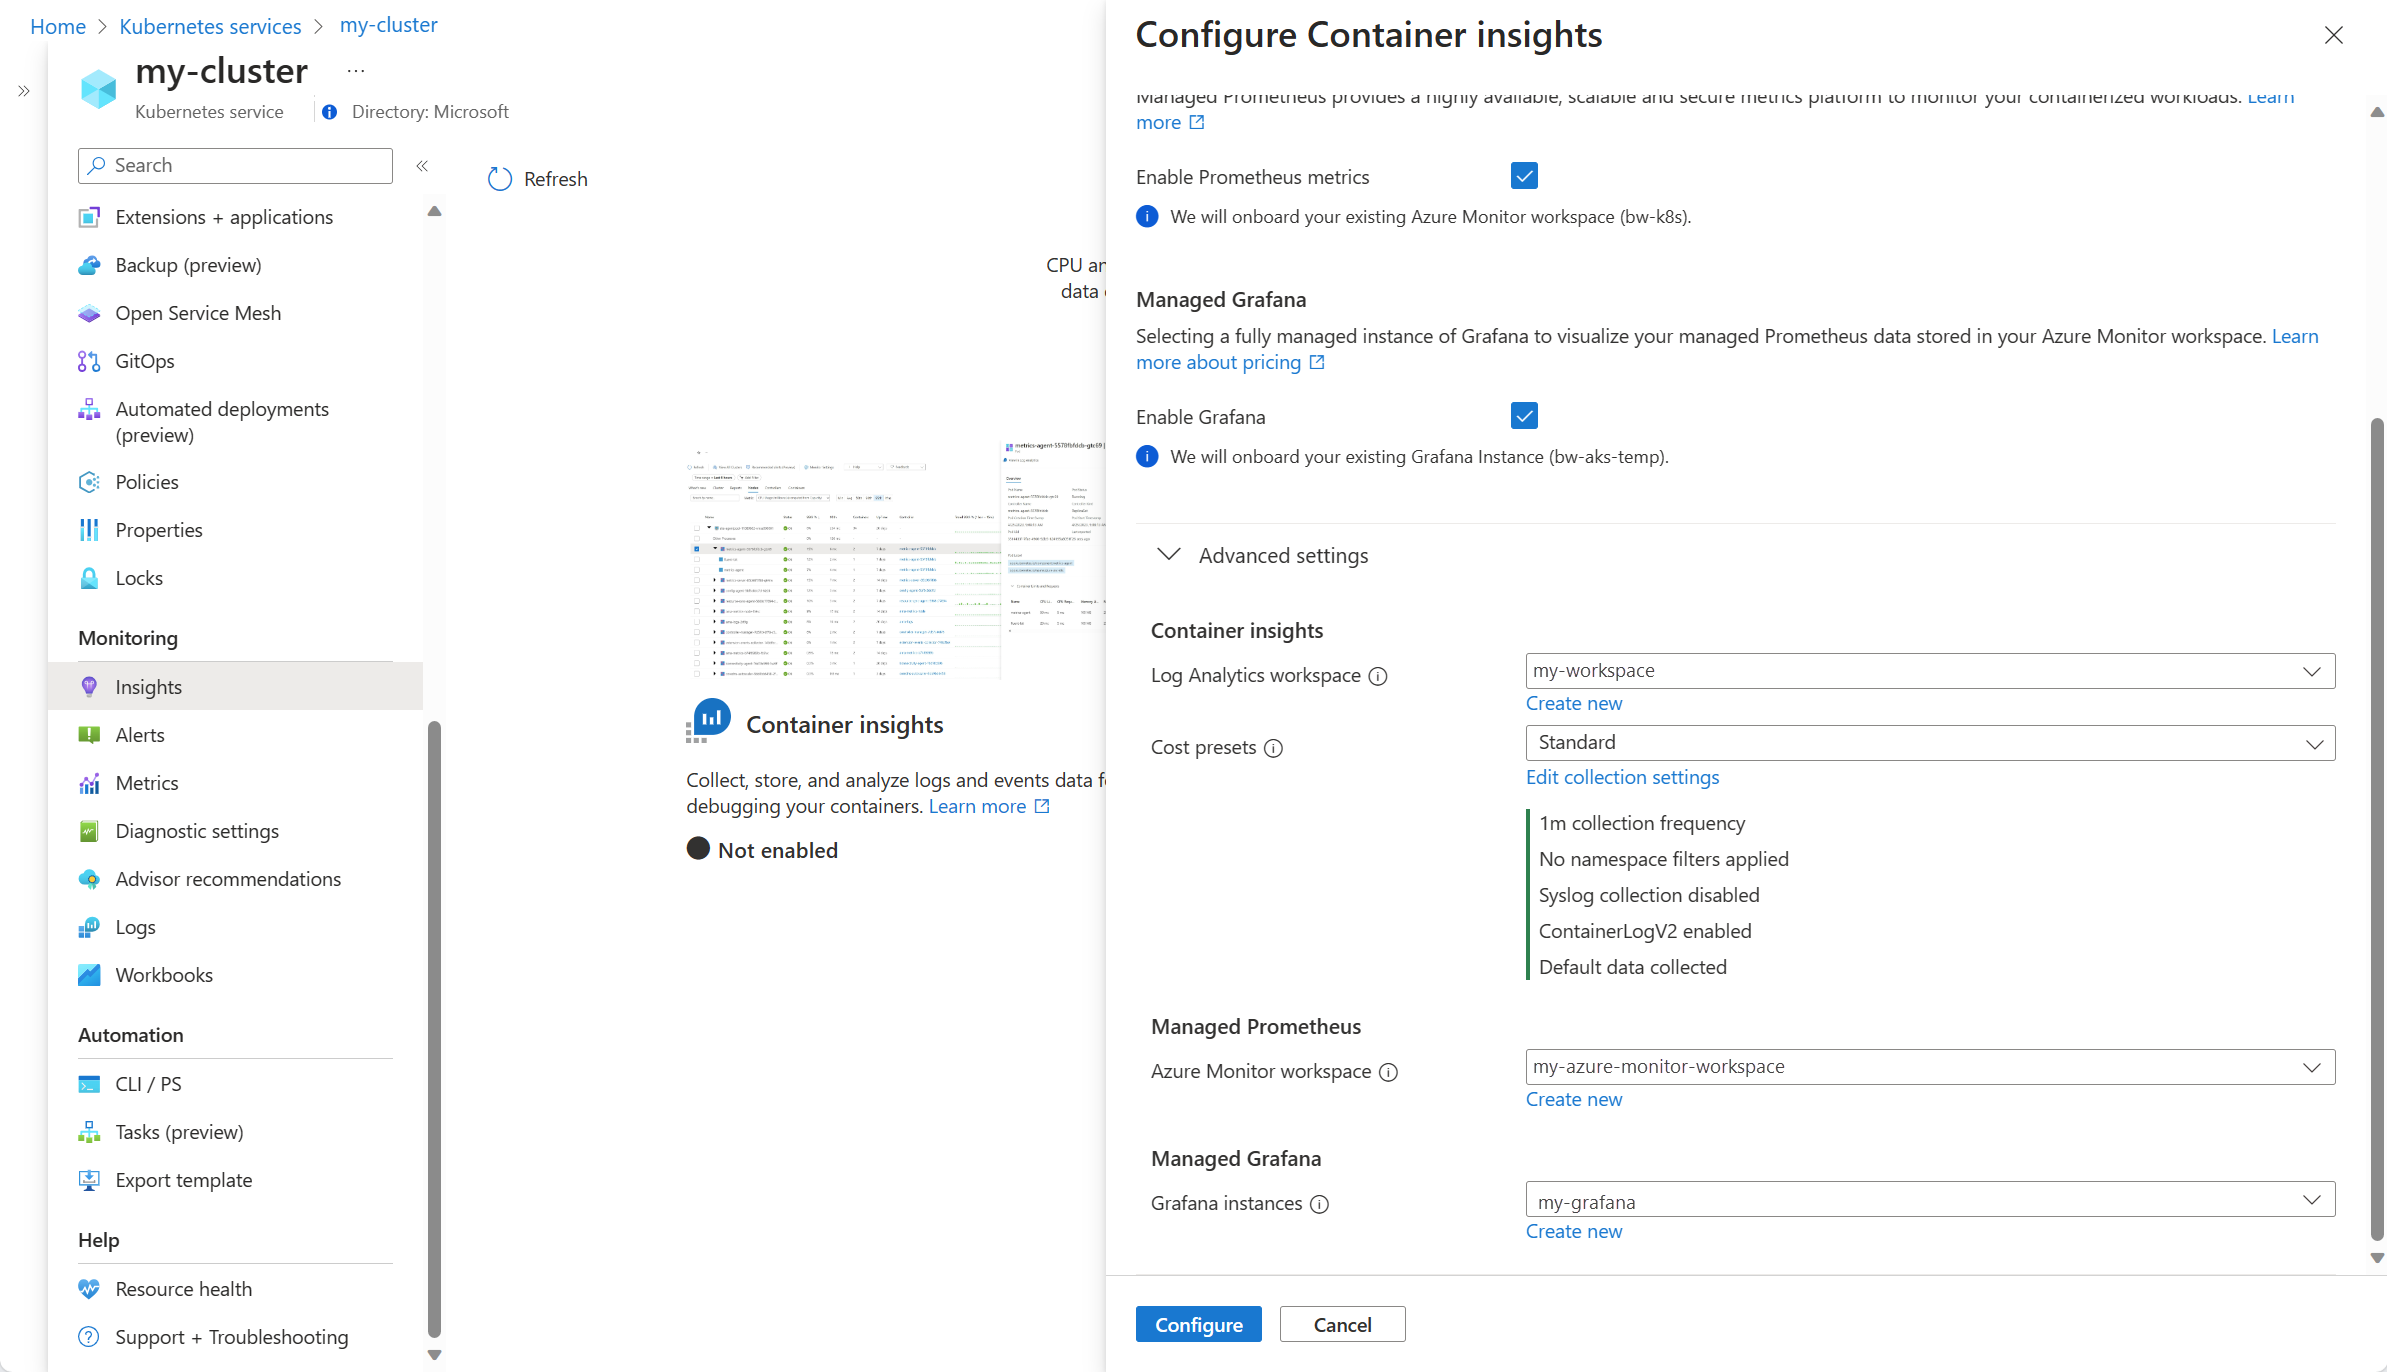
Click Configure to save the configuration.


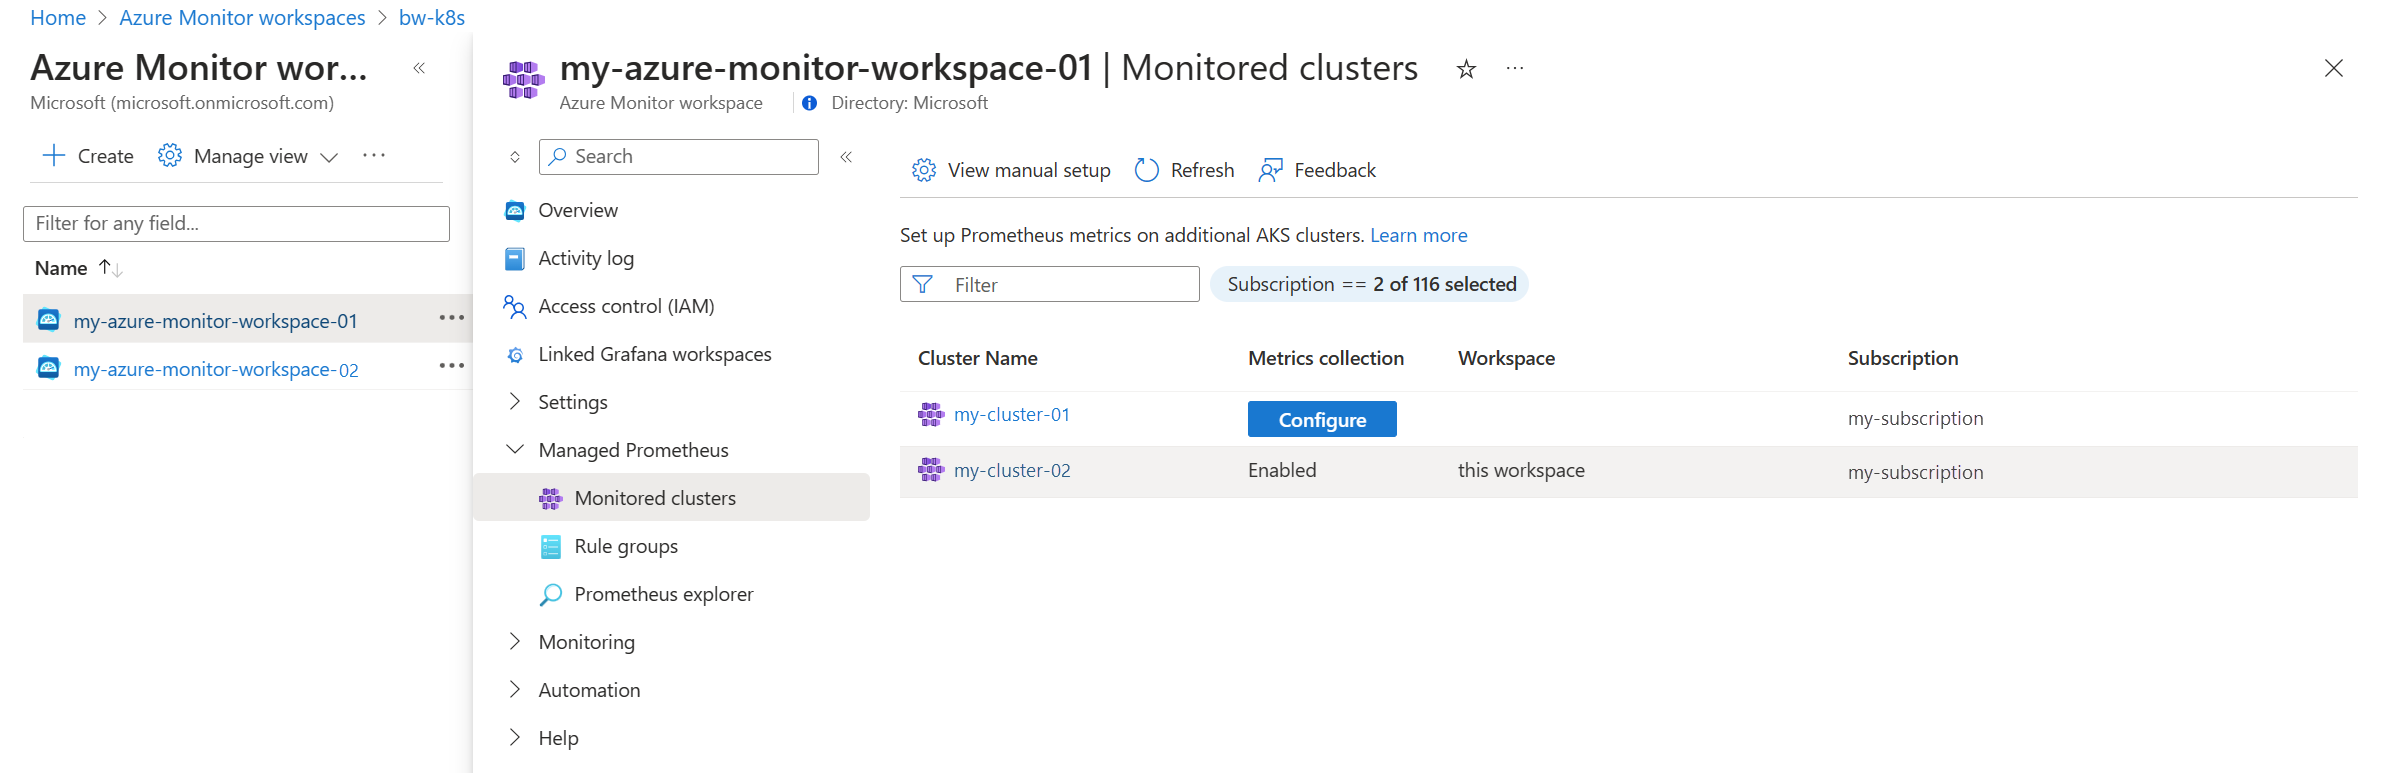
Existing cluster (Prometheus only)
This option enables Prometheus metrics on a cluster without enabling Container insights.
Open the Azure Monitor workspaces menu in the Azure portal and select your workspace.
Select Monitored clusters in the Managed Prometheus section to display a list of AKS clusters.
Select Configure next to the cluster you want to enable.

Existing cluster (Add Prometheus)
- Select Containers from the Monitor menu, Monitored clusters tab, and click Configure next to a cluster in the Managed Prometheus column.
Enable Windows metrics collection (preview)
Note
There is no CPU/Memory limit in windows-exporter-daemonset.yaml so it may over-provision the Windows nodes
For more details see Resource reservation
As you deploy workloads, set resource memory and CPU limits on containers. This also subtracts from NodeAllocatable and helps the cluster-wide scheduler in determining which pods to place on which nodes. Scheduling pods without limits may over-provision the Windows nodes and in extreme cases can cause the nodes to become unhealthy.
As of version 6.4.0-main-02-22-2023-3ee44b9e of the Managed Prometheus addon container (prometheus_collector), Windows metric collection has been enabled for the AKS clusters. Onboarding to the Azure Monitor Metrics add-on enables the Windows DaemonSet pods to start running on your node pools. Both Windows Server 2019 and Windows Server 2022 are supported. Follow these steps to enable the pods to collect metrics from your Windows node pools.
Manually install windows-exporter on AKS nodes to access Windows metrics by deploying the windows-exporter-daemonset YAML file. Enable the following collectors:
[defaults]containermemoryprocesscpu_info
For more collectors, please see Prometheus exporter for Windows metrics.
Deploy the windows-exporter-daemonset YAML file. Note that if there are any taints applied in the node, you will need to apply the appropriate tolerations.
kubectl apply -f windows-exporter-daemonset.yamlApply the ama-metrics-settings-configmap to your cluster. Set the
windowsexporterandwindowskubeproxyBooleans totrue. For more information, see Metrics add-on settings configmap.Enable the recording rules that are required for the out-of-the-box dashboards:
- If onboarding using the CLI, include the option
--enable-windows-recording-rules. - If onboarding using an ARM template, Bicep, or Azure Policy, set
enableWindowsRecordingRulestotruein the parameters file. - If the cluster is already onboarded, use this ARM template and this parameter file to create the rule groups. This will add the required recording rules and is not an ARM operation on the cluster and does not impact current monitoring state of the cluster.
- If onboarding using the CLI, include the option
Verify deployment
Use the kubectl command line tool to verify that the agent is deployed properly.
Managed Prometheus
Verify that the DaemonSet was deployed properly on the Linux node pools
kubectl get ds ama-metrics-node --namespace=kube-system
The number of pods should be equal to the number of Linux nodes on the cluster. The output should resemble the following example:
User@aksuser:~$ kubectl get ds ama-metrics-node --namespace=kube-system
NAME               DESIRED   CURRENT   READY   UP-TO-DATE   AVAILABLE   NODE SELECTOR   AGE
ama-metrics-node   1         1         1       1            1           <none>          10h
Verify that Windows nodes were deployed properly
kubectl get ds ama-metrics-win-node --namespace=kube-system
The number of pods should be equal to the number of Windows nodes on the cluster. The output should resemble the following example:
User@aksuser:~$ kubectl get ds ama-metrics-node --namespace=kube-system
NAME                   DESIRED   CURRENT   READY   UP-TO-DATE   AVAILABLE   NODE SELECTOR   AGE
ama-metrics-win-node   3         3         3       3            3           <none>          10h
Verify that the two ReplicaSets were deployed for Prometheus
kubectl get rs --namespace=kube-system
The output should resemble the following example:
User@aksuser:~$kubectl get rs --namespace=kube-system
NAME                            DESIRED   CURRENT   READY   AGE
ama-metrics-5c974985b8          1         1         1       11h
ama-metrics-ksm-5fcf8dffcd      1         1         1       11h
Container insights
Verify that the DaemonSets were deployed properly on the Linux node pools
kubectl get ds ama-logs --namespace=kube-system
The number of pods should be equal to the number of Linux nodes on the cluster. The output should resemble the following example:
User@aksuser:~$ kubectl get ds ama-logs --namespace=kube-system
NAME       DESIRED   CURRENT   READY     UP-TO-DATE   AVAILABLE   NODE SELECTOR   AGE
ama-logs   2         2         2         2            2           <none>          1d
Verify that Windows nodes were deployed properly
kubectl get ds ama-logs-windows --namespace=kube-system
The number of pods should be equal to the number of Windows nodes on the cluster. The output should resemble the following example:
User@aksuser:~$ kubectl get ds ama-logs-windows --namespace=kube-system
NAME                   DESIRED   CURRENT   READY     UP-TO-DATE   AVAILABLE   NODE SELECTOR     AGE
ama-logs-windows           2         2         2         2            2       <none>            1d
Verify deployment of the Container insights solution
kubectl get deployment ama-logs-rs --namespace=kube-system
The output should resemble the following example:
User@aksuser:~$ kubectl get deployment ama-logs-rs --namespace=kube-system
NAME          READY   UP-TO-DATE   AVAILABLE   AGE
ama-logs-rs   1/1     1            1           24d
View configuration with CLI
Use the aks show command to find out whether the solution is enabled, the Log Analytics workspace resource ID, and summary information about the cluster.
az aks show --resource-group <resourceGroupofAKSCluster> --name <nameofAksCluster>
The command will return JSON-formatted information about the solution. The addonProfiles section should include information on the omsagent as in the following example:
"addonProfiles": {
    "omsagent": {
        "config": {
            "logAnalyticsWorkspaceResourceID": "/subscriptions/00000000-0000-0000-0000-000000000000/resourcegroups/my-resource-group/providers/microsoft.operationalinsights/workspaces/my-workspace",
            "useAADAuth": "true"
        },
        "enabled": true,
        "identity": null
    },
}
Resources provisioned
When you enable monitoring, the following resources are created in your subscription:
| Resource Name | Resource Type | Resource Group | Region/Location | Description |
|---|---|---|---|---|
MSCI-<aksclusterregion>-<clustername> |
Data Collection Rule | Same as cluster | Same as Log Analytics workspace | This data collection rule is for log collection by Azure Monitor agent, which uses the Log Analytics workspace as destination, and is associated to the AKS cluster resource. |
MSPROM-<aksclusterregion>-<clustername> |
Data Collection Rule | Same as cluster | Same as Azure Monitor workspace | This data collection rule is for prometheus metrics collection by metrics addon, which has the chosen Azure monitor workspace as destination, and also it is associated to the AKS cluster resource |
MSPROM-<aksclusterregion>-<clustername> |
Data Collection endpoint | Same as cluster | Same as Azure Monitor workspace | This data collection endpoint is used by the above data collection rule for ingesting Prometheus metrics from the metrics addon |
When you create a new Azure Monitor workspace, the following additional resources are created as part of it
| Resource Name | Resource Type | Resource Group | Region/Location | Description |
|---|---|---|---|---|
<azuremonitor-workspace-name> |
Data Collection Rule | MA_<azuremonitor-workspace-name>_<azuremonitor-workspace-region>_managed | Same as Azure Monitor Workspace | DCR created when you use OSS Prometheus server to Remote Write to Azure Monitor Workspace. |
<azuremonitor-workspace-name> |
Data Collection Endpoint | MA_<azuremonitor-workspace-name>_<azuremonitor-workspace-region>_managed | Same as Azure Monitor Workspace | DCE created when you use OSS Prometheus server to Remote Write to Azure Monitor Workspace. |
Differences between Windows and Linux clusters
The main differences in monitoring a Windows Server cluster compared to a Linux cluster include:
- Windows doesn't have a Memory RSS metric. As a result, it isn't available for Windows nodes and containers. The Working Set metric is available.
- Disk storage capacity information isn't available for Windows nodes.
- Only pod environments are monitored, not Docker environments.
- With the preview release, a maximum of 30 Windows Server containers are supported. This limitation doesn't apply to Linux containers.
Note
Container insights support for the Windows Server 2022 operating system is in preview.
The containerized Linux agent (replicaset pod) makes API calls to all the Windows nodes on Kubelet secure port (10250) within the cluster to collect node and container performance-related metrics. Kubelet secure port (:10250) should be opened in the cluster's virtual network for both inbound and outbound for Windows node and container performance-related metrics collection to work.
If you have a Kubernetes cluster with Windows nodes, review and configure the network security group and network policies to make sure the Kubelet secure port (:10250) is open for both inbound and outbound in the cluster's virtual network.
Next steps
- If you experience issues while you attempt to onboard the solution, review the Troubleshooting guide.
- With monitoring enabled to collect health and resource utilization of your AKS cluster and workloads running on them, learn how to use Container insights.
Feedback
Coming soon: Throughout 2024 we will be phasing out GitHub Issues as the feedback mechanism for content and replacing it with a new feedback system. For more information see: https://aka.ms/ContentUserFeedback.
Submit and view feedback for