Note
Access to this page requires authorization. You can try signing in or changing directories.
Access to this page requires authorization. You can try changing directories.
Create dashboards powered by Azure Monitor managed service for Prometheus by using Azure workbooks. This article introduces workbooks for Azure Monitor workspaces and shows you how to query Prometheus metrics by using Azure workbooks and Prometheus Query Language (PromQL).
You can also query Prometheus metrics by using PromQL from the metrics explorer in an Azure Monitor workspace. For more information, see Azure Monitor metrics explorer with PromQL (preview).
Prerequisites
To query Prometheus metrics from an Azure Monitor workspace:
- You need an Azure Monitor workspace. For more information, see Create an Azure Monitor workspace.
- Your Azure Monitor workspace must be collecting Prometheus metrics from an Azure Kubernetes Service (AKS) cluster or from a virtual machine or virtual machine scale set. For more information, see Send Prometheus metrics from virtual machines, scale sets, or Kubernetes clusters to an Azure Monitor workspace.
- The user must be assigned a role that can perform the
microsoft.monitor/accounts/readoperation on the Azure Monitor workspace.
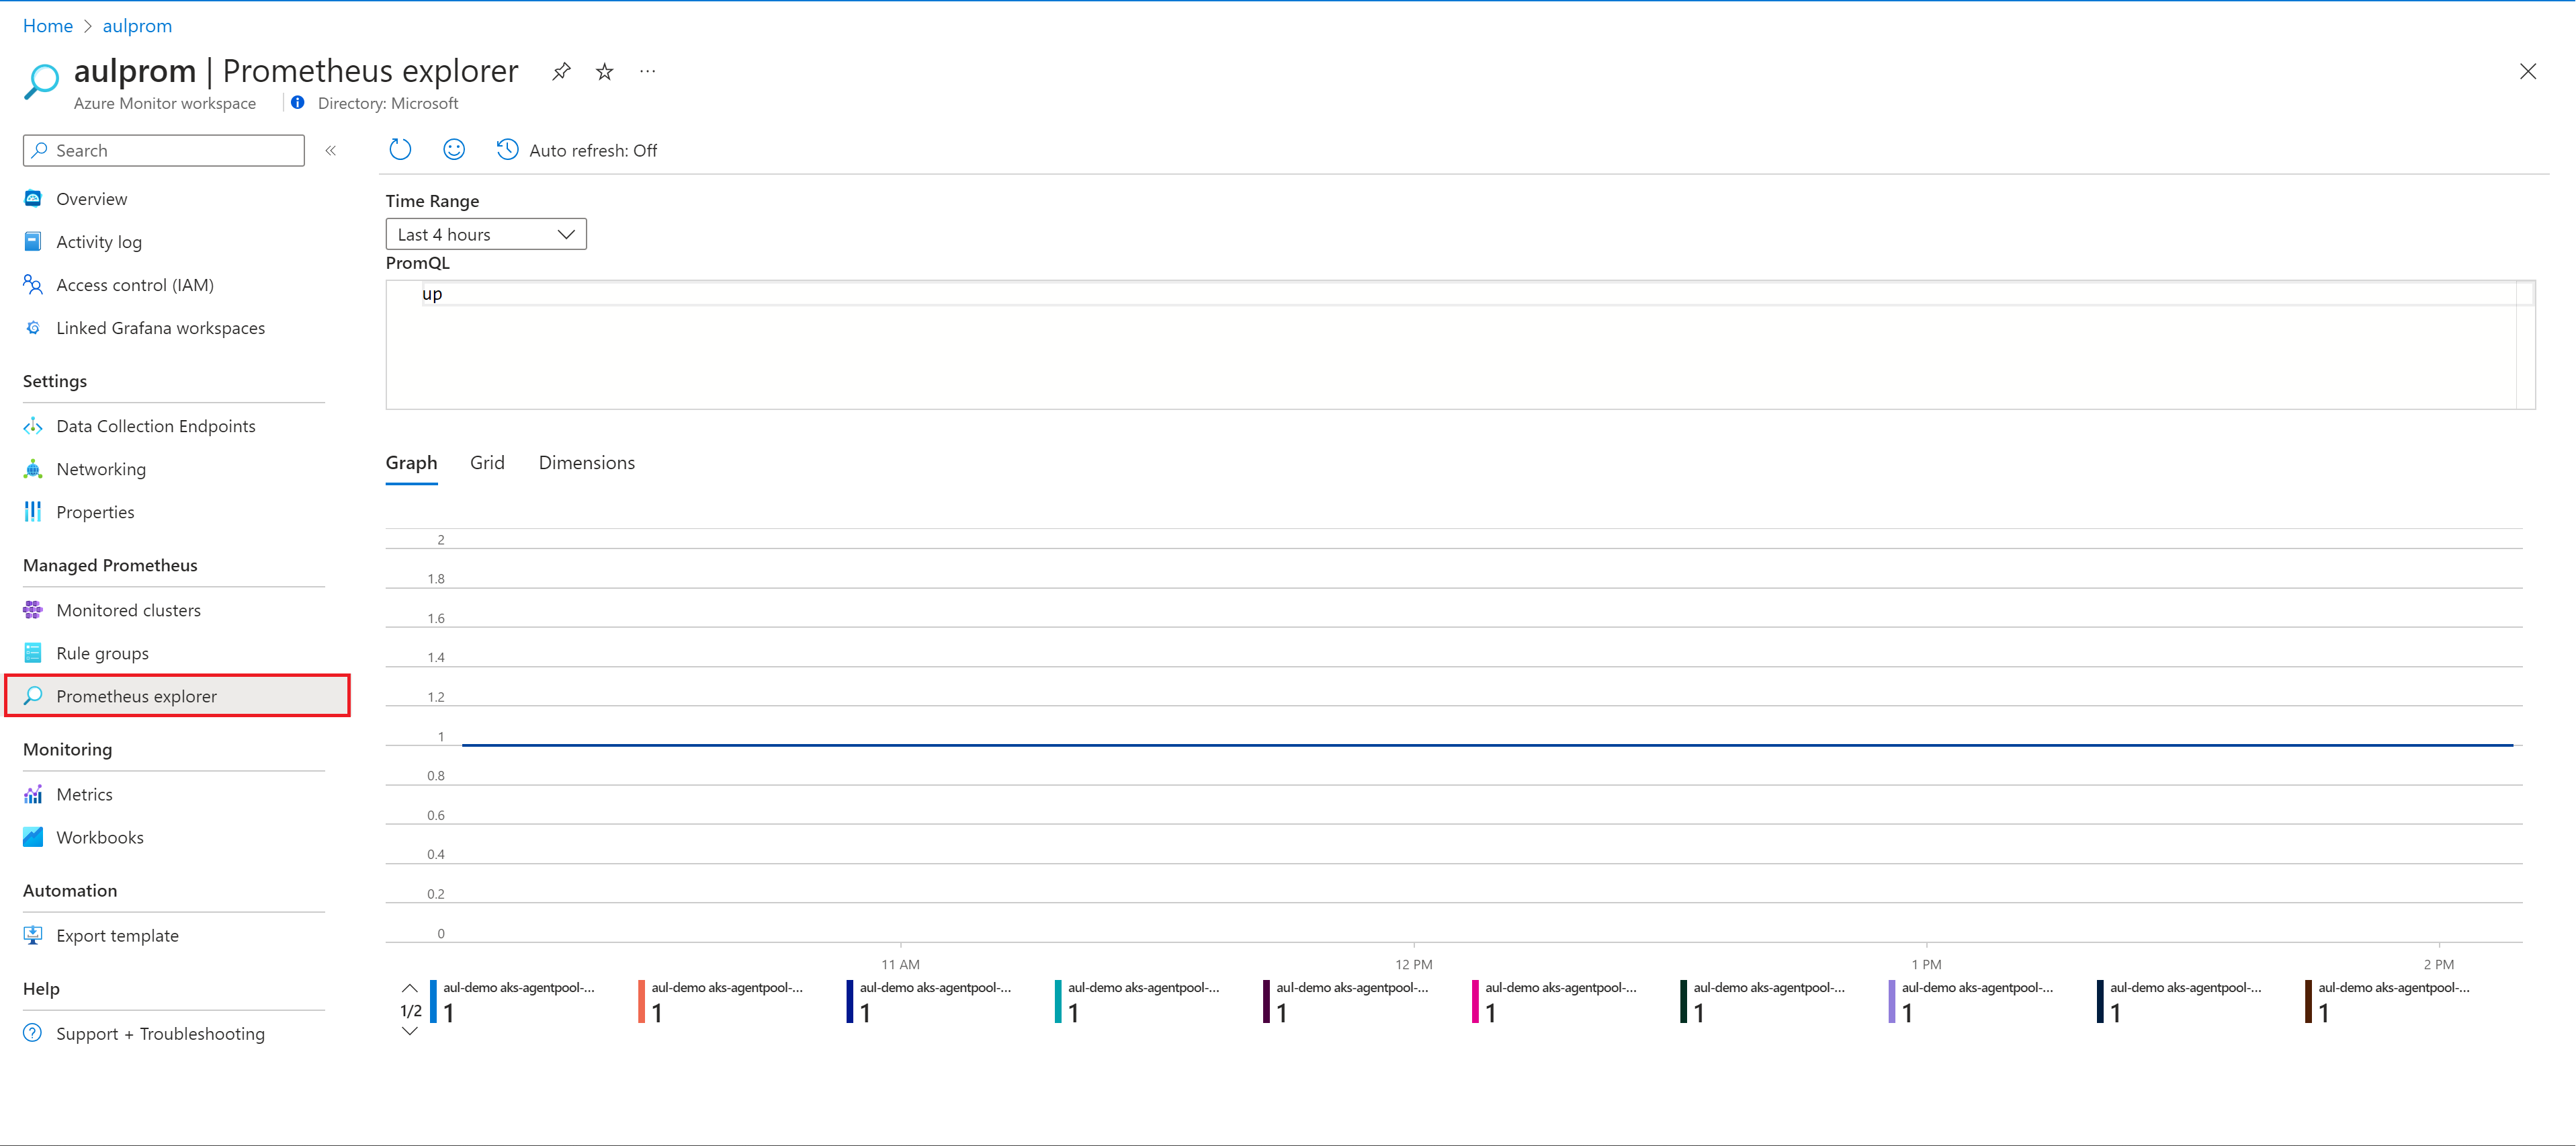
Prometheus explorer workbook
Azure Monitor workspaces include an exploration workbook to query your Prometheus metrics.
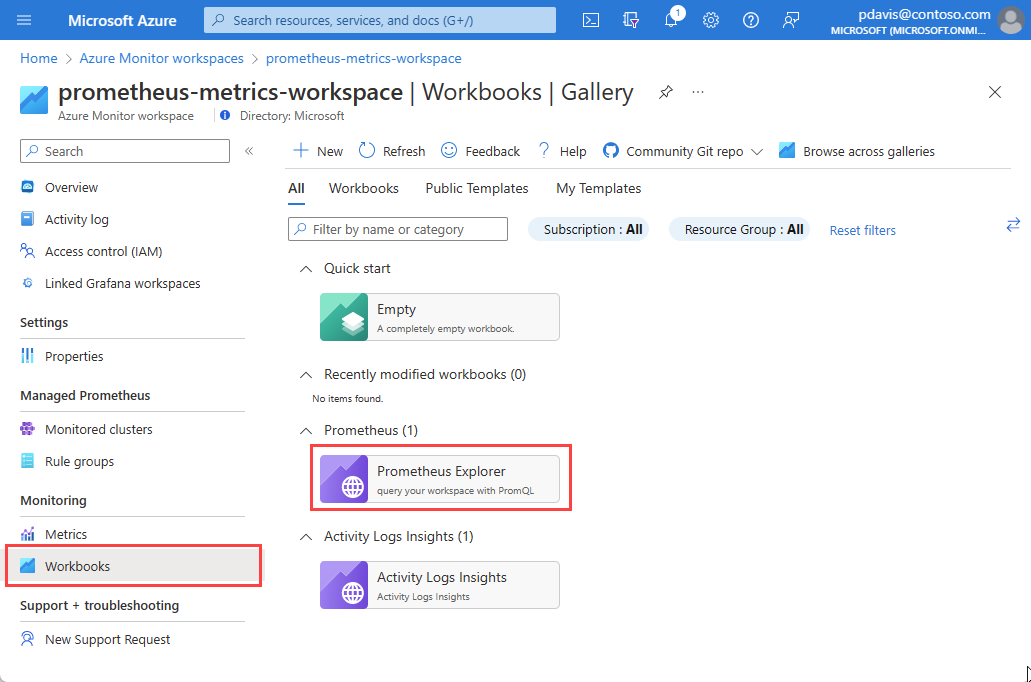
On the Overview page for the Azure Monitor workspace, select Prometheus explorer.
On the Workbooks menu item, and in the Azure Monitor workspace gallery, select the Prometheus Explorer workbook tile.
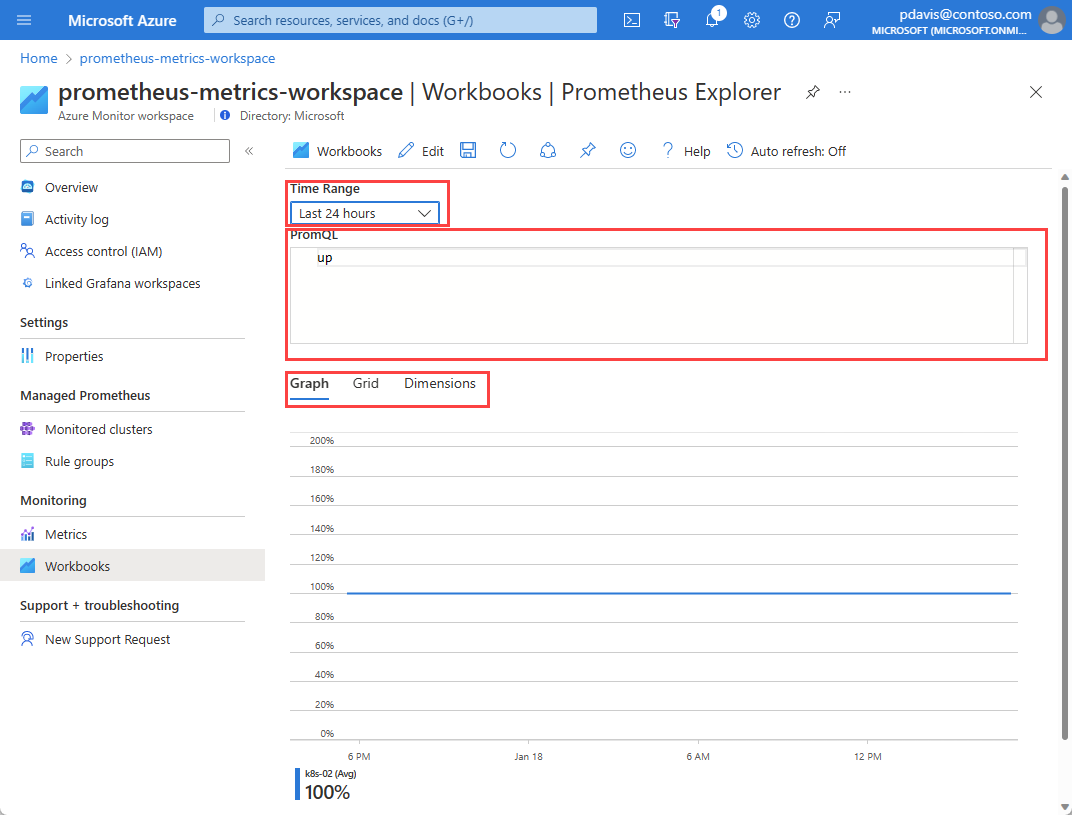
A workbook has the following input options:
- Time Range: Select the period of time that you want to include in your query. Select Custom to set a start and end time.
- PromQL: Enter the PromQL query to retrieve your data. For more information about PromQL, see Query Prometheus.
- Graph, Grid, Dimensions: Use the tabs to switch between a graphic, tabular, and dimensional view of the query output.


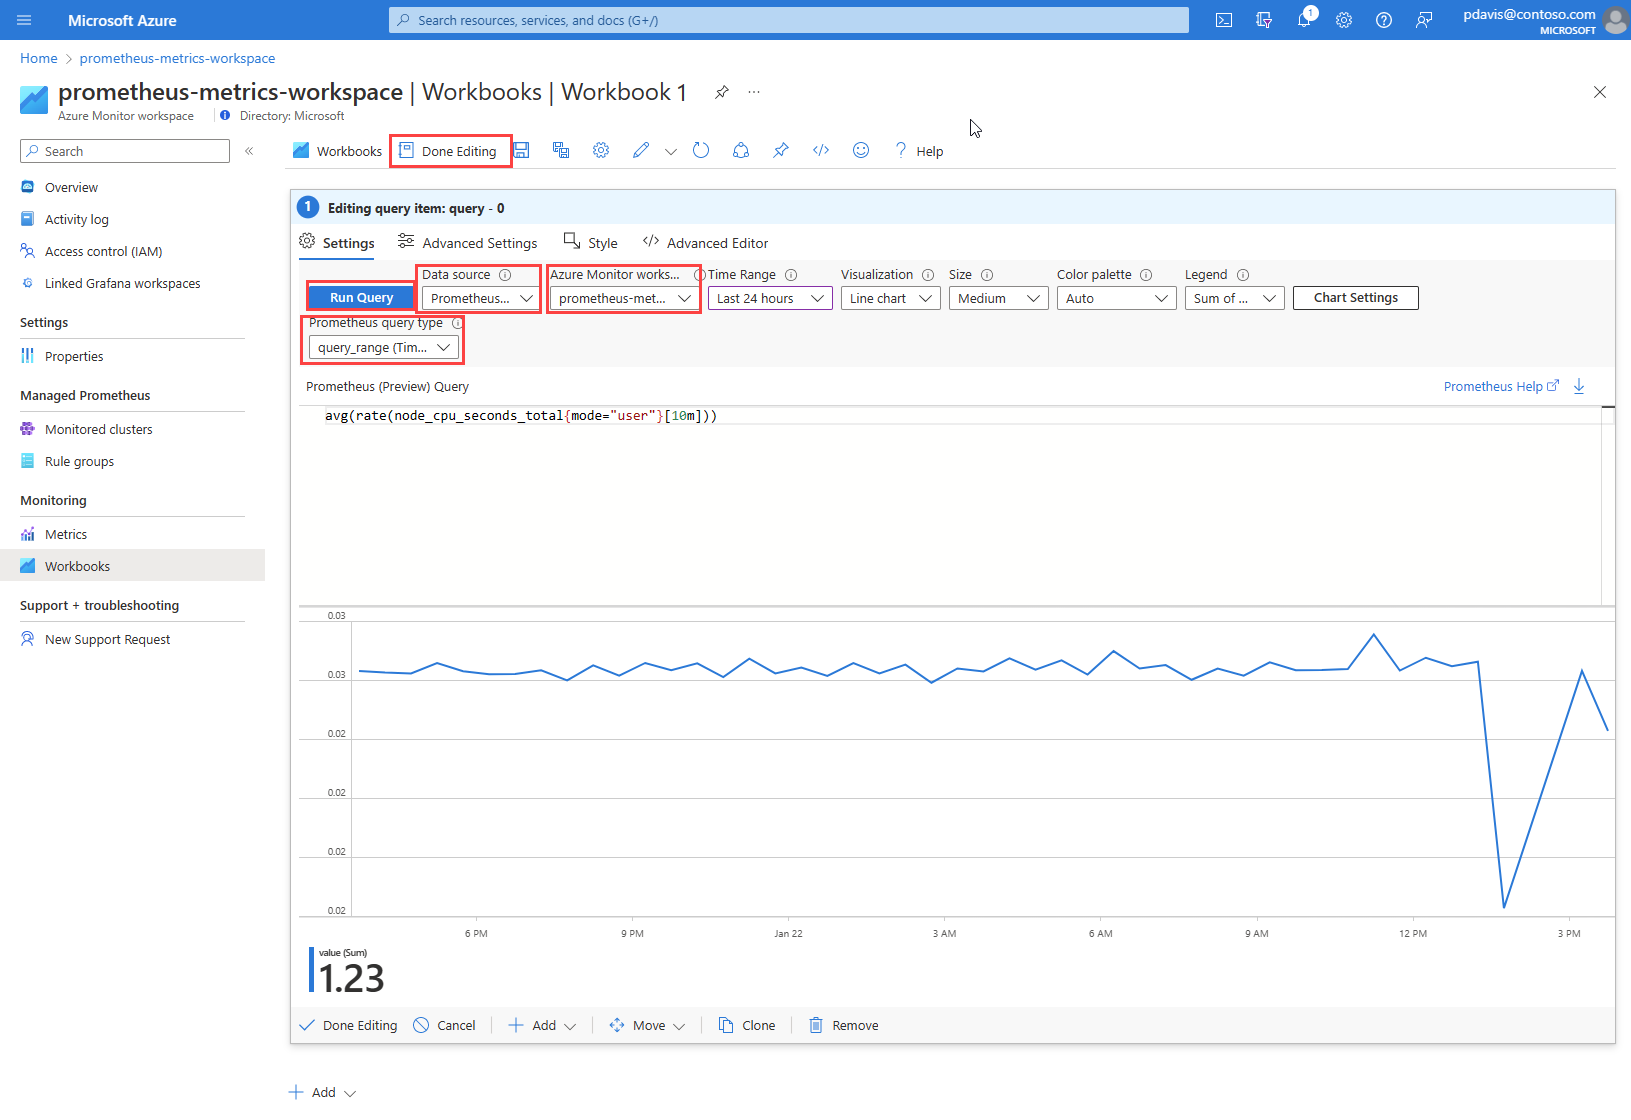
Create a Prometheus workbook
Workbooks support many visualizations and Azure integrations. For more information about Azure workbooks, see Create an Azure workbook.
From your Azure Monitor workspace, select Workbooks.
Select New.
In the new workbook, select Add, and then select Add query from the dropdown list.
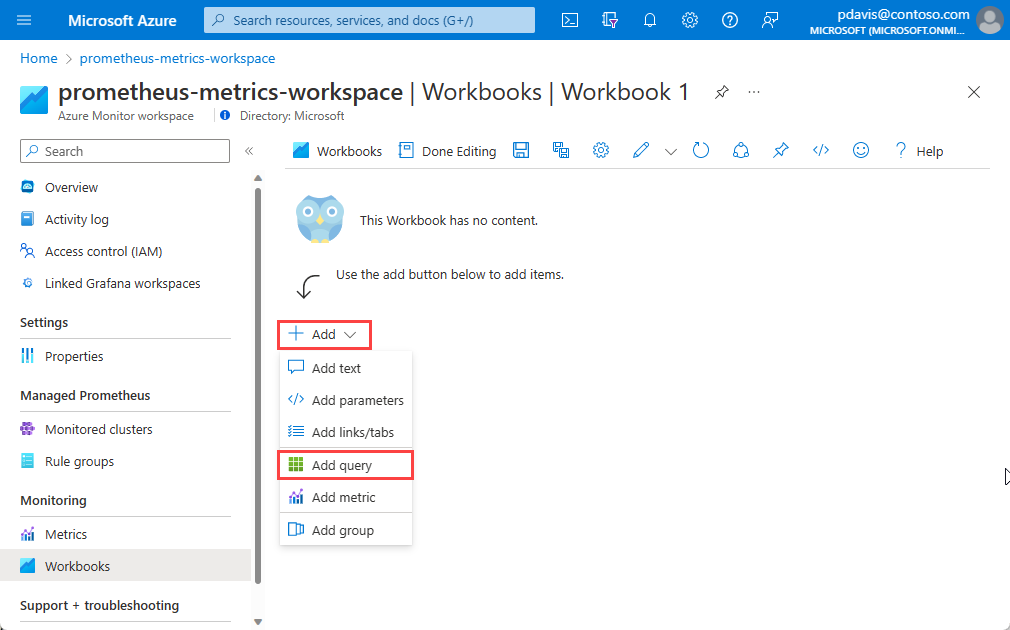
Azure workbooks use data sources to set the source scope for the data they present. To query Prometheus metrics, select the Data source dropdown list and choose Prometheus .
From the Azure Monitor workspace dropdown list, select your workspace.
From the Prometheus query type dropdown list, select your query type.
Enter your PromQL query in the Prometheus (Preview) Query field.
Select Run Query.
Select Done Editing and save your work.


Troubleshooting
If you receive the message "You currently do not have any Prometheus data ingested to this Azure Monitor workspace," then:
- Verify that you turned on metrics collection on the Monitored clusters pane of your Azure Monitor workspace.
If your workbook query doesn't return data and returns with the message "You do not have query access," then:
- Check that you have sufficient permissions to perform
microsoft.monitor/accounts/readassigned through the Access control (IAM) option in your Azure Monitor workspace. - Confirm if your Networking settings support query access. You might need to enable private access through your private endpoint or change settings to allow public access.
- Check if you have an ad blocker enabled in your browser. If you do, you might need to pause or disable and then refresh the workbook to view data.
Frequently asked questions
This section provides answers to common questions.
I'm missing all or some of my metrics. How can I troubleshoot?
Use the Troubleshooting guide to learn how to ingest Prometheus metrics from the managed agent.
Why am I missing metrics that have two labels with the same name but different casing?
Azure Managed Prometheus is a case-insensitive system. It treats strings, such as metric names, label names, or label values, as the same time series if they differ from another time series only by the case of the string. For more information, see Prometheus metrics overview.
I see some gaps in metric data. Why is this behavior occurring?
During node updates, you might see a one-minute to two-minute gap in metric data for metrics collected from our cluster-level collectors. This gap occurs because the node that the data runs on is being updated as part of a normal update process. This update process affects cluster-wide targets such as kube-state-metrics and custom application targets that are specified. This process occurs when your cluster is updated manually or via automatic update.
This behavior is expected and doesn't affect any of our recommended alert rules.
Related content
- Collect Prometheus metrics from an AKS cluster
- Send Prometheus metrics from virtual machines, scale sets, or Kubernetes clusters to an Azure Monitor workspace
- Azure Monitor metrics explorer with PromQL (preview)
- Azure Monitor workspace
- Use Azure Monitor managed service for Prometheus as a data source for Grafana by using managed system identity