Note
Access to this page requires authorization. You can try signing in or changing directories.
Access to this page requires authorization. You can try changing directories.
Azure NetApp Files provides metrics on allocated storage, actual storage usage, volume I/OPS, and latency. By analyzing these metrics, you can gain a better understanding on the usage pattern and volume performance of your NetApp accounts.
Definitions
Understanding the terminology related to performance and capacity in Azure NetApp Files is essential to understanding the metrics available:
- Capacity pool: A capacity pool is how capacity is billed in Azure NetApp Files. Capacity pools contain one or more volumes.
- Volume quota: The amount of capacity provisioned to an Azure NetApp Files volume. For Auto QoS volumes, throughput is proportional to volume size. For Manual QoS, you set the throughput independently from the volume capacity. For more information, see QoS types for capacity pools.
- Throughput: The amount of data transmitted across the wire (read/write/other) between Azure NetApp Files and the client. Throughput in Azure NetApp Files is measured in bytes per second.
- Latency: Latency is the amount of time for a storage operation to complete within storage from the time it arrives to the time it's processed and is ready to be sent back to the client. Latency in Azure NetApp Files is measured in milliseconds (ms).
About storage performance operation metrics
An operation in Azure NetApp Files is defined as something that happens during a client/server conversation. For instance, when a client requests a file to be read from Azure NetApp Files, read and other operations are sent and received between the client and server.
When monitoring the Azure NetApp Files volume, read and write operations are self-explanatory. Also included in the metrics is a metric called Other IOPS, meaning any operation that isn't a read or write. The Other IOPS metric encompasses operations such as metadata, which is present alongside most read and write operations.
The following types of metadata operations are included in the Other IOPS metric:
NFSv3
NFSv3 metadata calls included in Other IOPS as covered in RFC-1813:
- Procedure 0: NULL - Do nothing
- Procedure 1: GETATTR - Get file attributes
- Procedure 2: SETATTR - Set file attributes
- Procedure 3: LOOKUP - Lookup filename
- Procedure 4: ACCESS - Check Access Permission
- Procedure 5: READLINK - Read from symbolic link
- Procedure 8: CREATE - Create a file
- Procedure 9: MKDIR - Create a directory
- Procedure 10: SYMLINK - Create a symbolic link
- Procedure 11: MKNOD - Create a special device
- Procedure 12: REMOVE - Remove a File
- Procedure 13: RMDIR - Remove a Directory
- Procedure 14: RENAME - Rename a File or Directory
- Procedure 15: LINK - Create Link to an object
- Procedure 16: READDIR - Read From Directory
- Procedure 17: READDIRPLUS - Extended read from directory
- Procedure 18: FSSTAT - Get dynamic file system information
- Procedure 19: FSINFO - Get static file system Information
- Procedure 20: PATHCONF - Retrieve POSIX information
- Procedure 21: COMMIT - Commit cached data on a server to stable storage
NFSv4.1
NFSv4.1 metadata calls included in Other IOPS as covered in RFC-7530:
- Procedure 0: NULL – Do nothing
- Procedure 1: COMPOUND – Combining multiple NFS operations into a single request
- Operation 3: ACCESS – Check access rights
- Operation 4: CLOSE – Close file
- Operation 5: COMMIT – Commit cached data
- Operation 6: CREATE - Create a nonregular file object
- Operation 7: DELEGPURGE - Purge delegations awaiting recovery
- Operation 8: DELEGRETURN - Return delegation
- Operation 9: GETATTR - Get attributes
- Operation 10: GETFH - Get current filehandle
- Operation 11: LINK - Create link to a file
- Operation 12: LOCK - Create lock
- Operation 13: LOCKT - Test for Lock
- Operation 14: LOCKU - Unlock file
- Operation 15: LOOKUP - Look Up filename
- Operation 16: LOOKUPP - Look Up parent directory
- Operation 17: NVERIFY - Verify difference in attributes
- Operation 18: OPEN - Open a regular file
- Operation 19: OPENATTR - Open named attribute directory
- Operation 20: OPEN_CONFIRM - Confirm open
- Operation 21: OPEN_DOWNGRADE - Reduce open file access
- Operation 22: PUTFH - Set current filehandle
- Operation 23: PUTPUBFH - Set public filehandle
- Operation 24: PUTROOTFH - Set root filehandle
- Operation 26: READDIR - Read directory
- Operation 27: READLINK - Read symbolic link
- Operation 28: REMOVE - Remove file system object
- Operation 29: RENAME - Rename directory entry
- Operation 30: RENEW - Renew a lease
- Operation 32: SAVEFH - Save current filehandle
- Operation 33: SECINFO - Obtain available security
- Operation 34: SETATTR - Set attributes
- Operation 35: SETCLIENTID - Negotiate client ID
- Operation 36: SETCLIENTID_CONFIRM - Confirm client ID
- Operation 37: VERIFY - Verify same attributes
- Operation 39: RELEASE_LOCKOWNER – Release lock-owner state
SMB (includes SMB2 and SMB3.x)
SMB commands included in Other IOPS with opcode value:
| SMB command | Opcode value |
|---|---|
| SMB2 NEGOTIATE | 0x0000 |
| SMB2 SESSION_SETUP | 0x0001 |
| SMB2 LOGOFF | 0x0002 |
| SMB2 TREE_CONNECT | 0x0003 |
| SMB2 TREE_DISCONNECT | 0x0004 |
| SMB2 CREATE | 0x0005 |
| SMB2 CLOSE | 0x0006 |
| SMB2 FLUSH | 0x0007 |
| SMB2 LOCK | 0x000A |
| SMB2 IOCTL | 0x000B |
| SMB2 CANCEL | 0x000C |
| SMB2 ECHO | 0x000D |
| SMB2 QUERY_DIRECTORY | 0x000E |
| SMB2 CHANGE_NOTIFY | 0x000F |
| SMB2 QUERY_INFO | 0x0010 |
| SMB2 SET_INFO | 0x0011 |
| SMB2 OPLOCK_BREAK | 0x0012 |
Ways to access metrics
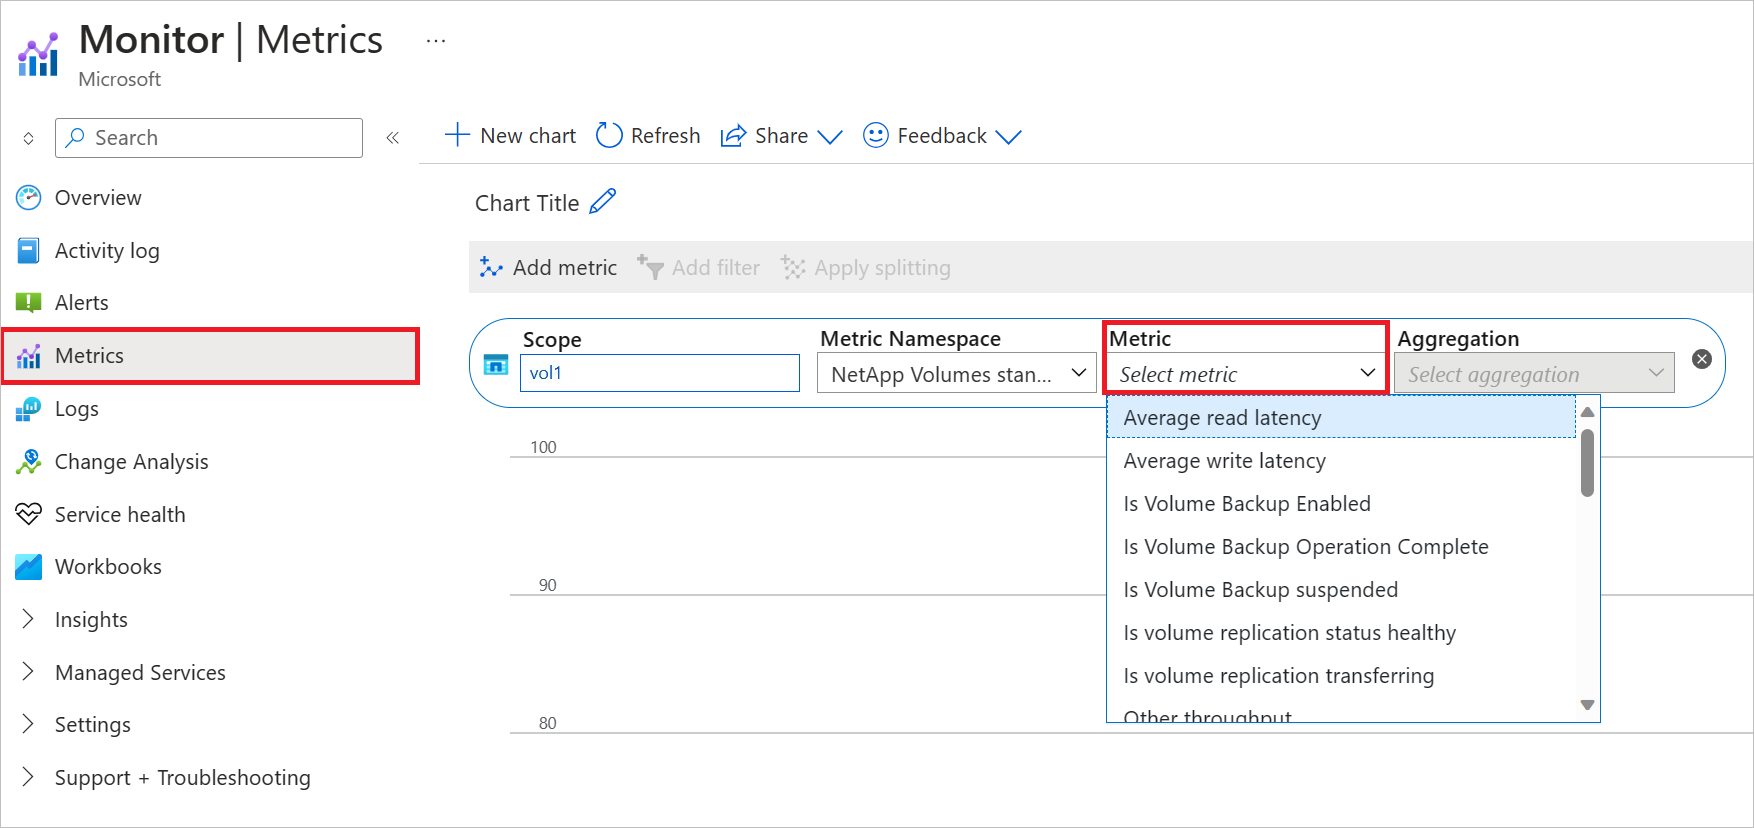
Azure NetApp Files metrics are natively integrated into Azure monitor. From within the Azure portal, you can find metrics for Azure NetApp Files capacity pools and volumes from two locations:
From Azure monitor, select Metrics, select a capacity pool or volume. Then select Metric to view the available metrics:
Tip
For cache volumes, enter the cache's full resource ID in the search filter.
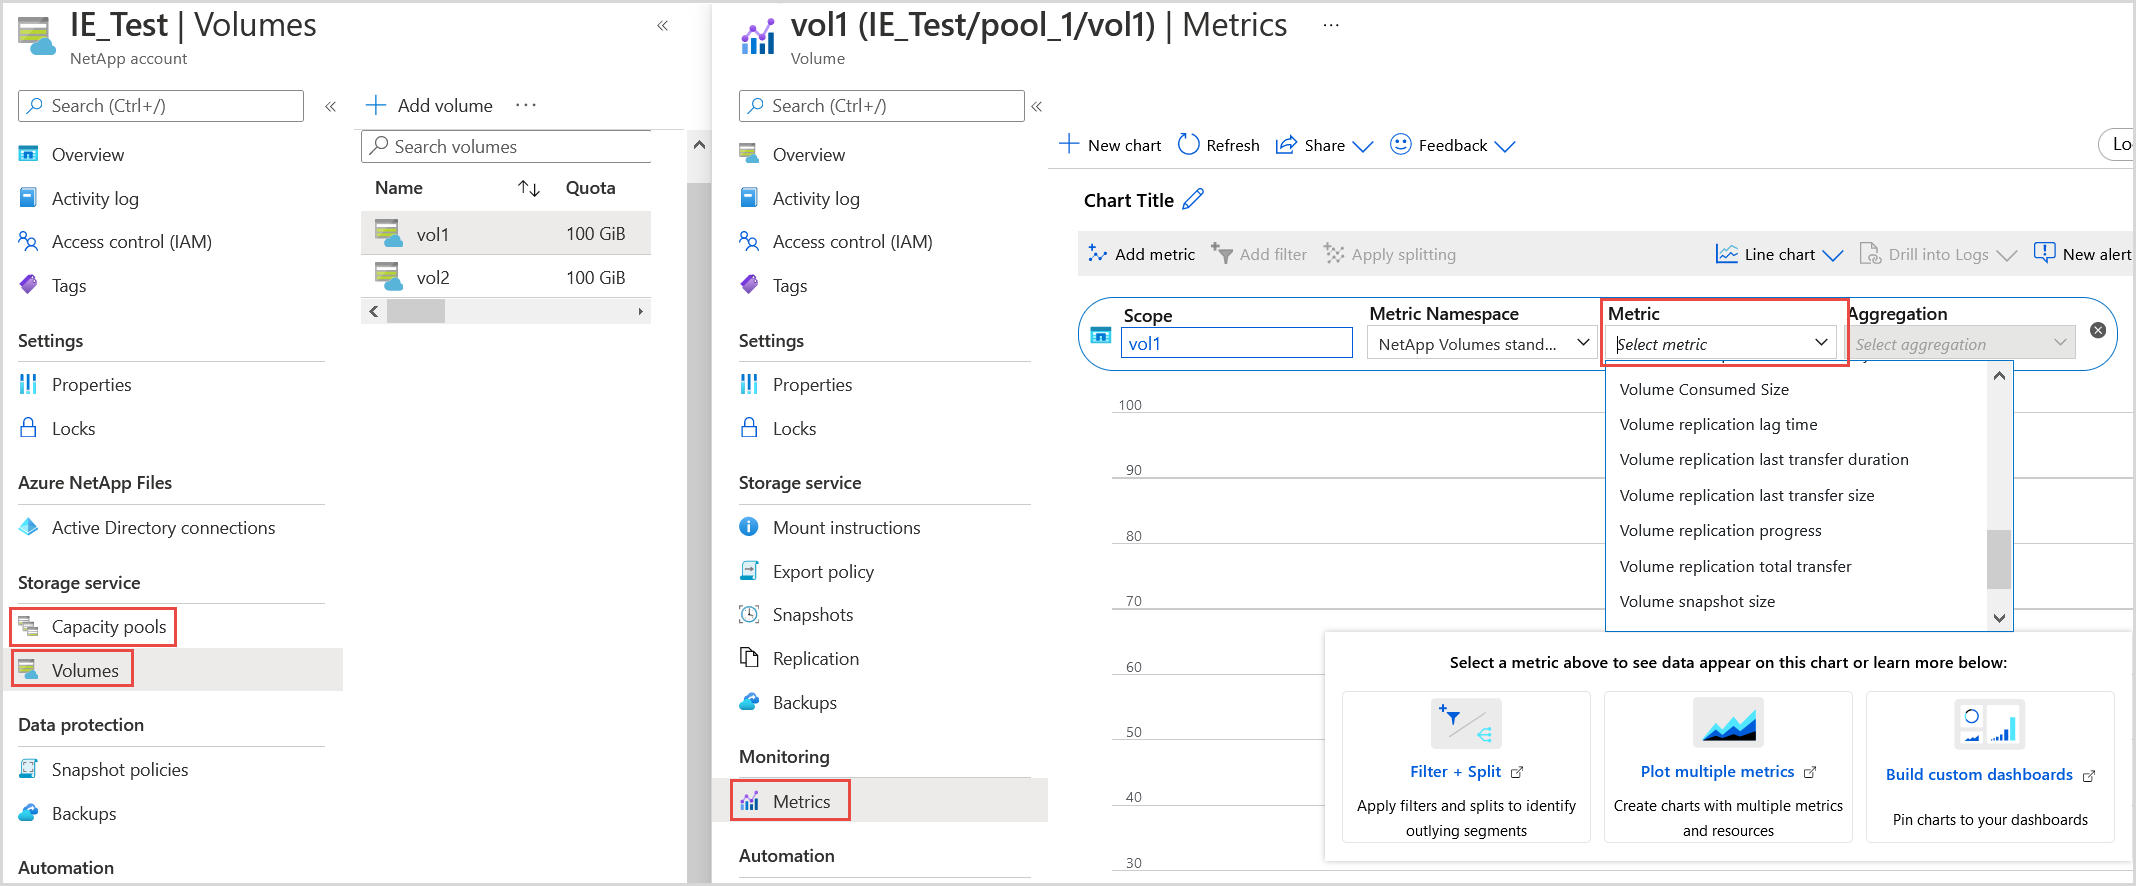
From the Azure NetApp Files capacity pool or volume, select Metrics. Then select Metric to view the available metrics:


Subscription quota metrics
Subscription quota metrics display subscription-level quotas relative to the imposed limits. These metrics are displayed in two columns: the available limit and the consumption by your subscription.

Accounts per subscription
Number of NetApp accounts per region
Capacity pools per subscription
Number of capacity pools per subscription
Snapshots per volume
Number of snapshots per volume
Buckets per volume
Number of buckets per volume
Total backup enabled volumes per subscription
Maximum number of volumes that can be backed up per subscription
Total cool access volumes per subscription
Total number of cool access volumes per subscription
Volumes per subscription
Total number of volumes per subscription
Volumes per capacity pool
Total number of volumes per capacity pool
Total DP volumes per subscription
Total number of data protection volumes per subscription (destination volumes)
Short-term clone volumes per source volume
Total number of short-term clone volumes per source volume
Short-term clone volumes per subscription
Total number of short-term clone volumes per subscription
Total TIBs per subscription
Total regional capacity per subscription
Usage metrics for capacity pools
Pool Allocated Size
The provisioned size of the pool.Pool Allocated to Volume Size
The total of volume quota (GiB) in a given capacity pool (that is, the total of the volumes' provisioned sizes in the capacity pool).
This size is the size you selected during volume creation.Pool Consumed Size
The total of logical space (GiB) used across volumes in a capacity pool.Total Snapshot Size for the Pool
The sum of snapshot size from all volumes in the pool.
Usage metrics for volumes
Azure NetApp Files provides metrics on allocated storage, actual storage usage, volume I/OPS, and latency. Use these metrics to understand usage and performance.
Percentage Volume Consumed Size
The percentage of the volume consumed, including snapshots.
Aggregation metrics (for example, min, max) aren't supported for percentage volume consumed size.Volume Allocated Size
The provisioned size of a volume
Volume Quota Size
The quota size (GiB) the volume is provisioned with.
Volume Consumed Size
Logical size of the volume (used bytes).
This size includes logical space used by active file systems and snapshots.Volume Snapshot Size
The size of all snapshots in a volume.
Volume Inodes Quota
The volume's maximum allowed inodes (or
maxfiles) if the limit was increased via support request. If the limit hasn't been increased via support request, this metric's value is 0.Volume Inodes Total
The volume's maximum allowed inodes (or
maxfiles) based on the volume size.Volume Inodes Used
The volume's used inodes (or
maxfiles).Volume Inodes Percentage
The percentage of the volume's available inodes (or
maxfiles) consumed.If the volume inode limit has been increased by a support request, the percentage is calculated based on Volume Inodes Quota metric. If the volume inode limit is the default value based on the volume size, the percentage is calculated based on the Volume Inodes Total metric.
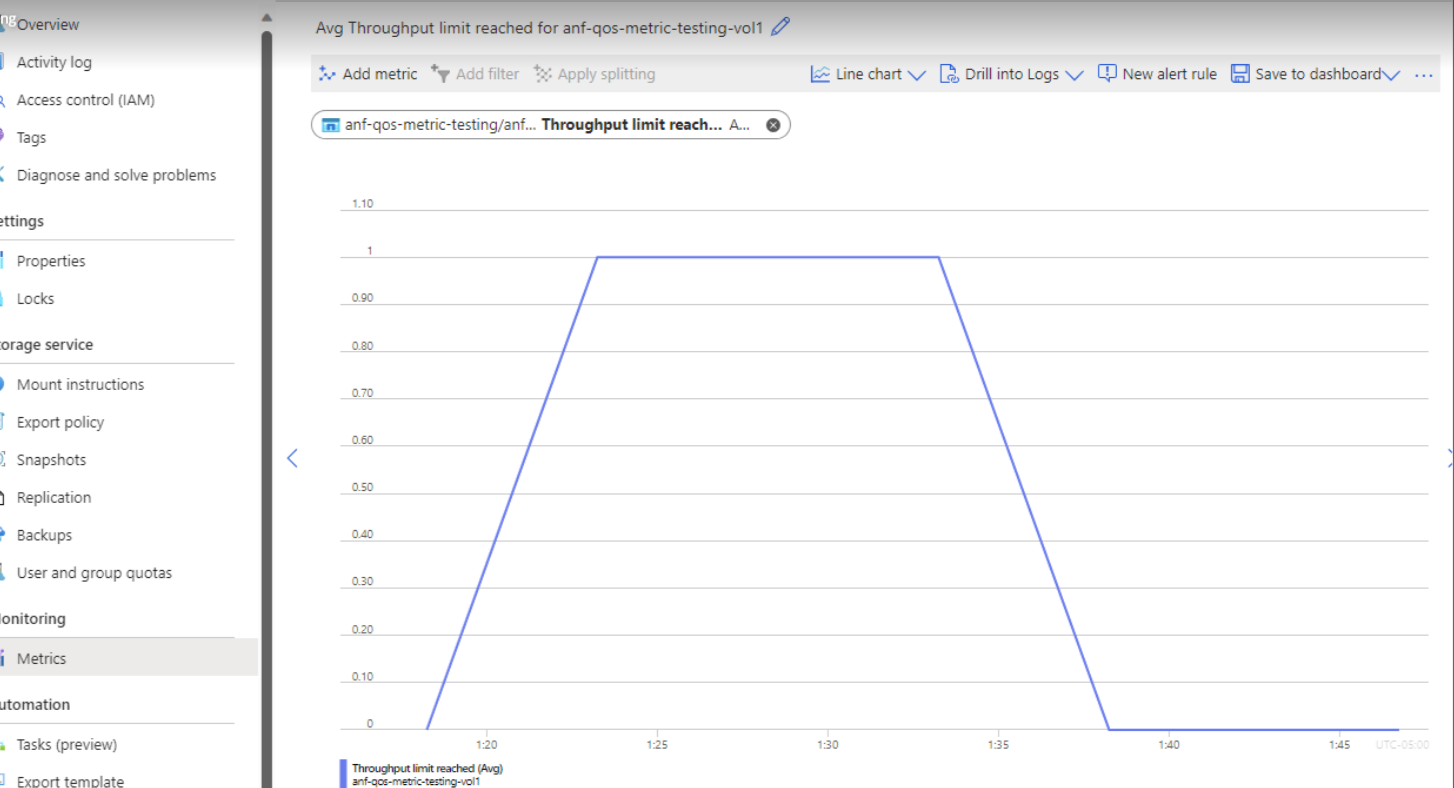
Throughput limit reached
Throughput limit reached is a boolean metric that denotes the volume is hitting its QoS limits. If the metric displays 1, the volume has reached its throughput, and throughput for this volume will be throttled. The value 0 means this limit hasn't yet been reached.
Note
The "Throughput limit reached" metric is collected every 5 minutes. If the limit has been reached during the previous five-minute window, it means the limit has been reached in that window.
If the volume is hitting the throughput limit, it's not sized appropriately for the application's demands. To resolve throughput issues:
Resize the volume:
To avoid throttling, increase the volume's size to allocate more throughput.
Modify the service level:
The Premium and Ultra service levels in Azure NetApp Files cater to workloads with higher throughput requirements. Moving the volume to a capacity pool in a higher service level automatically increases these limits for the volume.
Change the workloads/application:
Consider repurposing the volume and delegating a different volume with a larger size and/or in a higher service level to meet your application requirements. If it's an NFS volume, consider changing mount options to reduce data flow if your application supports those changes.

Performance metrics for volumes
Note
Volume latency for Average Read Latency and Average Write Latency is measured within the storage service and doesn't include network latency.
Average Read Latency
The average roundtrip time (RTT) for reads from the volume in milliseconds.Average Write Latency
The average roundtrip time (RTT) for writes from the volume in milliseconds.Read IOPS
The number of read operations to the volume per second.Write IOPS
The number of write operations to the volume per second.Other IOPS
The number of other operations to the volume per second.
Total IOPS
A sum of the write, read, and other operations to the volume per second.
Volume replication metrics
Note
- Network transfer size (for example, the Volume replication total transfer metrics) might differ from the source or destination volumes of a cross-region replication. This behavior is a result of efficient replication engine being used to minimize the network transfer cost.
- Volume replication metrics are currently populated for replication destination volumes and not the source of the replication relationship.
Is volume replication status healthy
The condition of the replication relationship. A healthy state is denoted by1. An unhealthy state is denoted by0.Is volume replication transferring
Whether the status of the volume replication is transferring.Volume replication lag time
The delay between when data is written to the source volume and when it’s available on the destination volume.
Note
When assessing the health status of the volume replication, consider the volume replication lag time. If the lag time is greater than the replication schedule, the replication volume won't catch up to the source. To resolve this issue, adjust the replication speed or the replication schedule.
Volume replication last transfer duration
The time taken for the most recent replication session to transfer all changed data (example: blocks, snapshots) from the source volume to the destination volume.Volume replication last transfer size
The total amount of data transferred during the most recent replication session from a source volume to its destination volume.Volume replication progress
The total amount of data in bytes transferred for the current transfer operation.Volume replication total transfer
The cumulative volume of data transferred from the source volume to the destination volume throughout the entire lifetime of the replication relationship.
Throughput metrics for capacity pools
Pool allocated throughput
Sum of the throughput of all the volumes belonging to the pool.Provisioned throughput for the pool
Provisioned throughput of this pool.
Throughput metrics for volumes
Read throughput
Read throughput in bytes per second.
Total throughput
Sum of all throughput in bytes per second.Write throughput
Write throughput in bytes per second.
Other throughput
Other throughput (that isn't read or write) in bytes per second.
Total throughput
Sum of all throughput (read, write, and other) in bytes per second.
Volume backup metrics
Is Volume Backup Enabled
Shows whether backup is enabled for the volume.
1is enabled.0is disabled.Is Volume Backup Operation Complete
Shows whether the last volume backup or restore operation is successfully completed.
1is successful.0is unsuccessful.Is Volume Backup Suspended
Shows whether the backup policy is suspended for the volume. A value of
1means it's not suspended. A value of0means it's suspended.Volume Backup Bytes
The total bytes backed up for this volume.
Volume Backup Operation Last Transferred Bytes
Total bytes transferred for last backup operation.
Volume Backup Restore Operation Last Transferred Bytes
Total bytes transferred for last backup restore operation.
Cool access metrics
Volume cool tier size
Volume footprint for the cool tier.Volume cool tier data read size
Data read in usingGETper volume.Volume cool tier data write size
Data tiered out usingPUTper volume.
Cache volume metrics (preview)
Cache miss blocks
This metric counts missed blocks in the caching process. During steady-state, after warming of cache, if this value exceeds client requested blocks, this is indicative of a less than ideal workload type.
Client requested blocks
A data movement over time count to provide insights into latency.
Constituents at capacity count
A count of the constituents that are at least 90% full.
Flex Cache connection status
The metric displays 1 if all the cache volumes can connect to the origin volume. A value of 0 means the connection isn't working.
Maximum file size
The maximum file size in bytes.