Note
Access to this page requires authorization. You can try signing in or changing directories.
Access to this page requires authorization. You can try changing directories.
This article walks you through the process of programmatically creating and publishing Azure dashboards. You can use this process to create a deployable template based on any dashboard.
Overview
Shared dashboards in the Azure portal are resources, just like virtual machines and storage accounts. You can manage resources programmatically by using Azure REST API, Azure CLI, and Azure PowerShell. Each of these APIs and tools provide ways to create, list, retrieve, modify, and delete resources.
Whichever tools you use, to create a dashboard programmatically, you construct a JSON representation of your dashboard object. This object contains information about the tiles on the dashboard. It includes sizes, positions, resources, and customizations.
The most practical way to generate this JSON document is to use the Azure portal to create an initial dashboard with the tiles you want. After you create the dashboard, you export the JSON, then use it as a template. The template can be modified further and deployed using Azure Resource Manager.
Fetch the JSON representation of a dashboard
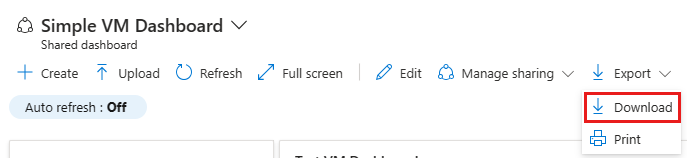
First, download the JSON representation of an existing dashboard. From the dashboard that you want to start with, select Export and then select Download.
If you prefer, you can retrieve the representation and other information about the dashboard resource programmatically, such as by using REST APIs.
Create a dashboard template
Azure lets you orchestrate the deployment of multiple resources, such as dashboards. You create a deployment template that expresses the set of resources to deploy and the relationships between them. In this case, you create a template by modifying the JSON you downloaded.
The JSON format of each deployed template resource is the same as if you were creating them individually by uploading an exported dashboard, except that the template language adds a few concepts like variables, parameters, basic functions, and more. This extended syntax is only supported in the context of a template deployment. For more information, see Understand the structure and syntax of ARM templates.
You can preserve the structure and configuration of each tile, then parameterize the set of Azure resources that the tiles refer to, so they can be reused and adapted for different resources. TO do so, use the template's parameter syntax to replace specific resource IDs with parameterized values.
For example, your template might include a hard-coded resource ID for a VM, such as:
resourceId: "/subscriptions/aaaa0a0a-bb1b-cc2c-dd3d-eeeeee4e4e4e/resourceGroups/contoso/providers/Microsoft.Compute/virtualMachines/myVM1"
This can be replaced with a parameterized version that you can use with other VMs, such as:
resourceId: "[resourceId(parameters('virtualMachineResourceGroup'), 'Microsoft.Compute/virtualMachines', parameters('virtualMachineName'))]"
Declare required template metadata and the parameters at the top of the JSON template, like this:
{
    "$schema": "https://schema.management.azure.com/schemas/2019-04-01/deploymentTemplate.json#",
    "contentVersion": "1.0.0.0",
    "parameters": {
        "virtualMachineName": {
            "type": "string"
        },
        "virtualMachineResourceGroup": {
            "type": "string"
        },
        "dashboardName": {
            "type": "string"
        }
    },
    "variables": {},
    "resources": [
        ... rest of template omitted ...
    ]
}
Once you've configured your template, deploy it using any of the following methods:
Example dashboard
Consider the following example dashboard:
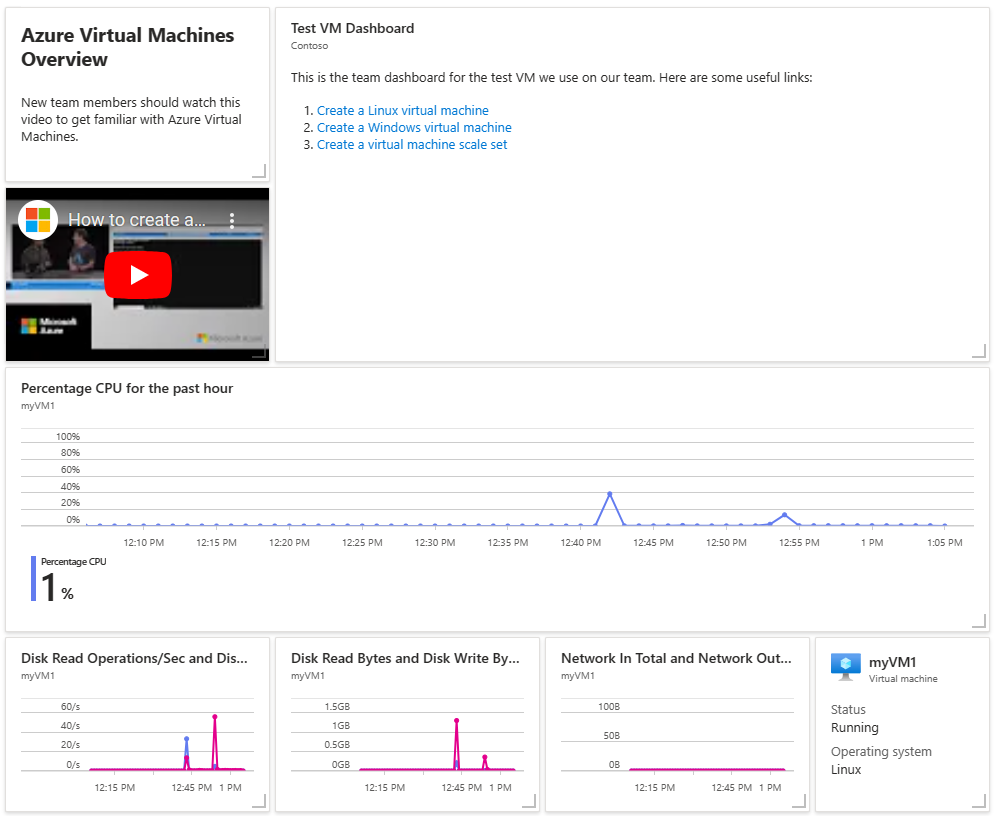
The following sections show two JSON representations of this example dashboard. The first is the version exported from the portal that's bound to a specific VM resource. The second is the template version that can be programmatically bound to any VM and deployed using Azure Resource Manager.
Example JSON representation exported from dashboard
This example template is similar to what you'll see when you export a dashboard that looks like the example at the beginning of this article. The hard-coded resource identifiers show that this dashboard is pointing at a specific Azure VM.
{
  "properties": {
    "lenses": [
      {
        "order": 0,
        "parts": [
          {
            "position": {
              "x": 0,
              "y": 0,
              "colSpan": 3,
              "rowSpan": 2
            },
            "metadata": {
              "inputs": [],
              "type": "Extension/HubsExtension/PartType/MarkdownPart",
              "settings": {
                "content": {
                  "settings": {
                    "content": "## Azure Virtual Machines Overview\r\nNew team members should watch this video to get familiar with Azure Virtual Machines.",
                    "markdownUri": null
                  }
                }
              }
            }
          },
          {
            "position": {
              "x": 3,
              "y": 0,
              "colSpan": 8,
              "rowSpan": 4
            },
            "metadata": {
              "inputs": [],
              "type": "Extension/HubsExtension/PartType/MarkdownPart",
              "settings": {
                "content": {
                  "settings": {
                    "content": "This is the team dashboard for the test VM we use on our team. Here are some useful links:\r\n\r\n1. [Create a Linux virtual machine](https://docs.microsoft.com/azure/virtual-machines/linux/quick-create-portal)\r\n1. [Create a Windows virtual machine](https://docs.microsoft.com/azure/virtual-machines/windows/quick-create-portal)\r\n1. [Create a virtual machine scale set](https://docs.microsoft.com/azure/virtual-machine-scale-sets/quick-create-portal)",
                    "title": "Test VM Dashboard",
                    "subtitle": "Contoso",
                    "markdownUri": null
                  }
                }
              }
            }
          },
          {
            "position": {
              "x": 0,
              "y": 2,
              "colSpan": 3,
              "rowSpan": 2
            },
            "metadata": {
              "inputs": [],
              "type": "Extension/HubsExtension/PartType/VideoPart",
              "settings": {
                "content": {
                  "settings": {
                    "src": "https://www.youtube.com/watch?v=rOiSRkxtTeU",
                    "autoplay": false
                  }
                }
              }
            }
          },
          {
            "position": {
              "x": 0,
              "y": 4,
              "colSpan": 11,
              "rowSpan": 3
            },
            "metadata": {
              "inputs": [
                {
                  "name": "queryInputs",
                  "value": {
                    "timespan": {
                      "duration": "PT1H"
                    },
                    "id": "/subscriptions/aaaa0a0a-bb1b-cc2c-dd3d-eeeeee4e4e4e/resourceGroups/SimpleWinVMResourceGroup/providers/Microsoft.Compute/virtualMachines/myVirtualMachine",
                    "chartType": 0,
                    "metrics": [
                      {
                        "name": "Percentage CPU",
                        "resourceId": "/subscriptions/aaaa0a0a-bb1b-cc2c-dd3d-eeeeee4e4e4e/resourceGroups/SimpleWinVMResourceGroup/providers/Microsoft.Compute/virtualMachines/myVirtualMachine"
                      }
                    ]
                  }
                }
              ],
              "type": "Extension/Microsoft_Azure_Monitoring/PartType/MetricsChartPart"
            }
          },
          {
            "position": {
              "x": 0,
              "y": 7,
              "colSpan": 3,
              "rowSpan": 2
            },
            "metadata": {
              "inputs": [
                {
                  "name": "queryInputs",
                  "value": {
                    "timespan": {
                      "duration": "PT1H"
                    },
                    "id": "/subscriptions/aaaa0a0a-bb1b-cc2c-dd3d-eeeeee4e4e4e/resourceGroups/SimpleWinVMResourceGroup/providers/Microsoft.Compute/virtualMachines/myVirtualMachine",
                    "chartType": 0,
                    "metrics": [
                      {
                        "name": "Disk Read Operations/Sec",
                        "resourceId": "/subscriptions/aaaa0a0a-bb1b-cc2c-dd3d-eeeeee4e4e4e/resourceGroups/SimpleWinVMResourceGroup/providers/Microsoft.Compute/virtualMachines/myVirtualMachine"
                      },
                      {
                        "name": "Disk Write Operations/Sec",
                        "resourceId": "/subscriptions/aaaa0a0a-bb1b-cc2c-dd3d-eeeeee4e4e4e/resourceGroups/SimpleWinVMResourceGroup/providers/Microsoft.Compute/virtualMachines/myVirtualMachine"
                      }
                    ]
                  }
                }
              ],
              "type": "Extension/Microsoft_Azure_Monitoring/PartType/MetricsChartPart"
            }
          },
          {
            "position": {
              "x": 3,
              "y": 7,
              "colSpan": 3,
              "rowSpan": 2
            },
            "metadata": {
              "inputs": [
                {
                  "name": "queryInputs",
                  "value": {
                    "timespan": {
                      "duration": "PT1H"
                    },
                    "id": "/subscriptions/aaaa0a0a-bb1b-cc2c-dd3d-eeeeee4e4e4e/resourceGroups/SimpleWinVMResourceGroup/providers/Microsoft.Compute/virtualMachines/myVirtualMachine",
                    "chartType": 0,
                    "metrics": [
                      {
                        "name": "Disk Read Bytes",
                        "resourceId": "/subscriptions/aaaa0a0a-bb1b-cc2c-dd3d-eeeeee4e4e4e/resourceGroups/SimpleWinVMResourceGroup/providers/Microsoft.Compute/virtualMachines/myVirtualMachine"
                      },
                      {
                        "name": "Disk Write Bytes",
                        "resourceId": "/subscriptions/aaaa0a0a-bb1b-cc2c-dd3d-eeeeee4e4e4e/resourceGroups/SimpleWinVMResourceGroup/providers/Microsoft.Compute/virtualMachines/myVirtualMachine"
                      }
                    ]
                  }
                }
              ],
              "type": "Extension/Microsoft_Azure_Monitoring/PartType/MetricsChartPart"
            }
          },
          {
            "position": {
              "x": 6,
              "y": 7,
              "colSpan": 3,
              "rowSpan": 2
            },
            "metadata": {
              "inputs": [
                {
                  "name": "queryInputs",
                  "value": {
                    "timespan": {
                      "duration": "PT1H"
                    },
                    "id": "/subscriptions/aaaa0a0a-bb1b-cc2c-dd3d-eeeeee4e4e4e/resourceGroups/SimpleWinVMResourceGroup/providers/Microsoft.Compute/virtualMachines/myVirtualMachine",
                    "chartType": 0,
                    "metrics": [
                      {
                        "name": "Network In Total",
                        "resourceId": "/subscriptions/aaaa0a0a-bb1b-cc2c-dd3d-eeeeee4e4e4e/resourceGroups/SimpleWinVMResourceGroup/providers/Microsoft.Compute/virtualMachines/myVirtualMachine"
                      },
                      {
                        "name": "Network Out Total",
                        "resourceId": "/subscriptions/aaaa0a0a-bb1b-cc2c-dd3d-eeeeee4e4e4e/resourceGroups/SimpleWinVMResourceGroup/providers/Microsoft.Compute/virtualMachines/myVirtualMachine"
                      }
                    ]
                  }
                }
              ],
              "type": "Extension/Microsoft_Azure_Monitoring/PartType/MetricsChartPart"
            }
          },
          {
            "position": {
              "x": 9,
              "y": 7,
              "colSpan": 2,
              "rowSpan": 2
            },
            "metadata": {
              "inputs": [
                {
                  "name": "id",
                  "value": "/subscriptions/aaaa0a0a-bb1b-cc2c-dd3d-eeeeee4e4e4e/resourceGroups/SimpleWinVMResourceGroup/providers/Microsoft.Compute/virtualMachines/myVirtualMachine"
                }
              ],
              "type": "Extension/Microsoft_Azure_Compute/PartType/VirtualMachinePart",
              "asset": {
                "idInputName": "id",
                "type": "VirtualMachine"
              }
            }
          }
        ]
      }
    ],
    "metadata": {
      "model": {}
    }
  },
  "name": "Simple VM Dashboard",
  "type": "Microsoft.Portal/dashboards",
  "location": "INSERT LOCATION",
  "tags": {
    "hidden-title": "Simple VM Dashboard"
  },
  "apiVersion": "2022-12-01-preview"
}
Example parameterized dashboard template
This example shows the template version of the previous dashboard, which can be programmatically bound to any virtual machine and deployed using Azure Resource Manager.
The templatized version of the example dashboard has defined three parameters called virtualMachineName, virtualMachineResourceGroup, and dashboardName. These parameters let you use the same dashboard template with a different Azure virtual machine every time you deploy. It can be programmatically configured and deployed to point to any Azure virtual machine. To test this feature, copy the following template and paste it into the Azure portal template deployment page.
This example deploys one dashboard by itself, but the template language lets you deploy multiple resources and bundle one or more dashboards together.
{
  "$schema": "https://schema.management.azure.com/schemas/2019-04-01/deploymentTemplate.json#",
  "contentVersion": "1.0.0.0",
  "parameters": {
    "virtualMachineName": {
      "type": "string",
      "metadata": {
        "description": "Name of the existing virtual machine to show in the dashboard"
      }
    },
    "virtualMachineResourceGroup": {
      "type": "string",
      "metadata": {
        "description": "Name of the resource group that contains the virtual machine"
      }
    },
    "dashboardName": {
      "type": "string",
      "defaultValue": "[guid(parameters('virtualMachineName'), parameters('virtualMachineResourceGroup'))]",
      "metadata": {
        "Description": "Resource name that Azure portal uses for the dashboard"
      }
    },
    "dashboardDisplayName": {
      "type": "string",
      "defaultValue": "Simple VM Dashboard",
      "metadata": {
        "description": "Name of the dashboard to display in Azure portal"
      }
    },
    "location": {
      "type": "string",
      "defaultValue": "[resourceGroup().location]"
    }
  },
  "resources": [
    {
      "type": "Microsoft.Portal/dashboards",
      "apiVersion": "2020-09-01-preview",
      "name": "[parameters('dashboardName')]",
      "location": "[parameters('location')]",
      "tags": {
        "hidden-title": "[parameters('dashboardDisplayName')]"
      },
      "properties": {
        "lenses": [
          {
            "order": 0,
            "parts": [
              {
                "position": {
                  "x": 0,
                  "y": 0,
                  "rowSpan": 2,
                  "colSpan": 3
                },
                "metadata": {
                  "inputs": [],
                  "type": "Extension/HubsExtension/PartType/MarkdownPart",
                  "settings": {
                    "content": {
                      "settings": {
                        "content": "## Azure Virtual Machines Overview\r\nNew team members should watch this video to get familiar with Azure Virtual Machines."
                      }
                    }
                  }
                }
              },
              {
                "position": {
                  "x": 3,
                  "y": 0,
                  "rowSpan": 4,
                  "colSpan": 8
                },
                "metadata": {
                  "inputs": [],
                  "type": "Extension/HubsExtension/PartType/MarkdownPart",
                  "settings": {
                    "content": {
                      "settings": {
                        "content": "This is the team dashboard for the test VM we use on our team. Here are some useful links:\r\n\r\n1. [Create a Linux virtual machine](https://docs.microsoft.com/azure/virtual-machines/linux/quick-create-portal)\r\n1. [Create a Windows virtual machine](https://docs.microsoft.com/azure/virtual-machines/windows/quick-create-portal)\r\n1. [Create a virtual machine scale set](https://docs.microsoft.com/azure/virtual-machine-scale-sets/quick-create-portal)",
                        "title": "Test VM Dashboard",
                        "subtitle": "Contoso"
                      }
                    }
                  }
                }
              },
              {
                "position": {
                  "x": 0,
                  "y": 2,
                  "rowSpan": 2,
                  "colSpan": 3
                },
                "metadata": {
                  "inputs": [],
                  "type": "Extension/HubsExtension/PartType/VideoPart",
                  "settings": {
                    "content": {
                      "settings": {
                        "src": "https://www.youtube.com/watch?v=rOiSRkxtTeU",
                        "autoplay": false
                      }
                    }
                  }
                }
              },
              {
                "position": {
                  "x": 0,
                  "y": 4,
                  "rowSpan": 3,
                  "colSpan": 11
                },
                "metadata": {
                  "inputs": [
                    {
                      "name": "queryInputs",
                      "value": {
                        "timespan": {
                          "duration": "PT1H"
                        },
                        "id": "[resourceId(parameters('virtualMachineResourceGroup'), 'Microsoft.Compute/virtualMachines', parameters('virtualMachineName'))]",
                        "chartType": 0,
                        "metrics": [
                          {
                            "name": "Percentage CPU",
                            "resourceId": "[resourceId(parameters('virtualMachineResourceGroup'), 'Microsoft.Compute/virtualMachines', parameters('virtualMachineName'))]"
                          }
                        ]
                      }
                    }
                  ],
                  "type": "Extension/Microsoft_Azure_Monitoring/PartType/MetricsChartPart"
                }
              },
              {
                "position": {
                  "x": 0,
                  "y": 7,
                  "rowSpan": 2,
                  "colSpan": 3
                },
                "metadata": {
                  "inputs": [
                    {
                      "name": "queryInputs",
                      "value": {
                        "timespan": {
                          "duration": "PT1H"
                        },
                        "id": "[resourceId(parameters('virtualMachineResourceGroup'), 'Microsoft.Compute/virtualMachines', parameters('virtualMachineName'))]",
                        "chartType": 0,
                        "metrics": [
                          {
                            "name": "Disk Read Operations/Sec",
                            "resourceId": "[resourceId(parameters('virtualMachineResourceGroup'), 'Microsoft.Compute/virtualMachines', parameters('virtualMachineName'))]"
                          },
                          {
                            "name": "Disk Write Operations/Sec",
                            "resourceId": "[resourceId(parameters('virtualMachineResourceGroup'), 'Microsoft.Compute/virtualMachines', parameters('virtualMachineName'))]"
                          }
                        ]
                      }
                    }
                  ],
                  "type": "Extension/Microsoft_Azure_Monitoring/PartType/MetricsChartPart"
                }
              },
              {
                "position": {
                  "x": 3,
                  "y": 7,
                  "rowSpan": 2,
                  "colSpan": 3
                },
                "metadata": {
                  "inputs": [
                    {
                      "name": "queryInputs",
                      "value": {
                        "timespan": {
                          "duration": "PT1H"
                        },
                        "id": "[resourceId(parameters('virtualMachineResourceGroup'), 'Microsoft.Compute/virtualMachines', parameters('virtualMachineName'))]",
                        "chartType": 0,
                        "metrics": [
                          {
                            "name": "Disk Read Bytes",
                            "resourceId": "[resourceId(parameters('virtualMachineResourceGroup'), 'Microsoft.Compute/virtualMachines', parameters('virtualMachineName'))]"
                          },
                          {
                            "name": "Disk Write Bytes",
                            "resourceId": "[resourceId(parameters('virtualMachineResourceGroup'), 'Microsoft.Compute/virtualMachines', parameters('virtualMachineName'))]"
                          }
                        ]
                      }
                    }
                  ],
                  "type": "Extension/Microsoft_Azure_Monitoring/PartType/MetricsChartPart"
                }
              },
              {
                "position": {
                  "x": 6,
                  "y": 7,
                  "rowSpan": 2,
                  "colSpan": 3
                },
                "metadata": {
                  "inputs": [
                    {
                      "name": "queryInputs",
                      "value": {
                        "timespan": {
                          "duration": "PT1H"
                        },
                        "id": "[resourceId(parameters('virtualMachineResourceGroup'), 'Microsoft.Compute/virtualMachines', parameters('virtualMachineName'))]",
                        "chartType": 0,
                        "metrics": [
                          {
                            "name": "Network In Total",
                            "resourceId": "[resourceId(parameters('virtualMachineResourceGroup'), 'Microsoft.Compute/virtualMachines', parameters('virtualMachineName'))]"
                          },
                          {
                            "name": "Network Out Total",
                            "resourceId": "[resourceId(parameters('virtualMachineResourceGroup'), 'Microsoft.Compute/virtualMachines', parameters('virtualMachineName'))]"
                          }
                        ]
                      }
                    }
                  ],
                  "type": "Extension/Microsoft_Azure_Monitoring/PartType/MetricsChartPart"
                }
              },
              {
                "position": {
                  "x": 9,
                  "y": 7,
                  "rowSpan": 2,
                  "colSpan": 2
                },
                "metadata": {
                  "inputs": [
                    {
                      "name": "id",
                      "value": "[resourceId(parameters('virtualMachineResourceGroup'), 'Microsoft.Compute/virtualMachines', parameters('virtualMachineName'))]"
                    }
                  ],
                  "type": "Extension/Microsoft_Azure_Compute/PartType/VirtualMachinePart",
                  "asset": {
                    "idInputName": "id",
                    "type": "VirtualMachine"
                  }
                }
              }
            ]
          }
        ]
      }
    }
  ]
}
Now that you've seen an example of using a parameterized template to deploy a dashboard, you can try deploying the template by using the Azure Resource Manager REST APIs, the Azure CLI, or Azure PowerShell.
Next steps
- Learn more about the structure of Azure dashboards.
- Learn how to use markdown tiles on Azure dashboards to show custom content.
- Learn how to manage access for shared dashboards.