Note
Access to this page requires authorization. You can try signing in or changing directories.
Access to this page requires authorization. You can try changing directories.
This article describes:
- The types of monitoring data you can collect for this service.
- Ways to analyze that data.
Note
If you're already familiar with this service and/or Azure Monitor and just want to know how to analyze monitoring data, see the Analyze section near the end of this article.
When you have critical applications and business processes that rely on Azure resources, you need to monitor and get alerts for your system. The Azure Monitor service collects and aggregates metrics and logs from every component of your system. Azure Monitor provides you with a view of availability, performance, and resilience, and notifies you of issues. You can use the Azure portal, PowerShell, Azure CLI, REST API, or client libraries to set up and view monitoring data.
- For more information on Azure Monitor, see the Azure Monitor overview.
- For more information on how to monitor Azure resources in general, see Monitor Azure resources with Azure Monitor.
Insights
Some services in Azure have a built-in monitoring dashboard in the Azure portal that provides a starting point for monitoring your service. These dashboards are called insights, and you can find them in the Insights Hub of Azure Monitor in the Azure portal.
For more information, see Monitor Azure Monitor Resource Group insights.
Resource types
Azure uses the concept of resource types and IDs to identify everything in a subscription. Resource types are also part of the resource IDs for every resource running in Azure. For example, one resource type for a virtual machine is Microsoft.Compute/virtualMachines. For a list of services and their associated resource types, see Resource providers.
Azure Monitor similarly organizes core monitoring data into metrics and logs based on resource types, also called namespaces. Different metrics and logs are available for different resource types. Your service might be associated with more than one resource type.
For more information about the resource types for Resource Manager, see Azure Resource Manager monitoring data reference.
Data storage
For Azure Monitor:
- Metrics data is stored in the Azure Monitor metrics database.
- Log data is stored in the Azure Monitor logs store. Log Analytics is a tool in the Azure portal that can query this store.
- The Azure activity log is a separate store with its own interface in the Azure portal.
You can optionally route metric and activity log data to the Azure Monitor logs store. You can then use Log Analytics to query the data and correlate it with other log data.
Many services can use diagnostic settings to send metric and log data to other storage locations outside Azure Monitor. Examples include Azure Storage, hosted partner systems, and non-Azure partner systems, by using Event Hubs.
For detailed information on how Azure Monitor stores data, see Azure Monitor data platform.
Azure Monitor platform metrics
Azure Monitor provides platform metrics for most services. These metrics are:
- Individually defined for each namespace.
- Stored in the Azure Monitor time-series metrics database.
- Lightweight and capable of supporting near real-time alerting.
- Used to track the performance of a resource over time.
Collection: Azure Monitor collects platform metrics automatically. No configuration is required.
Routing: You can also route some platform metrics to Azure Monitor Logs / Log Analytics so you can query them with other log data. Check the DS export setting for each metric to see if you can use a diagnostic setting to route the metric to Azure Monitor Logs / Log Analytics.
- For more information, see the Metrics diagnostic setting.
- To configure diagnostic settings for a service, see Create diagnostic settings in Azure Monitor.
For a list of all metrics it's possible to gather for all resources in Azure Monitor, see Supported metrics in Azure Monitor.
For a list of available metrics for Resource Manager, see Azure Resource Manager monitoring data reference.
When you create and manage resources in Azure, Azure Resource Manager orchestrates your requests through Azure's control plane. This article describes how to monitor the volume and latency of control plane requests made to Azure.
With these metrics, you can observe traffic and latency for control plane requests throughout your subscriptions. For example, you can figure out when your requests are throttled by examining throttled requests. Determine if they failed by filtering for specific status codes and examining server errors.
The metrics are available for up to three months (93 days) and only track synchronous requests. For a scenario like a virtual machine creation, the metrics don't represent the performance or reliability of the long-running asynchronous operation.
Accessing Azure Resource Manager metrics
You can access control plane metrics by using the Azure Monitor REST APIs, SDKs, and the Azure portal by selecting the Azure Resource Manager metric. For an overview on Azure Monitor, see Azure Monitor Metrics.
There's no opt-in or sign-up process to access control plane metrics.
For guidance on how to retrieve a bearer token and make requests to Azure, see Azure REST API reference.
Metric definition
The definition for Azure Resource Manager metrics in Azure Monitor is only accessible through the 2017-12-01-preview API version. To retrieve the definition, run the following snippet. Replace 00000000-0000-0000-0000-000000000000 with your subscription ID.
curl --location --request GET 'https://management.azure.com/subscriptions/ffff5f5f-aa6a-bb7b-cc8c-dddddd9d9d9d/providers/microsoft.insights/metricDefinitions?api-version=2017-12-01-preview&metricnamespace=microsoft.resources/subscriptions' \
--header 'Authorization: bearer {{bearerToken}}'
This snippet returns the definition for the metrics schema. Notably, this schema includes the dimensions you can filter on with the Monitor API.
Metrics examples
Here are some scenarios that can help you explore Azure Resource Manager metrics.
Query traffic and latency control plane metrics with Azure portal
First, navigate to the Azure Monitor page within the portal:
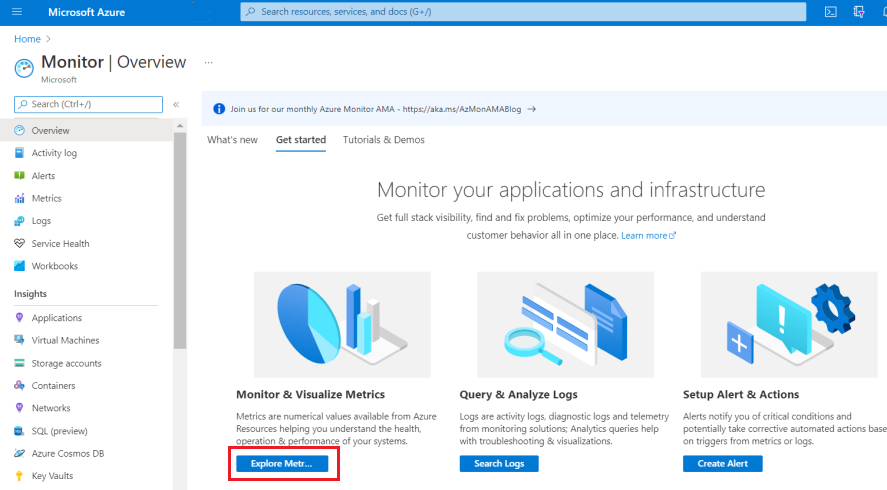
After selecting Explore Metrics, select a single subscription and then select the Azure Resource Manager metric:
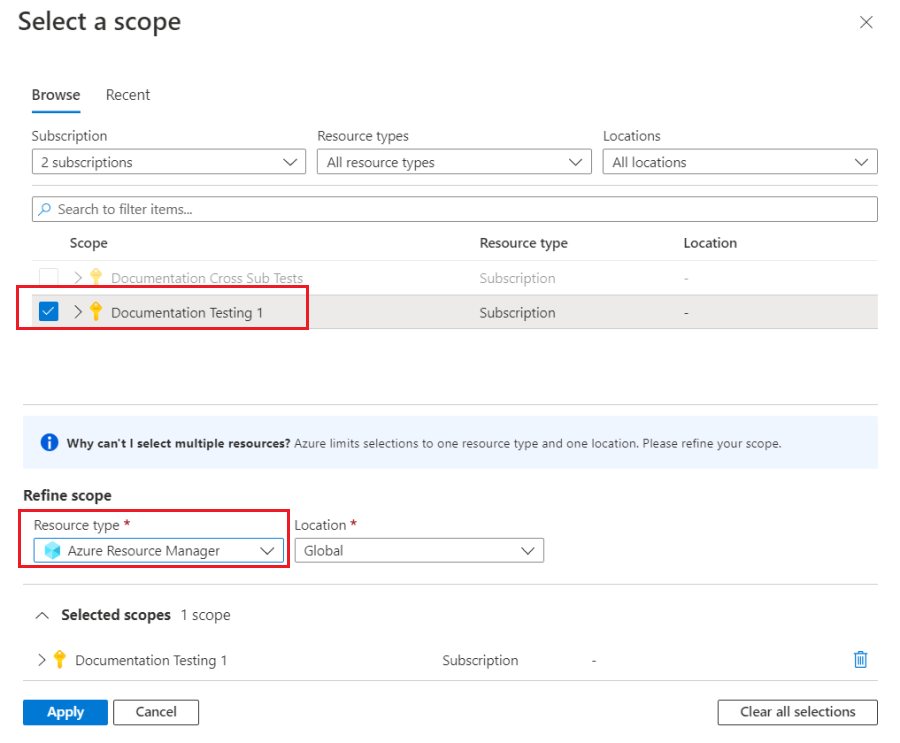
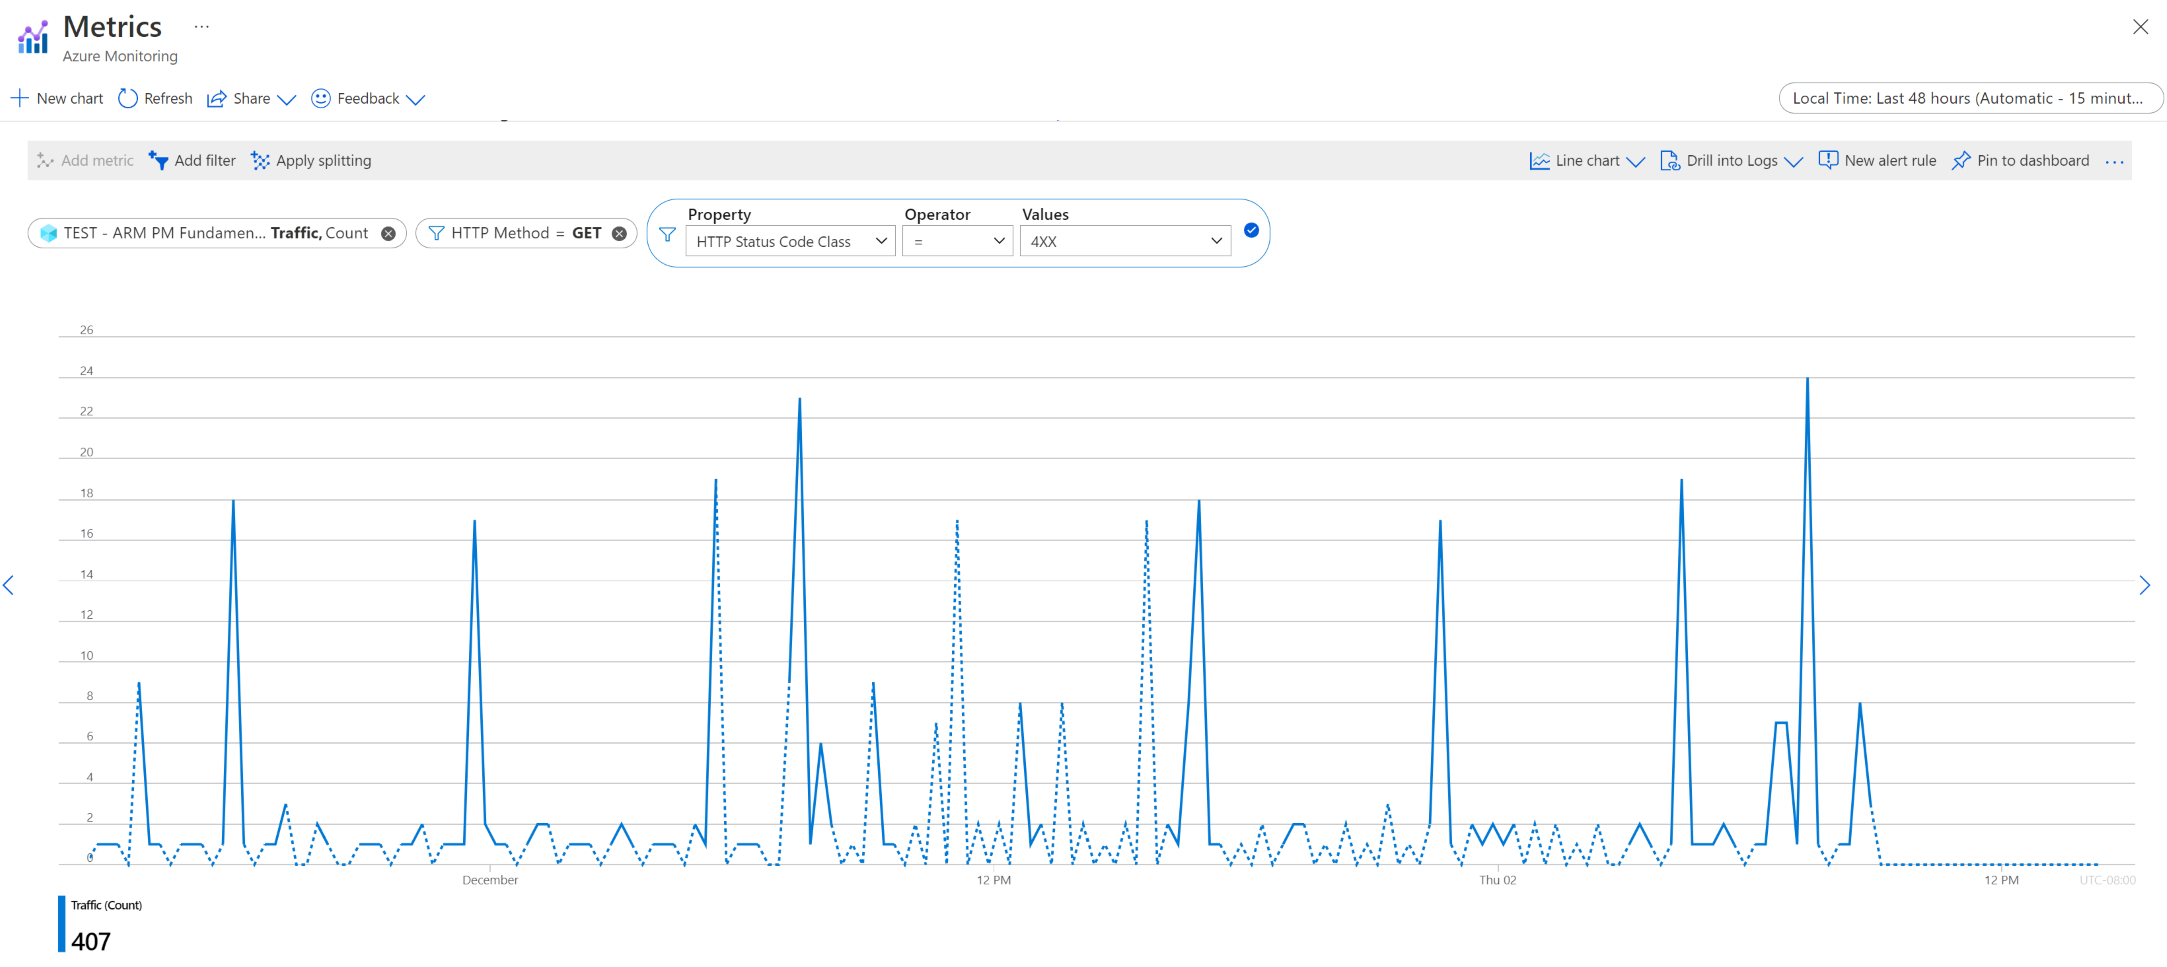
Then, after selecting Apply, you can visualize your Traffic or Latency control plane metrics with custom filtering and splitting:
Query traffic and latency control plane metrics with REST API
After you authenticate with Azure, make a request to retrieve control plane metrics for your subscription. In the script, replace 00000000-0000-0000-0000-000000000000 with your subscription ID. The script retrieves the average request latency, in seconds, and the total request count for the two-day timespan, broken down by one-day intervals:
curl --location --request GET "https://management.azure.com/subscriptions/ffff5f5f-aa6a-bb7b-cc8c-dddddd9d9d9d/providers/microsoft.insights/metrics?api-version=2021-05-01&interval=P1D&metricnames=Latency&metricnamespace=microsoft.resources/subscriptions®ion=global&aggregation=average,count×pan=2021-11-01T00:00:00Z/2021-11-03T00:00:00Z" \
--header "Authorization: bearer {{bearerToken}}"
For Azure Resource Manager metrics, you can retrieve the traffic count by using the Latency metric and including the count aggregation. You see a JSON response for the request:
{
    "cost": 5758,
    "timespan": "2021-11-01T00:00:00Z/2021-11-03T00:00:00Z",
    "interval": "P1D",
    "value": [
        {
            "id": "subscriptions/aaaa0a0a-bb1b-cc2c-dd3d-eeeeee4e4e4e/providers/Microsoft.Insights/metrics/Latency",
            "type": "Microsoft.Insights/metrics",
            "name": {
                "value": "Latency",
                "localizedValue": "Latency"
            },
            "displayDescription": "Latency data for all requests to Azure Resource Manager",
            "unit": "Seconds",
            "timeseries": [
                {
                    "metadatavalues": [],
                    "data": [
                        {
                            "timeStamp": "2021-11-01T00:00:00Z",
                            "count": 1406.0,
                            "average": 0.19345163584637273
                        },
                        {
                            "timeStamp": "2021-11-02T00:00:00Z",
                            "count": 1517.0,
                            "average": 0.28294792353328935
                        }
                    ]
                }
            ],
            "errorCode": "Success"
        }
    ],
    "namespace": "microsoft.resources/subscriptions",
    "resourceregion": "global"
}
To retrieve only the traffic count, use the Traffic metric with the count aggregation:
curl --location --request GET 'https://management.azure.com/subscriptions/ffff5f5f-aa6a-bb7b-cc8c-dddddd9d9d9d/providers/microsoft.insights/metrics?api-version=2021-05-01&interval=P1D&metricnames=Traffic&metricnamespace=microsoft.resources/subscriptions®ion=global&aggregation=count×pan=2021-11-01T00:00:00Z/2021-11-03T00:00:00Z' \
--header 'Authorization: bearer {{bearerToken}}'
The response for the request is:
{
    "cost": 2879,
    "timespan": "2021-11-01T00:00:00Z/2021-11-03T00:00:00Z",
    "interval": "P1D",
    "value": [
        {
            "id": "subscriptions/aaaa0a0a-bb1b-cc2c-dd3d-eeeeee4e4e4e/providers/Microsoft.Insights/metrics/Traffic",
            "type": "Microsoft.Insights/metrics",
            "name": {
                "value": "Traffic",
                "localizedValue": "Traffic"
            },
            "displayDescription": "Traffic data for all requests to Azure Resource Manager",
            "unit": "Count",
            "timeseries": [
                {
                    "metadatavalues": [],
                    "data": [
                        {
                            "timeStamp": "2021-11-01T00:00:00Z",
                            "count": 1406.0
                        },
                        {
                            "timeStamp": "2021-11-02T00:00:00Z",
                            "count": 1517.0
                        }
                    ]
                }
            ],
            "errorCode": "Success"
        }
    ],
    "namespace": "microsoft.resources/subscriptions",
    "resourceregion": "global"
}
For the metrics supporting dimensions, you need to specify the dimension value to see the corresponding metrics values. For example, if you want to focus on the Latency for successful requests to Resource Manager, filter the StatusCodeClass dimension with 2XX.
If you want to look at the number of requests made in your subscription for Networking resources, like Virtual Networks and Load Balancers, filter the Namespace dimension for MICROSOFT.NETWORK.
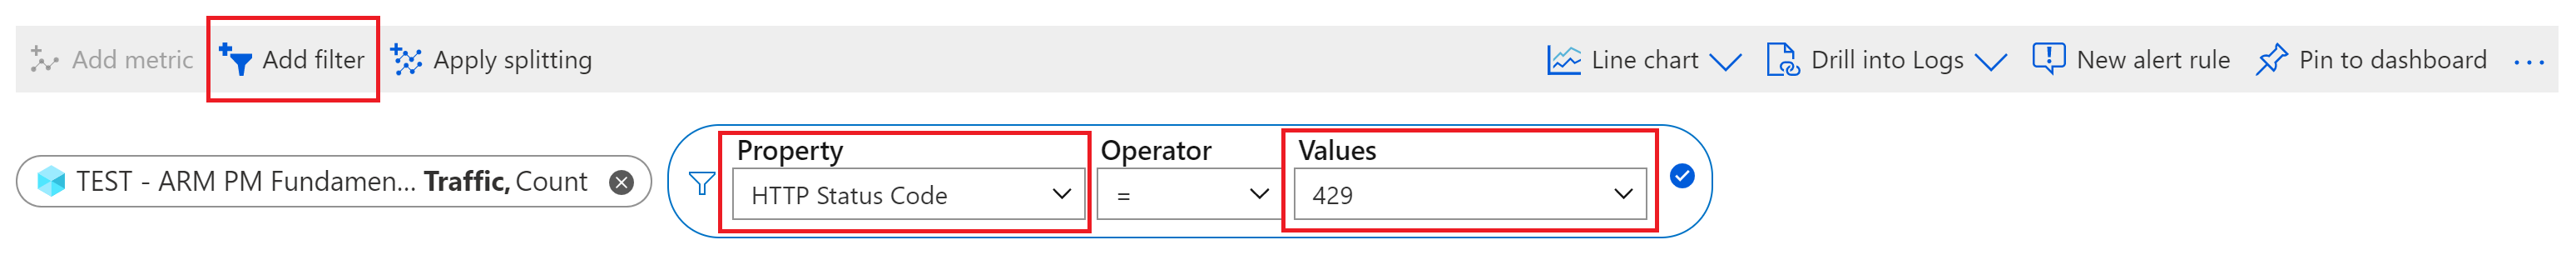
Examining Throttled Requests
To view only your throttled requests, filter for 429 status code responses. For REST API calls, use the $filter property and the StatusCode dimension by appending: $filter=StatusCode eq '429'. The following snippet shows this filter at the end of the request:
curl --location --request GET 'https://management.azure.com/subscriptions/ffff5f5f-aa6a-bb7b-cc8c-dddddd9d9d9d/providers/microsoft.insights/metrics?api-version=2021-05-01&interval=P1D&metricnames=Latency&metricnamespace=microsoft.resources/subscriptions®ion=global&aggregation=count,average×pan=2021-11-01T00:00:00Z/2021-11-03T00:00:00Z&$filter=StatusCode%20eq%20%27429%27' \
--header 'Authorization: bearer {{bearerToken}}'
You can also filter directly in portal:
Examining Server Errors
Similar to looking at throttled requests, you view all requests that returned a server error response code by filtering 5xx responses. To filter REST API calls, use the $filter property and the StatusCodeClass dimension by appending: $filter=StatusCodeClass eq '5xx' at the end of the request in the following snippet:
curl --location --request GET 'https://management.azure.com/subscriptions/ffff5f5f-aa6a-bb7b-cc8c-dddddd9d9d9d/providers/microsoft.insights/metrics?api-version=2021-05-01&interval=P1D&metricnames=Latency&metricnamespace=microsoft.resources/subscriptions®ion=global&aggregation=count,average×pan=2021-11-01T00:00:00Z/2021-11-03T00:00:00Z&$filter=StatusCodeClass%20eq%20%275xx%27' \
--header 'Authorization: bearer {{bearerToken}}'
You can also filter generic server errors in the portal by setting the filter property to StatusCodeClass and the value to 5xx, similar to what you did in the throttling example.
Azure Monitor resource logs
Resource logs provide insight into operations that were done by an Azure resource. Logs are generated automatically, but you must route them to Azure Monitor Logs to save or query them. Logs are organized into categories. A given namespace can have multiple resource log categories you can collect.
This service doesn't collect resource logs, but you can find information about them in Monitoring data from Azure resources.
Azure activity log
The activity log contains subscription-level events that track operations for each Azure resource as seen from outside that resource; for example, creating a new resource or starting a virtual machine.
Collection: Activity log events are automatically generated and collected in a separate store for viewing in the Azure portal.
Routing: You can send activity log data to Azure Monitor Logs so you can analyze it alongside other log data. Other locations such as Azure Storage, Azure Event Hubs, and certain Microsoft monitoring partners are also available. For more information on how to route the activity log, see Overview of the Azure activity log.
Analyze monitoring data
There are many tools for analyzing monitoring data.
Azure Monitor tools
Azure Monitor supports the following basic tools:
Metrics explorer, a tool in the Azure portal that allows you to view and analyze metrics for Azure resources. For more information, see Analyze metrics with Azure Monitor metrics explorer.
Log Analytics, a tool in the Azure portal that allows you to query and analyze log data by using the Kusto query language (KQL). For more information, see Get started with log queries in Azure Monitor.
The activity log, which has a user interface in the Azure portal for viewing and basic searches. To do more in-depth analysis, you have to route the data to Azure Monitor logs and run more complex queries in Log Analytics.
Tools that allow more complex visualization include:
- Dashboards that let you combine different kinds of data into a single pane in the Azure portal.
- Workbooks, customizable reports that you can create in the Azure portal. Workbooks can include text, metrics, and log queries.
- Grafana, an open platform tool that excels in operational dashboards. You can use Grafana to create dashboards that include data from multiple sources other than Azure Monitor.
- Power BI, a business analytics service that provides interactive visualizations across various data sources. You can configure Power BI to automatically import log data from Azure Monitor to take advantage of these visualizations.
Azure Monitor export tools
You can get data out of Azure Monitor into other tools by using the following methods:
Metrics: Use the REST API for metrics to extract metric data from the Azure Monitor metrics database. The API supports filter expressions to refine the data retrieved. For more information, see Azure Monitor REST API reference.
Logs: Use the REST API or the associated client libraries.
Another option is the workspace data export.
To get started with the REST API for Azure Monitor, see Azure monitoring REST API walkthrough.
Kusto queries
You can analyze monitoring data in the Azure Monitor Logs / Log Analytics store by using the Kusto query language (KQL).
Important
When you select Logs from the service's menu in the portal, Log Analytics opens with the query scope set to the current service. This scope means that log queries will only include data from that type of resource. If you want to run a query that includes data from other Azure services, select Logs from the Azure Monitor menu. See Log query scope and time range in Azure Monitor Log Analytics for details.
For a list of common queries for any service, see the Log Analytics queries interface.
Alerts
Azure Monitor alerts proactively notify you when specific conditions are found in your monitoring data. Alerts allow you to identify and address issues in your system before your customers notice them. For more information, see Azure Monitor alerts.
There are many sources of common alerts for Azure resources. For examples of common alerts for Azure resources, see Sample log alert queries. The Azure Monitor Baseline Alerts (AMBA) site provides a semi-automated method of implementing important platform metric alerts, dashboards, and guidelines. The site applies to a continually expanding subset of Azure services, including all services that are part of the Azure Landing Zone (ALZ).
The common alert schema standardizes the consumption of Azure Monitor alert notifications. For more information, see Common alert schema.
Types of alerts
You can alert on any metric or log data source in the Azure Monitor data platform. There are many different types of alerts depending on the services you're monitoring and the monitoring data you're collecting. Different types of alerts have various benefits and drawbacks. For more information, see Choose the right monitoring alert type.
The following list describes the types of Azure Monitor alerts you can create:
- Metric alerts evaluate resource metrics at regular intervals. Metrics can be platform metrics, custom metrics, logs from Azure Monitor converted to metrics, or Application Insights metrics. Metric alerts can also apply multiple conditions and dynamic thresholds.
- Log alerts allow users to use a Log Analytics query to evaluate resource logs at a predefined frequency.
- Activity log alerts trigger when a new activity log event occurs that matches defined conditions. Resource Health alerts and Service Health alerts are activity log alerts that report on your service and resource health.
Some Azure services also support smart detection alerts, Prometheus alerts, or recommended alert rules.
For some services, you can monitor at scale by applying the same metric alert rule to multiple resources of the same type that exist in the same Azure region. Individual notifications are sent for each monitored resource. For supported Azure services and clouds, see Monitor multiple resources with one alert rule.
Note
If you're creating or running an application that runs on your service, Azure Monitor application insights might offer more types of alerts.
Resource Manager alert rules
You can set alerts for any metric, log entry, or activity log entry listed in the Azure Resource Manager monitoring data reference.
Advisor recommendations
For some services, if critical conditions or imminent changes occur during resource operations, an alert displays on the service Overview page in the portal. You can find more information and recommended fixes for the alert in Advisor recommendations under Monitoring in the left menu. During normal operations, no advisor recommendations display.
For more information on Azure Advisor, see Azure Advisor overview.
Related content
- See Azure Resource Manager monitoring data reference for a reference of the metrics, logs, and other important values created for Resource Manager.
- See Monitoring Azure resources with Azure Monitor for general details on monitoring Azure resources.