Configure Azure Alerts in Azure VMware Solution
In this article, learn how to configure Azure Action Groups in Microsoft Azure Alerts to receive notifications of triggered events that you define. Also learn about using Azure Monitor Metrics to gain deeper insights into your Azure VMware Solution private cloud.
Note
Incidents affecting the availability of an Azure VMware Solution host and its corresponding restoration are sent automatically to the Account Administrator, Service Administrator (Classic Permission), Co-Admins (Classic Permission), and Owners (RBAC Role) of the subscription(s) containing Azure VMware Solution private clouds.
Supported metrics and activities
The following metrics are visible through Azure Monitor Metrics.
| Signal name | Signal type | Monitor service |
|---|---|---|
| Datastore Disk Total Capacity | Metric | Platform |
| Percentage Datastore Disk Used | Metric | Platform |
| Percentage CPU | Metric | Platform |
| Average Effective Memory | Metric | Platform |
| Average Memory Overhead | Metric | Platform |
| Average Total Memory | Metric | Platform |
| Average Memory Usage | Metric | Platform |
| Datastore Disk Used | Metric | Platform |
| All Administrative operations | Activity Log | Administrative |
| Register Microsoft.AVS resource provider. (Microsoft.AVS/privateClouds) | Activity Log | Administrative |
| Create or update a PrivateCloud. (Microsoft.AVS/privateClouds) | Activity Log | Administrative |
| Delete a PrivateCloud. (Microsoft.AVS/privateClouds) | Activity Log | Administrative |
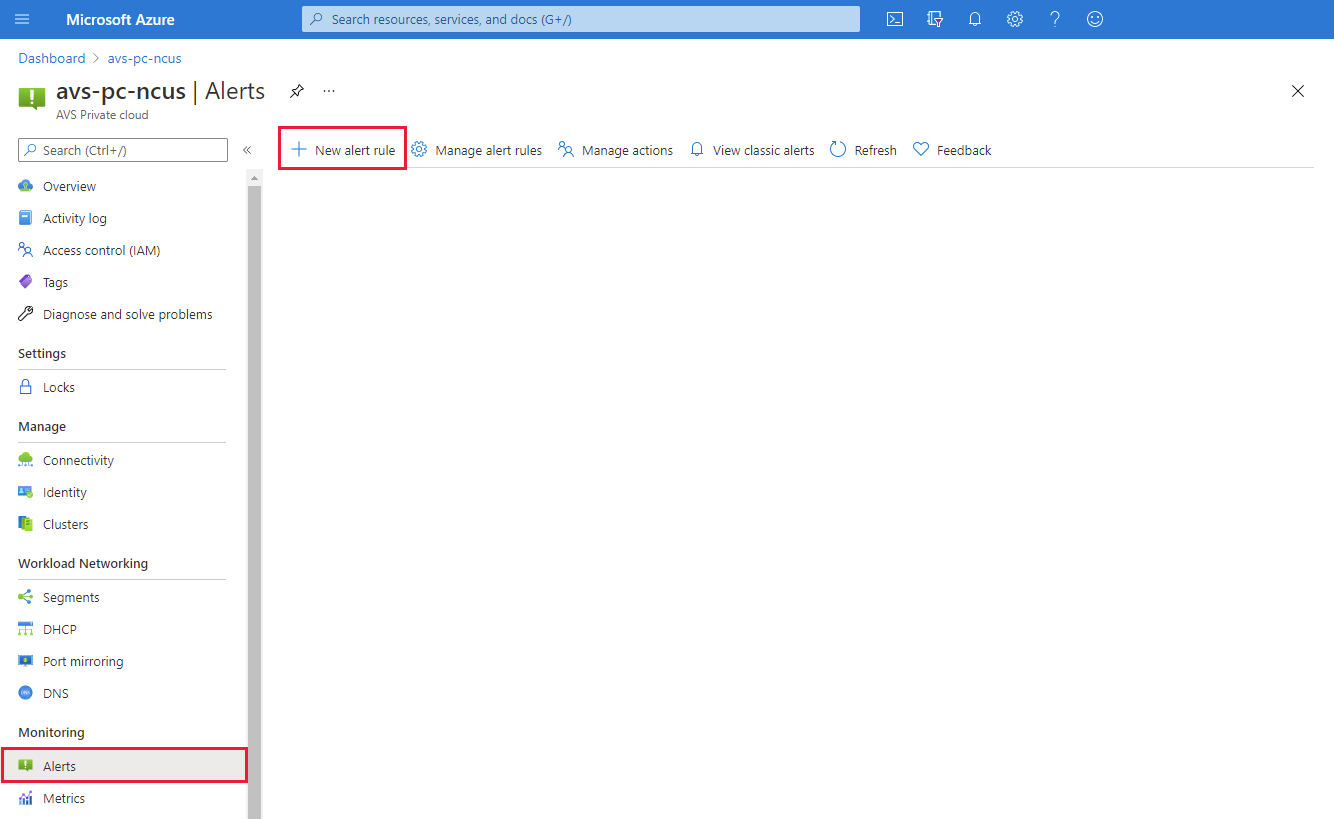
Configure an alert rule
From your Azure VMware Solution private cloud, select Monitoring > Alerts, and then New alert rule.
A new configuration screen opens where you'll:
- Define the Scope
- Configure a Condition
- Set up the Action Group
- Define the Alert rule details
Under Scope, select the target resource you want to monitor. By default, the Azure VMware Solution private cloud from where you opened the Alerts menu is defined.
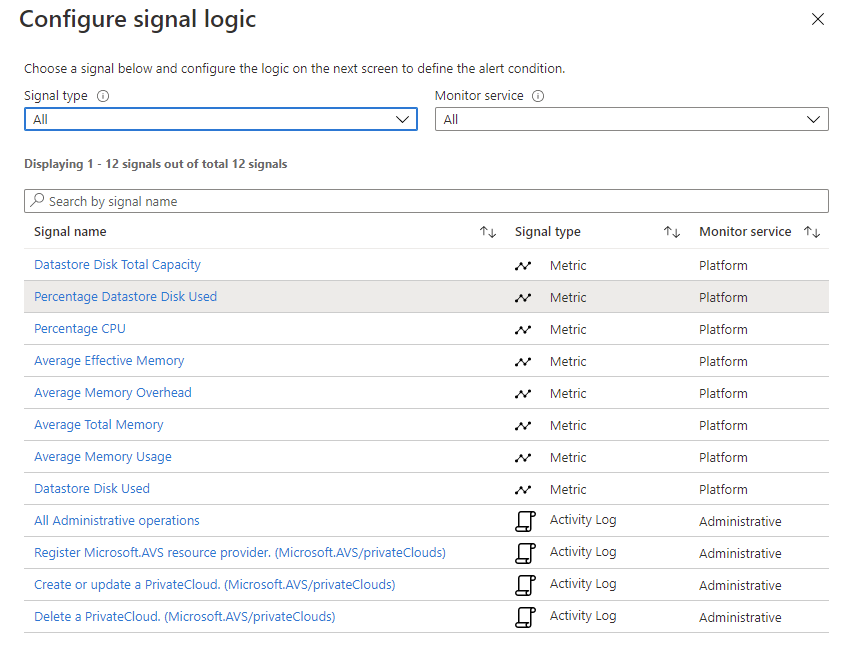
Under Condition, select Add condition, and in the window that opens, selects the signal you want to create for the alert rule.
In our example, we selected Percentage Datastore Disk Used, which is relevant from an Azure VMware Solution SLA perspective.
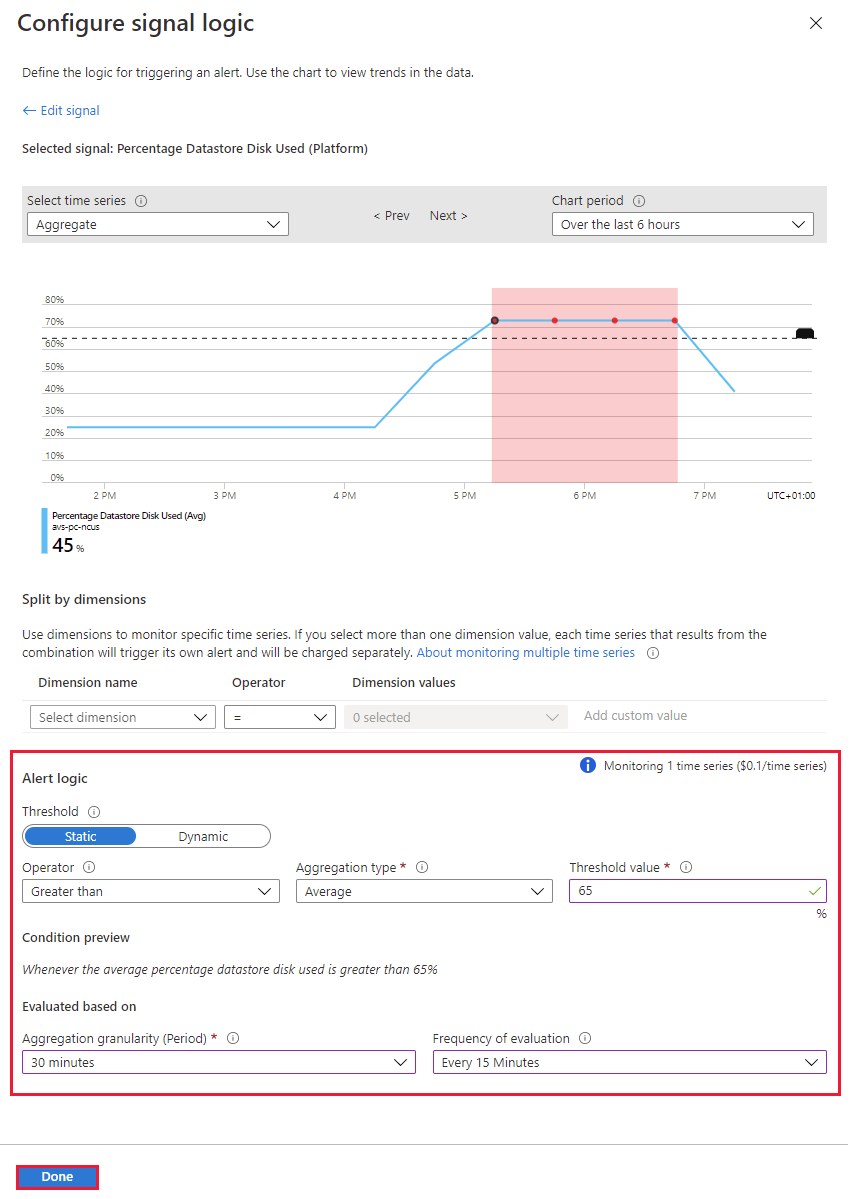
Define the logic that triggers the alert and then select Done.
In our example, only the Threshold and Frequency of evaluation were adjusted.
Under Actions, select Add action groups. The action group defines how the notification is received and who receives it. You can receive notifications by email, SMS, Azure Mobile App Push Notification or voice message.
Select an existing action group or select Create action group to create a new one.
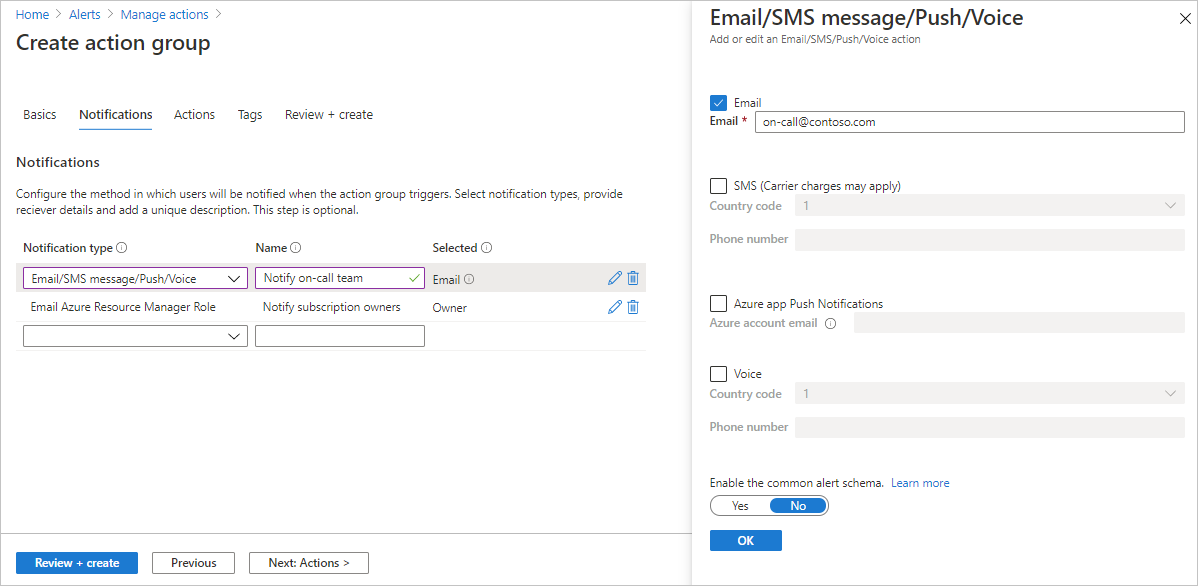
In the window that opens, on the Basics tab, give the action group a name and a display name.
Select the Notifications tab, select a Notification Type and Name. Then select OK.
Our example is based on email notification.
(Optional) Configure the Actions if you want to take proactive actions and receive notification on the event. Select an available Action type and then select Review + create.
Automation Runbooks - to automate tasks based on alerts
Azure Functions – for custom event-driven serverless code execution
ITSM – to integrate with a service provider like ServiceNow to create a ticket
Logic App - for more complex workflow orchestration
Webhooks - to trigger a process in another service
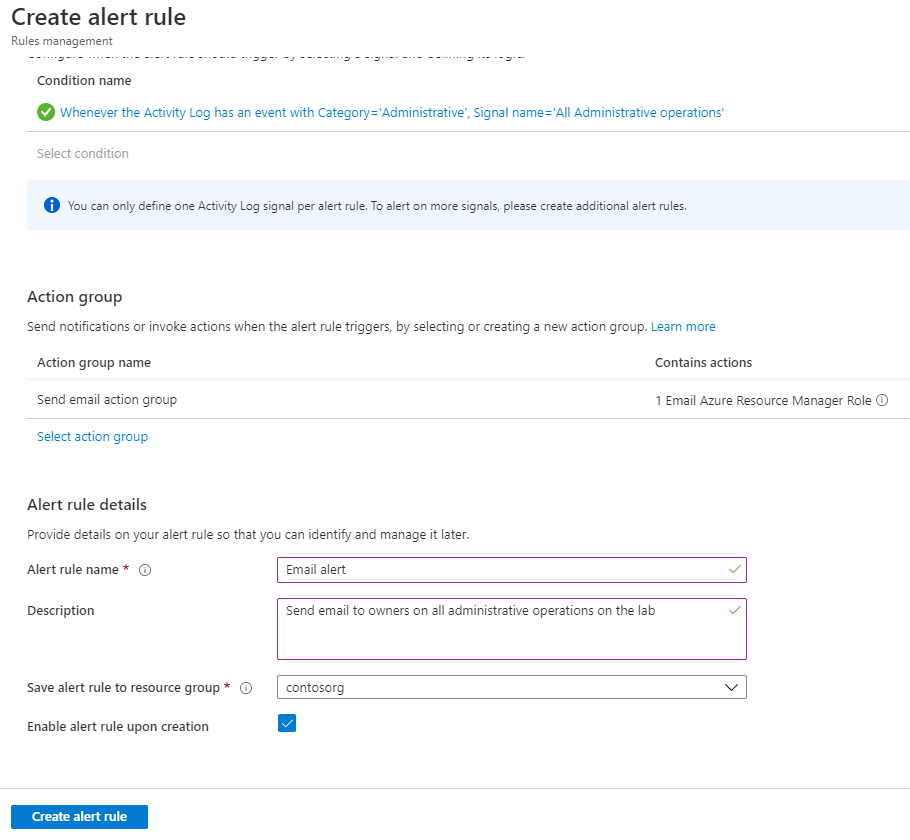
Under the Alert rule details, provide a name, description, resource group to store the alert rule, the severity. Then select Create alert rule.
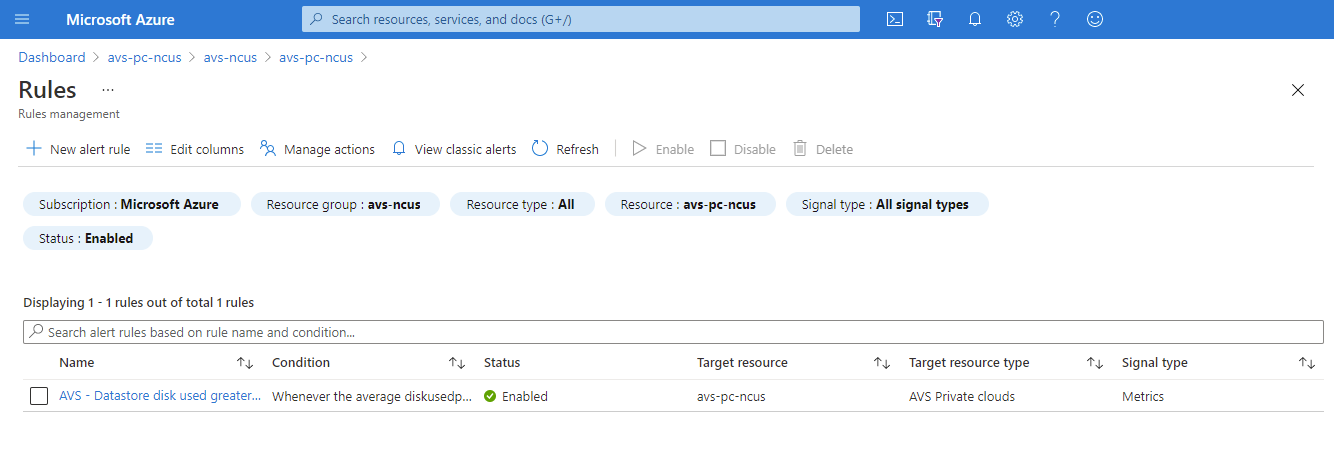
The alert rule is visible and can be managed from the Azure portal.
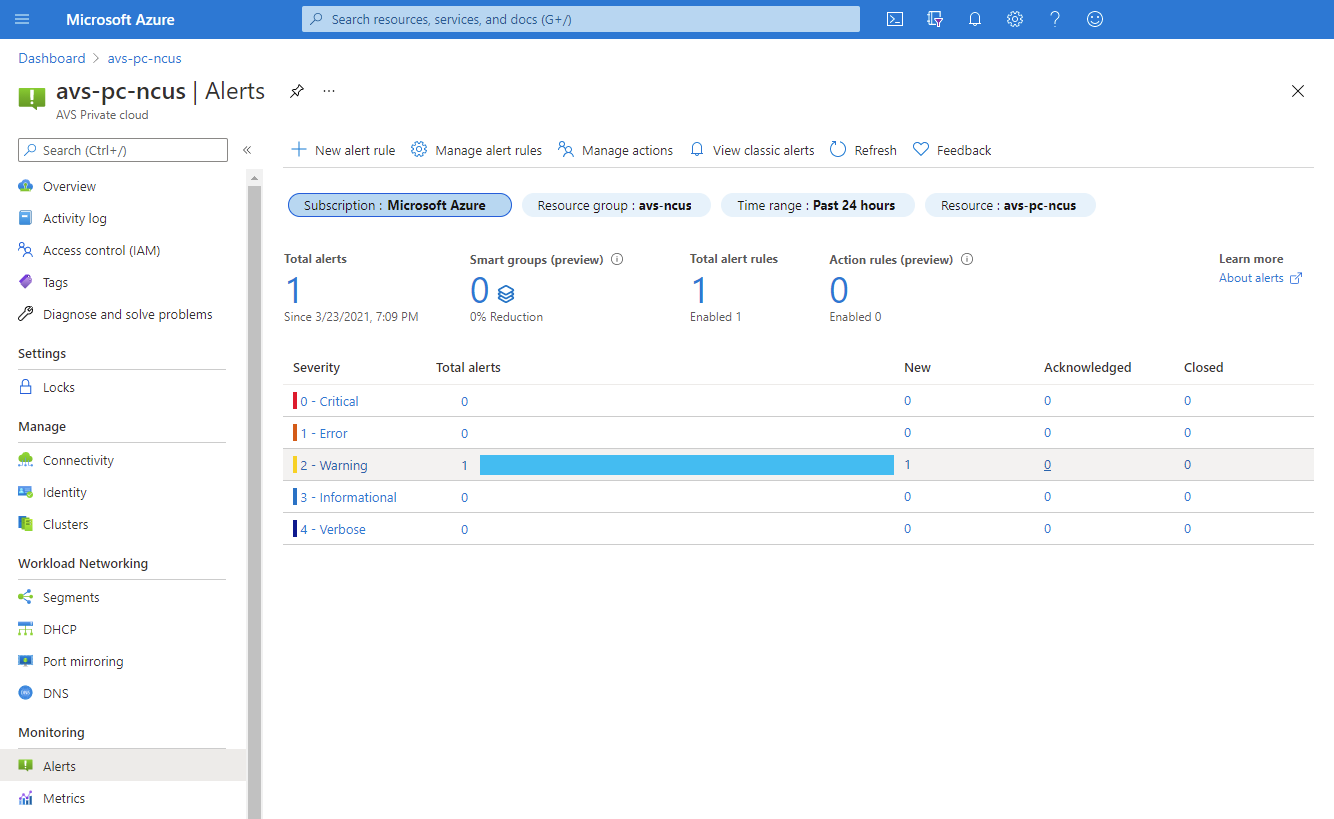
As soon as a metric reaches the threshold as defined in an alert rule, the Alerts menu is updated and made visible.
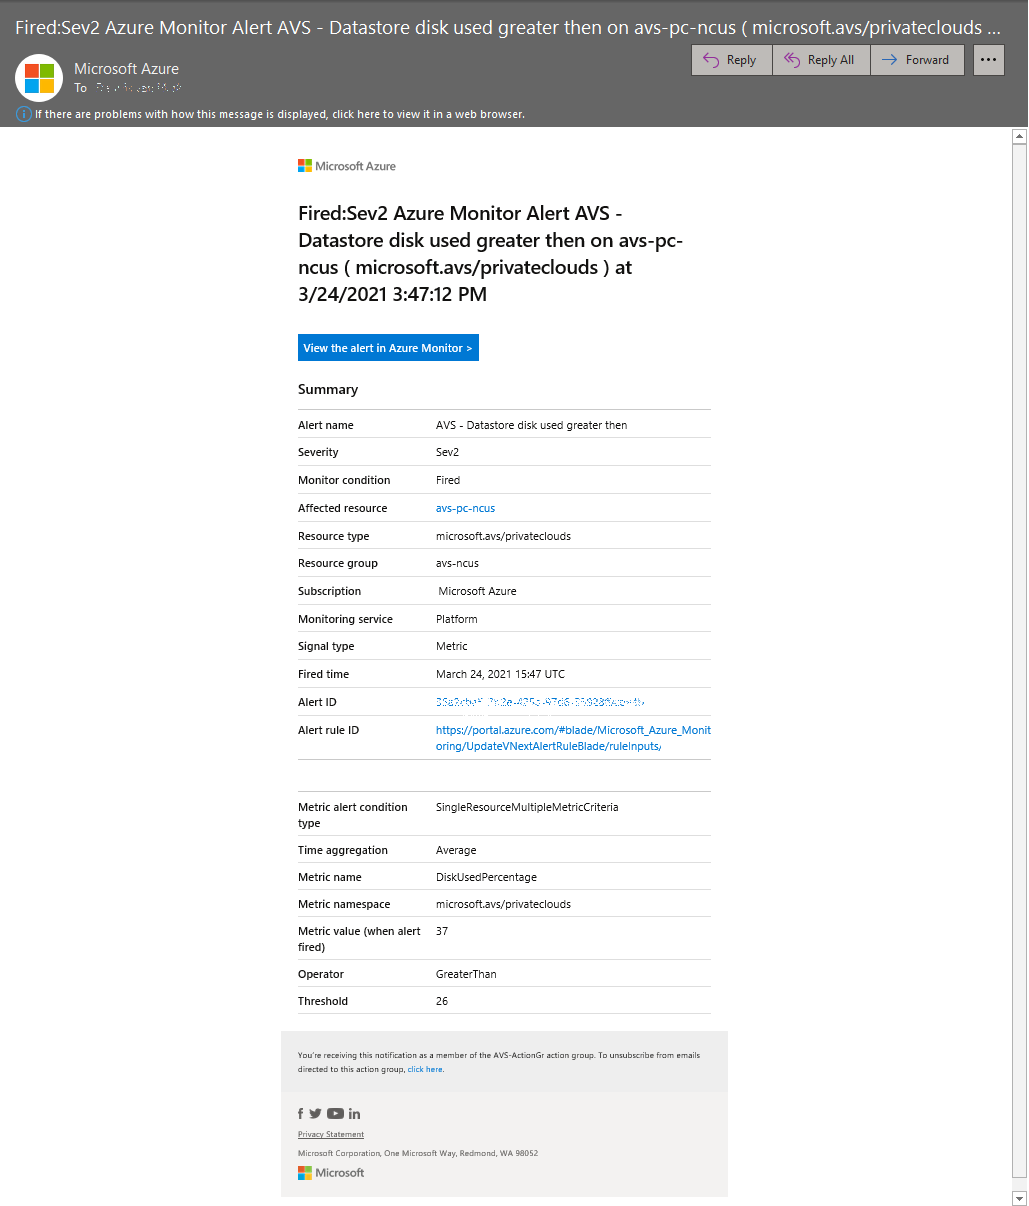
Depending on the configured Action Group, you receive a notification through the configured medium. In our example, we configured email.


Work with metrics
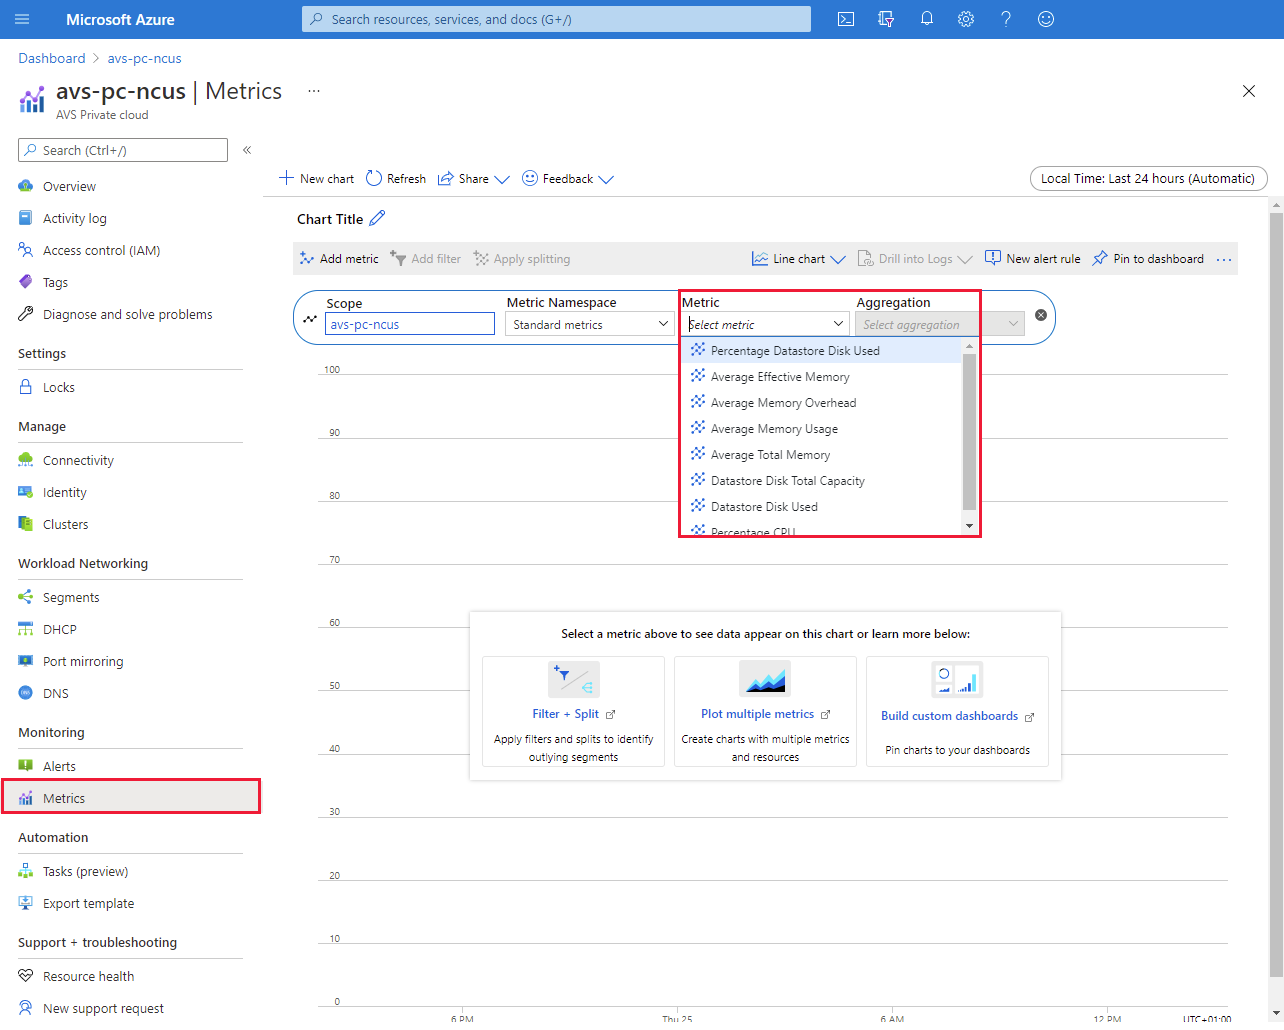
From your Azure VMware Solution private cloud, select Monitoring > Metrics. Then select the metric you want from the drop-down.
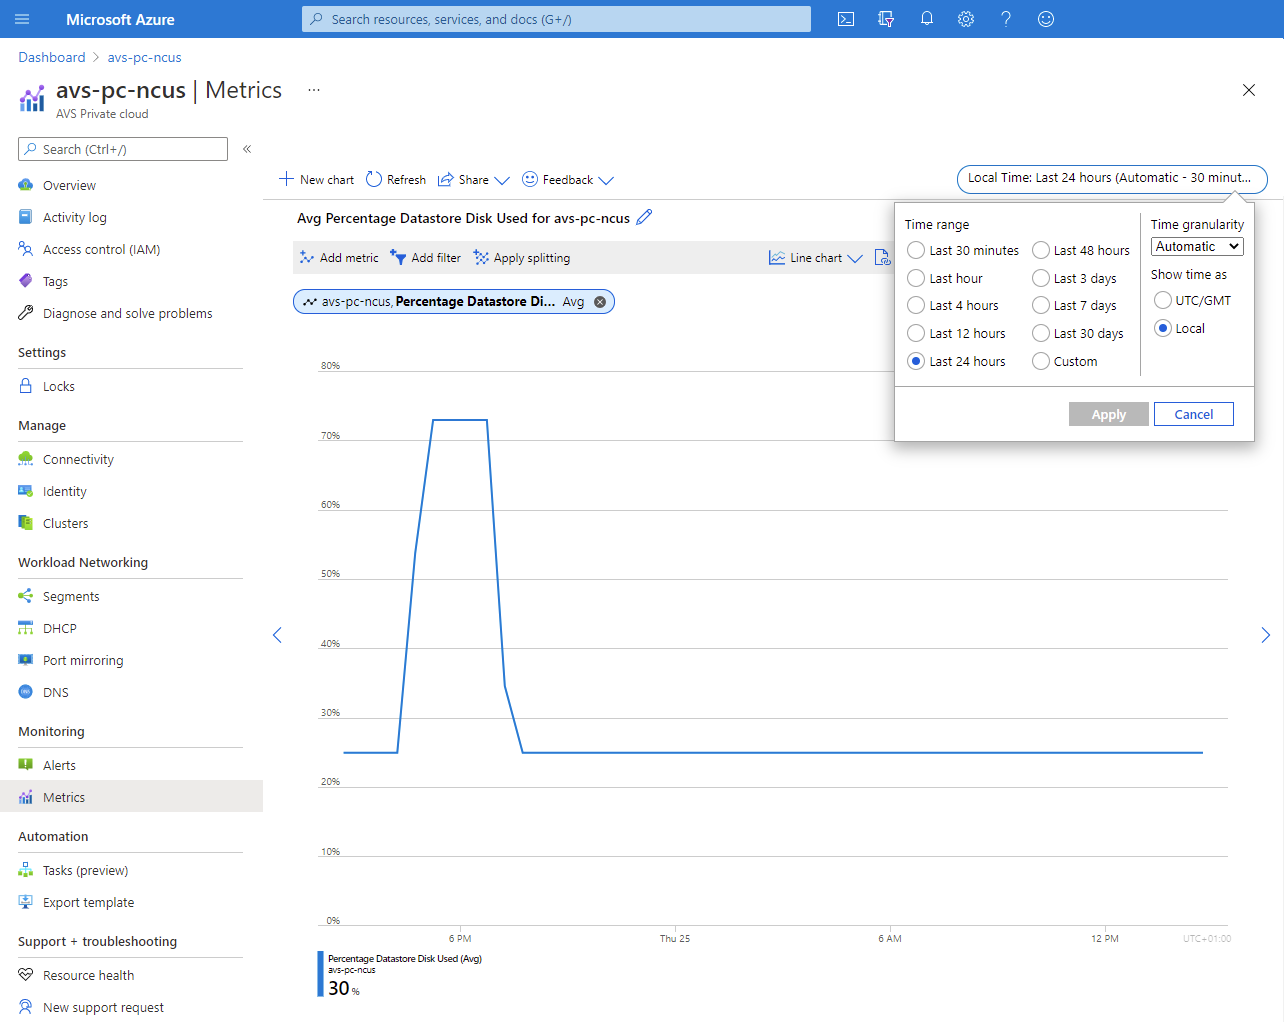
You can change the diagram's parameters, such as the Time range or the Time granularity.
Other options are:
- Drill into Logs and query the data in the related Log Analytics workspace
- Pin this diagram to an Azure Dashboard for convenience.


Next steps
Now that you configured an alert rule for your Azure VMware Solution private cloud, you can learn more about:
You can also continue with one of the other Azure VMware Solution how-to guides.
Feedback
Coming soon: Throughout 2024 we will be phasing out GitHub Issues as the feedback mechanism for content and replacing it with a new feedback system. For more information see: https://aka.ms/ContentUserFeedback.
Submit and view feedback for