Note
Access to this page requires authorization. You can try signing in or changing directories.
Access to this page requires authorization. You can try changing directories.
This article is part of the "SAP extend and innovate data: Best practices" article series.
- Identify SAP data sources
- Choose the best SAP connector
- Performance and troubleshooting for SAP data extraction
- Data integration security for SAP on Azure
- SAP data integration generic architecture
There are many ways to connect to the SAP system for data integration. The sections below describes general and connector-specific considerations and recommendations.
Performance
It's important to configure optimal settings for the source and target so you can achieve the best performance during data extraction and processing.
General considerations
- Ensure the correct SAP parameters are set for a max concurrent connection.
- Consider using the SAP Group logon type for better performance and load distribution.
- Ensure that the self-hosted integration runtime (SHIR) virtual machine is sized adequately and is highly available.
- When you work with large datasets, check if the connector you're using provides a partitioning capability. Many of the SAP connectors support partitioning and parallelizing capabilities to speed up data loads. When you use this method, data is packaged into smaller chunks that can be loaded by using several parallel processes. For more information, see connector-specific documentation.
General recommendations
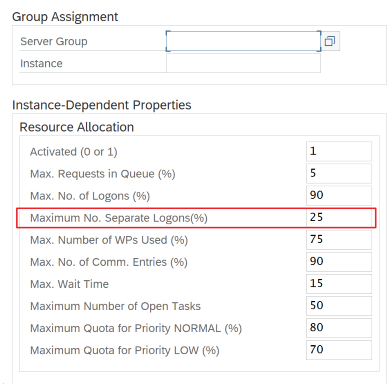
Use the SAP transaction RZ12 to modify values for max concurrent connections.
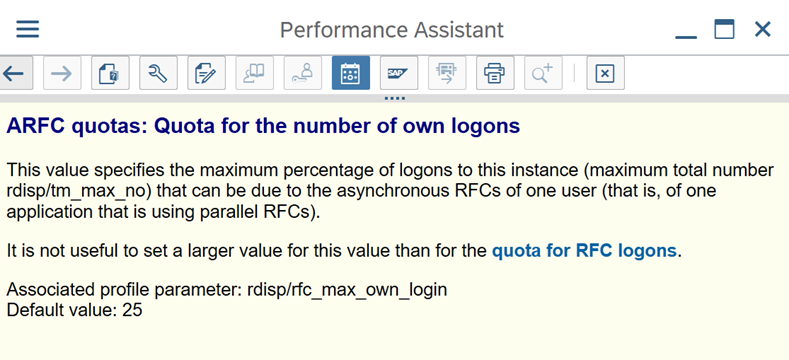
SAP parameters for RFC - RZ12: The following parameter can restrict the number of RFC calls that are allowed for one user or one application, so ensure that this restriction isn't causing a bottleneck.
Connection to SAP by using Logon Group: SHIR (self-hosted integration runtime) should connect to SAP by using an SAP Logon Group (via message server) and not to a specific application server to ensure a workload distribution across all available application servers.
Note
Dataflow Spark cluster and SHIR are powerful. Many internal SAP copy activities, for example 16, can be triggered and executed. But if the SAP server's concurrent connection number is small, for example 8, the perf reads data from the SAP side.
Start with 4vCPUs and 16-GB VMs for SHIR. The following steps show the connection of the dialog work process in SAP with SHIR.
- Check if the customer uses a poor physical machine to set up and install SHIR to run an internal SAP copy.
- Go to the Azure Data Factory portal and find the related SAP CDC linked service that's used in the data flow. Check the referenced SHIR name.
- Check the CPU, memory, network, and disk settings of the physical machine where SHIR is installed.
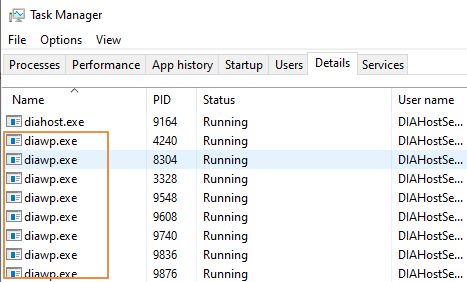
- Check how many
diawp.exeare running on the SHIR machine. Onediawp.execan run one copy activity. The number ofdiawp.exeis based on the machine's CPU, memory, network, and disk settings.
If you want to run multiple partitions in parallel on SHIR at the same time, use a powerful virtual machine to set up SHIR. Or use scale out by using SHIR high availability and scalability features to have multiple nodes. For more information, see High availability and scalability.
Partitions
The following section describes the partitioning process for an SAP CDC connector. The process is the same for an SAP Table and SAP BW Open Hub connector.

Scaling can be performed on the self-hosted IR or the Azure IR depending on your performance requirements. Review the CPU consumption of the SHIR to view metrics to help you decide on your scaling approach. The SHIR can be vertically or horizontally scaled based on your needs. We recommend that you deploy the Azure IR at a lower SKU. Scale up to meet your performance requirements as determined through load testing, rather than starting at the higher end unnecessarily.
Note
If you're reaching 70% capacity, scale up or scale out for SHIR.

Partitioning is useful for initial or large full loads and is typically not required for delta loads. If you don't specify the partition, by default, 1 "producer" in the SAP system (typically one batch process) fetches the source data into the operational data queue (ODQ), and SHIR fetches the data from ODQ. By default, SHIR uses four threads to fetch the data from ODQ, so potentially four dialog processes are occupied in SAP at that time.
The idea of partitioning is to split a large initial dataset into multiple smaller disjointed subsets that are ideally equal in size and that can be processed in parallel. This method reduces the time it takes to produce the data from the source table into the ODQ in a linear way. This method assumes that there are sufficient resources on the SAP side to handle the load.
Note
- The number of partitions executed in parallel are limited by the number of driver cores in the Azure IR. A resolution for this limitation is currently underway.
- Each unit or package in SAP transaction ODQMON is a single file in the staging folder.
Design considerations when running the pipelines using CDC
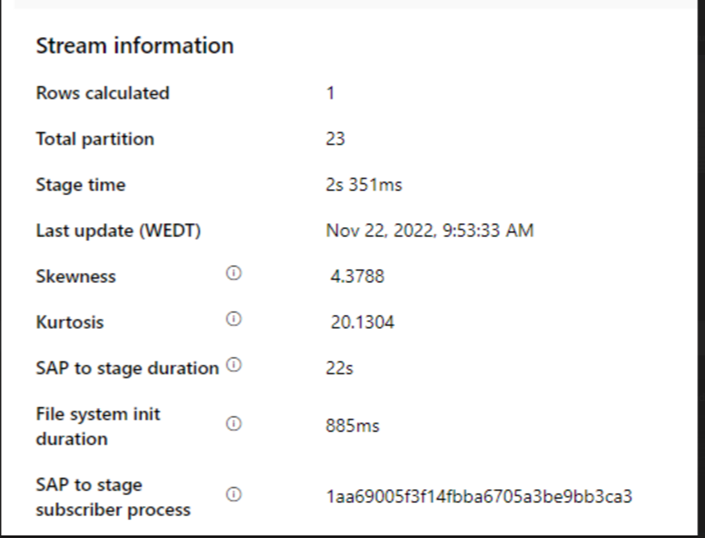
Check the SAP to stage duration.
Check the runtime performance in the sink.
Consider using the partitioning feature to enhance performance for better throughput.
If the SAP to stage duration is slow, consider resizing SHIR to higher specifications.
Check if the sink processing time is too slow.
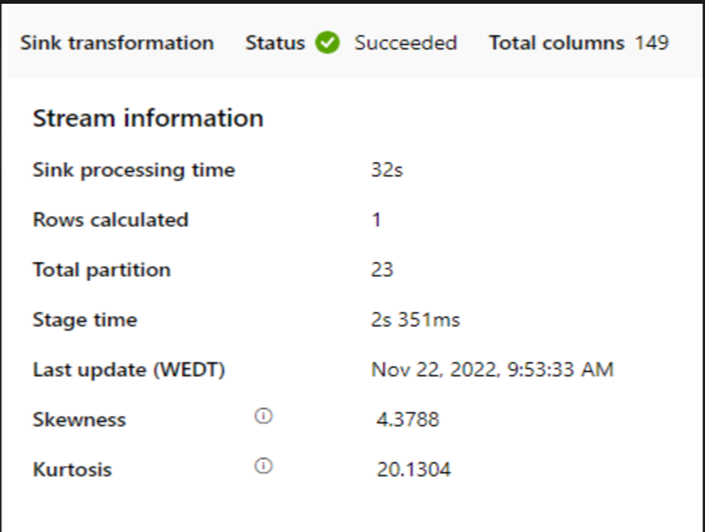
If a small cluster is used to run the mapping data flow, it could affect the performance at the sink. Use a large cluster, for example 16 + 256 cores, so the perf reads the data from the stage and writes into the sink.
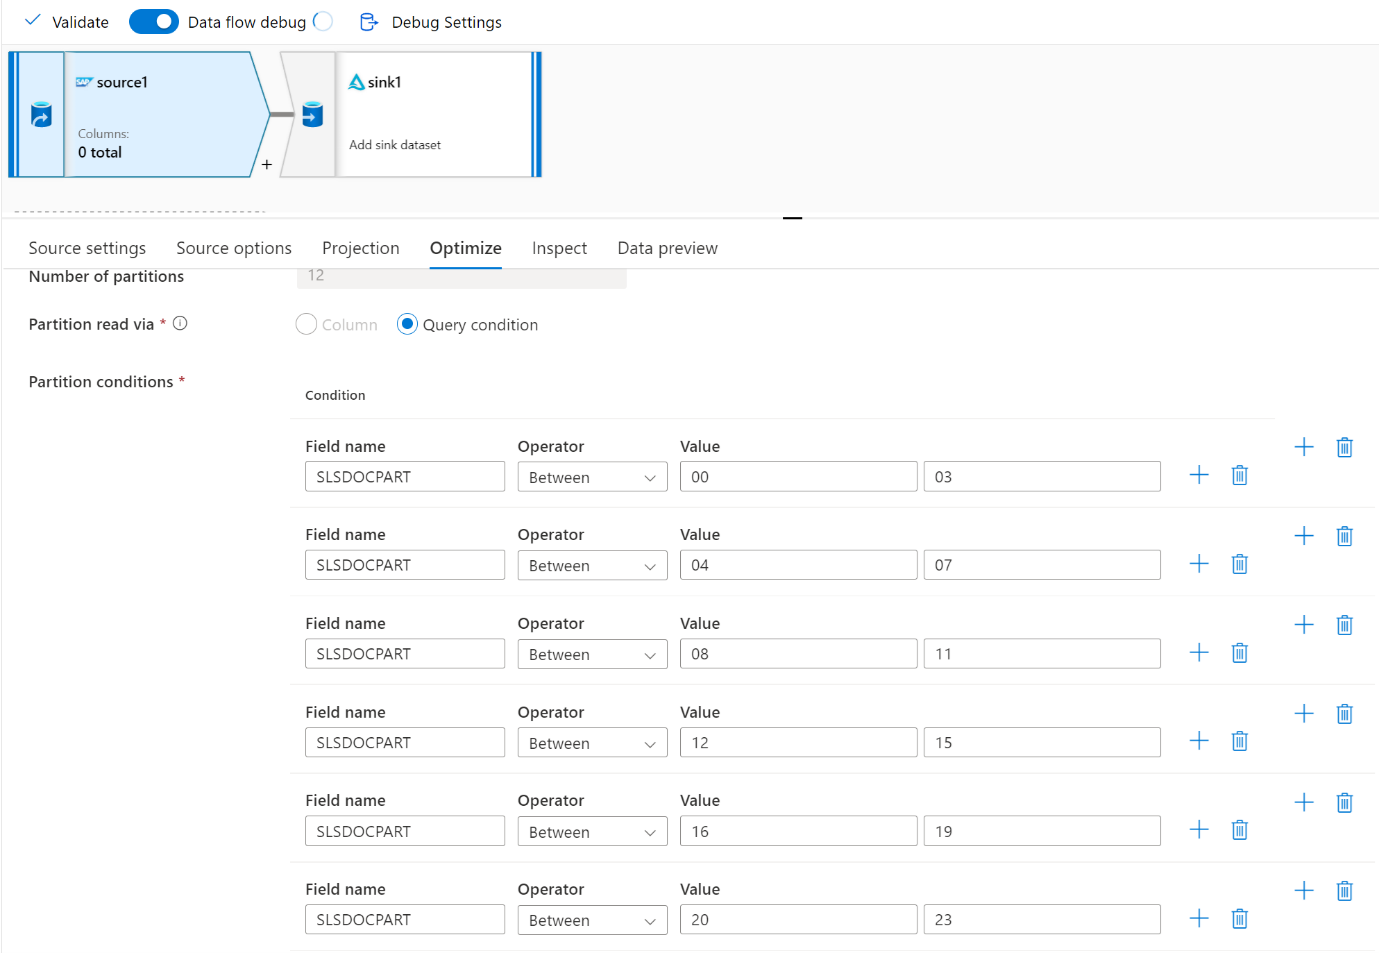
For large data volumes, we recommend partitioning the load to run parallel jobs, but keep the number of partitions less than or equal to the Azure IR core, also called the Spark cluster core.
Use the Optimize tab to define the partitions. You can use source partitioning in the CDC connector.
Note
- There's a direct correlation between the number of partitions with SHIR cores and Azure IR nodes.
- The SAP CDC connector is listed as Odata subscriber type "Odata access for Operational Data Provisioning" under ODQMON in the SAP system.
Design considerations when using a Table connector
- Optimize the partitioning for better performance.
- Consider the degree of parallelism from SAP Table.
- Consider a single file design for the target sink.
- Benchmark the throughput when you use large data volumes.
Design recommendations when using a Table connector
Partition: When you partition in the SAP Table connector, it splits one underlying select statement into several by using where clauses are on a suitable field, for example a field with high cardinality. If your SAP table has a large volume of data, enable partitioning to split the data into smaller partitions. Try to optimize the number of partitions (parameter
maxPartitionsNumber) so that the partitions are small enough to avoid memory dumps in SAP but large enough to speed up extraction.Parallelism: The degree of copy parallelism (parameter
parallelCopies) works in tandem with partitioning and instructs the SHIR to make parallel RFC calls to the SAP system. For example, if you set this parameter to 4, the service concurrently generates and runs four queries based on your specified partition option and settings. Each query retrieves a portion of data from your SAP table.For optimum results, the number of partitions should be a multiple of the number of the degree of copy parallelism.
When you copy data from SAP Table to binary sinks, the actual parallel count is automatically adjusted based on the amount of memory that's available in SHIR. Record the SHIR VM size for each test cycle, the degree of copy parallelism, and the number of partitions. Observe the performance of the SHIR VM, the performance of the source SAP system, and the desired vs. the actual degree of parallelism. Use an iterative process to identify the optimum settings and the ideal size for the SHIR VM. Consider all ingestion pipelines that simultaneously load data from one or multiple SAP systems.
Note the observed number of RFC calls to SAP against the configured degree of parallelism. If the number of RFC calls to SAP is less than the degree of parallelism, verify that the SHIR VM has enough memory and CPU resources available. Choose a larger virtual machine if necessary. The source SAP system is configured to limit the number of parallel connections. For more information, see the General recommendations section in this article.
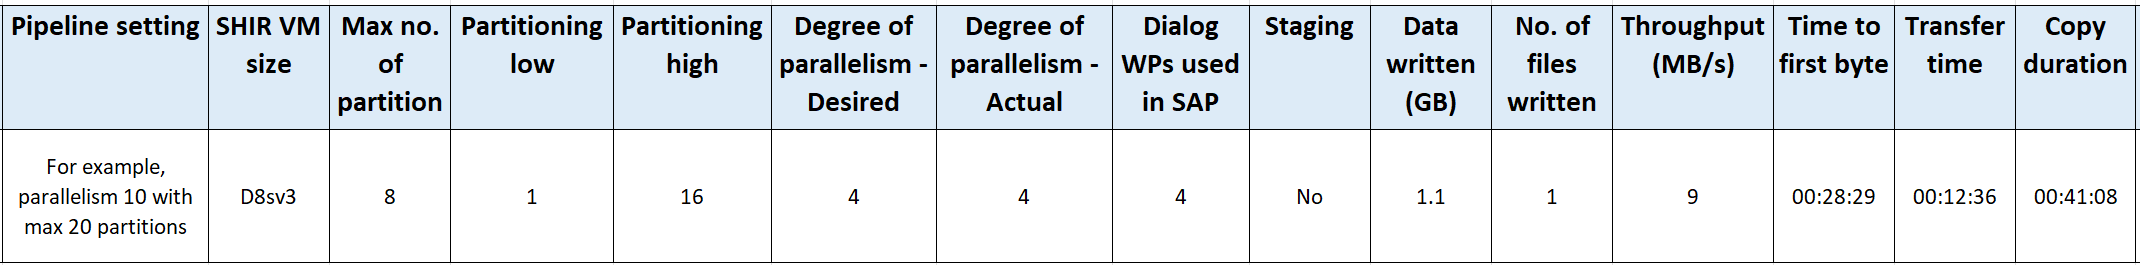
Number of files: When you copy data into a file-based data store and the targeted sink is configured to be a folder, multiple files are generated by default. If you set the
fileNameproperty in the sink, the data is written to a single file. It's recommended that you write to a folder as multiple files because it obtains a higher write throughput compared to writing to a single file.Performance benchmark: We recommend using the performance benchmarking exercise to ingest large amounts of data. This method varies parameters, such as partitioning, degree of parallelism, and the number of files to determine the optimum setting for the given architecture, volume, and type of data. Gather data from tests in the following format.

Troubleshooting
For slow or failing extraction from the SAP system, use SAP logs from SM37 and match them with the readings in Data Factory.
If only one batch job is triggered, set the SAP source partitions to have performance improvement in the mapping data flow in Data Factory. For more information, see step 6 in Map data flow properties.
If multiple batch jobs are triggered in the SAP system and there's a significant difference between each batch job's start time, change the size of Azure IR. When you increase the number of driver nodes in Azure IR, the parallelism of batch jobs in the SAP side increase.
Note
The maximum number of driver nodes for Azure IR is 16. Each driver node can only trigger one batch processes.
Check the logs in SHIR. To view logs, go to SHIR VM. Open Event viewer > Applications and service logs > Connectors > Integration runtime.
To send logs to support, go to SHIR VM. Open the Integration Runtime configuration manager > Diagnostic > Send Logs. This action sends the logs from the last seven days and provides you with a report ID. You need this report ID and RunId of your run. Document the report ID for future reference.
When you use the SAP CDC connector in an SLT scenario:
Ensure that prerequisites are met. Roles are required for the SAP Landscape Transformation (SLT) user, for example ADFSLTUSER in OLTP systems or ECC for SLT replication to work. For more information, see What authorizations and roles are needed.
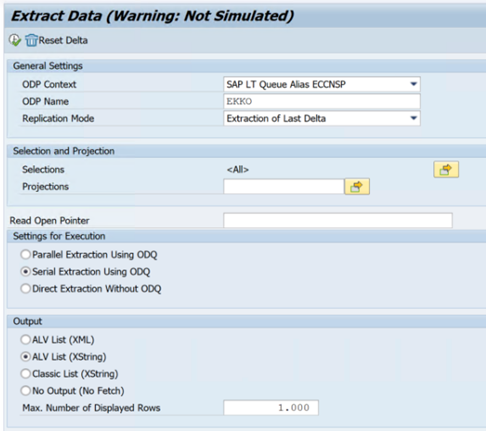
If errors occur in an SLT scenario, see the recommendations for analysis. Isolate and test the scenario within the SAP solution first. For example, test it outside of Data Factory by running the test program provided by SAP
RODPS_REPL_TESTin SE38. If the issue is on the SAP side, you get the same error when you use the report. You can analyze the data extraction in SAP by using the transaction codeODQMON.If the replication works when you use this test report, but not with Data Factory, contact Azure or Data Factory support.
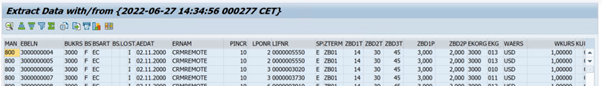
The following example shows a report for
RODPS_REPL_TESTin SE38: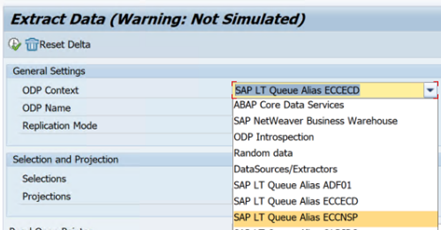
The following example shows the transaction code
ODQMON: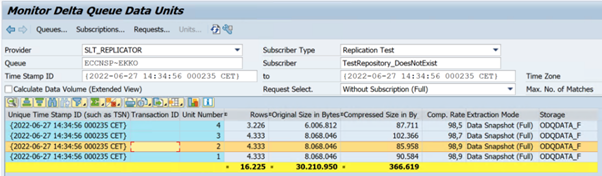
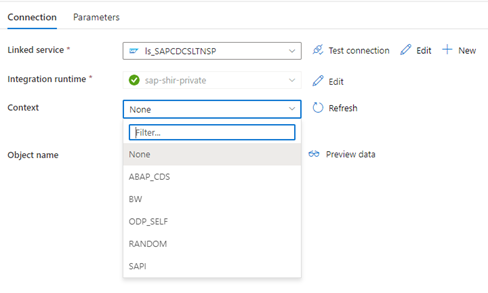
When the Data Factory linked service connects to the SLT system, it doesn't show the SLT mass transfer IDs when you refresh the Context field.
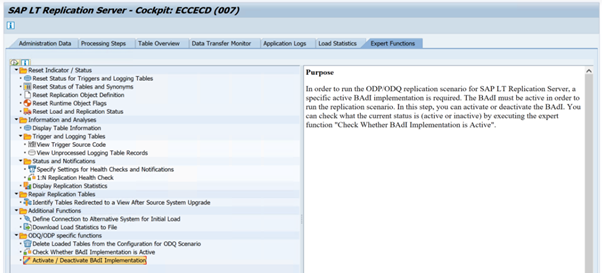
To run the ODP/ODQ replication scenario for the SAP LT Replication Server, activate the following business add-in (BAdI) implementation.
BAdI:
BADI_ODQ_QUEUE_MODELEnhancement implementation:
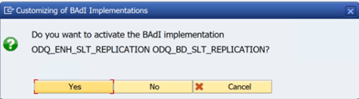
ODQ_ENH_SLT_REPLICATIONIn transaction LTRC, go to the Expert Function tab and select Activate / Deactivate BAdI Implementation to activate the implementation.
Select Yes.
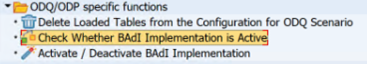
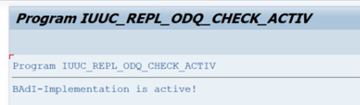
In the ODQ/ODP specific functions folder, select Check Whether BAdI Implementation is Active.
The dialog shows the program activity.
Reset subscriptions. To start with a fresh extraction or stop replication data, remove the subscription in the ODQMON. This action also removes entries from LTRC. After resetting the subscription, it might take a couple of minutes before you see the effect in LTRC. Schedule Operational Data Provisioning (ODP) housekeeping jobs to keep the delta queues clean, for example
ODQ_CLEANUP_CLIENT_004CDS_VIEW (DHCDCMON transaction). As of S/4HANA 1909, SAP replicates data from CDS views that uses data-based triggers instead of date columns. The concept is similar to SLT, but instead of using the LTRC transaction to monitor it, you use the DHCDCMON transaction.
SLT troubleshooting
SLT Replication Server provides real-time data replication from SAP sources and/or non-SAP sources to SAP targets and/or non-SAP targets. There are three types of toolsets to monitor the extraction from SLT to Azure.
- ODQMON is the overall monitoring tool for data extraction. Start the analysis with ODQMON to track data inconsistencies, initial performance analysis, and open subscription and extraction requests.
- LTRC is the transaction to use to check performance analysis. It’s useful if you have data replication issues from the source system to ODP because you can monitor the dataflow and find inconsistencies.
- SM37 provides detailed monitoring of each SLT extraction step.
The normal housekeeping should be done using ODQMON where you can manage the subscription directly and you should not use LTRC for the same.
You might encounter problems when extracting data from SLT, such as:
The extraction doesn't run. Check if the SAP CDC connection created a connection in ODQMON, and check if the subscription exists.
Data inconsistencies. Check ODQMON to see the individual request of data and confirm that you can see data there. If you can see the data in ODQMON but not in Azure Synapse or Data Factory, the investigation should happen on the Azure side. If you can't see the data in ODQMON, perform an analysis of the SLT framework by using LTRC.
Performance problems. Data extraction is a two step approach. First, SLT reads data from the source system and transfers it to ODP. Second, the SAP CDC connector picks up the data from ODP and transfers it to the chosen data store. The LTRC transaction lets you analyze the first part of the extraction process. To analyze the data extraction from ODP to Azure, use ODQMON and Data Factory or Synapse monitoring tools.
Note
For more information, see these resources:
SLT performance
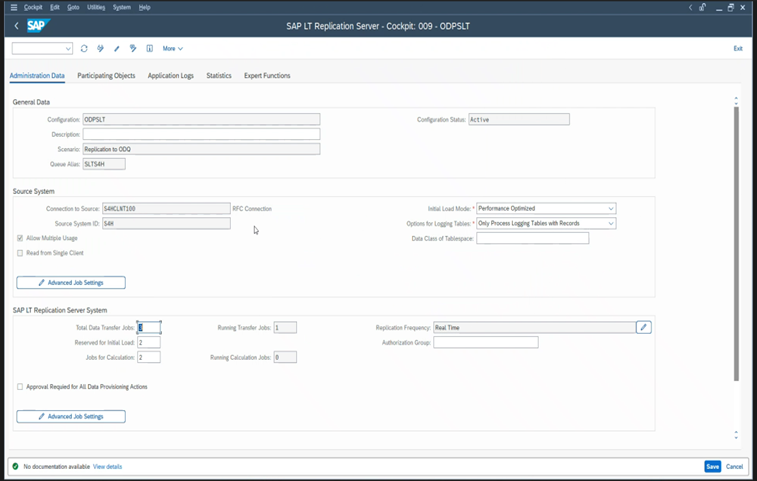
In the initial load mode (ODPSLT), there are three steps to extract data from SLT into ODP:
- Create migration objects. This process only takes a couple of seconds.
- Access the plan calculation that splits the source table into smaller chunks. This step depends on the initial load mode that you select during the SLT configuration and the size of the table. The resource-optimized option is recommended.
- The data load transfers the data from the source system to ODP.
Each step is controlled by the background jobs. You can use the SM37 and LTRC transactions to monitor the duration. If your system is overused, the background jobs might start later because there aren’t enough free batch work processes. When tasks are idle, performance suffers.
If the access plan calculation takes a long time and your initial load mode is set to "performance optimized", change it to "resource optimized" and rerun the extraction. If the data load takes a long time, increase the number of parallel threads in the configuration.
If you use a standalone architecture for SLT replication (dedicated SLT replication server), the network throughput between the source system and replication server might affect the extraction performance.
For replication:
- Ensure that you have enough data transfer jobs that aren't reserved for the initial load.
- Check that you don’t have an unprocessed logging table record in the load statistics.
- Ensure that the replication option is set to real-time.
Advanced replication settings are available in LTRS. For more information, see the SLT troubleshooting guide.
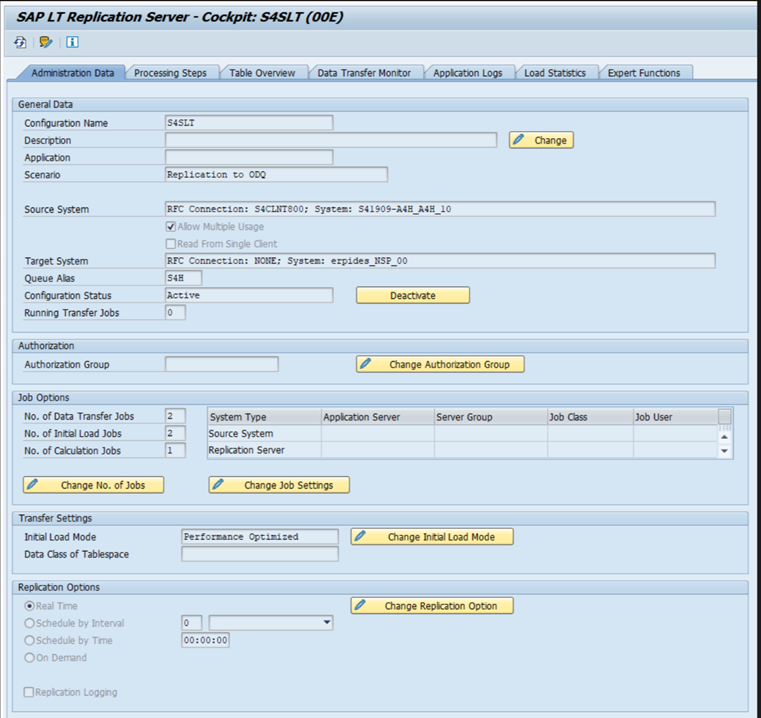
Different SAP releases have different LTRC user interfaces. The following screenshots show the same page for two different releases.
SAP S/4HANA:
SAP ECC:


Monitor
For information about monitoring the SAP data extraction, see these resources: