Note
Access to this page requires authorization. You can try signing in or changing directories.
Access to this page requires authorization. You can try changing directories.
Applies to: Azure Logic Apps (Consumption + Standard)
Note
The Azure Monitor Logs connector replaces the Azure Log Analytics connector and the Azure Application Insights connector. This connector provides the same functionality as the other connectors and is the preferred method for running a query against a Log Analytics workspace or an Application Insights resource. For example, when you connect to your Application Insights resource, you don't have to create or provide an application ID and API key. Authentication is integrated with Microsoft Entra ID.
To build workflows in Azure Logic Apps that retrieve data from a Log Analytics workspace or an Application Insights resource in Azure Monitor, you can use the Azure Monitor Logs connector.
For example, you can create a logic app workflow that sends Azure Monitor log data in an email message from your Office 365 Outlook account, create a bug in Azure DevOps, or post a Slack message. This connector provides only actions, so to start a workflow, you can use a Recurrence trigger to specify a simple schedule or any trigger from another service.
This guide describes how to build a logic app workflow that sends the results of an Azure Monitor log query by email.
Connector technical reference
For technical information about this connector's operations, see the connector's reference documentation.
Both of the following actions can run a log query against a Log Analytics workspace or Application Insights resource. The difference exists in the way that data is returned.
| Action | Description |
|---|---|
| Run query and list results | Returns each row as its own object. Use this action when you want to work with each row separately in the rest of the workflow. The action is typically followed by a For each action. |
| Run query and visualize results | Returns a JPG file that depicts the query result set. This action lets you use the result set in the rest of the workflow by sending the results in an email, for example. The action only returns a JPG file if the query returns results. |
Limitations
The connector has the following limits, which your workflow might reach, based on the query that you use and the size of the results:
Limit Value Notes Max query response size ~16.7 MB or 16 MiB The connector infrastructure dictates that the size limit is set lower than the query API limit. Max number of records 500,000 records Max connector timeout 110 seconds Max query timeout 100 seconds To avoid reaching these limits, try aggregating data to reduce the results size, or adjusting the workflow recurrence to run more frequently across a smaller time range.
Visualizations on the Logs page and the connector use different charting libraries. So, the connector currently doesn't include some functionality.
Prerequisites
An Azure account and subscription. If you don't have an Azure subscription, sign up for a free Azure account.
The Log Analytics workspace or Application Insights resource that you want to connect.
The Standard or Consumption logic app workflow from where you want to access your Log Analytics workspace or Application Insights resource. To use an Azure Monitor Logs action, start your workflow with any trigger. This guide uses the Recurrence trigger.
An Office 365 Outlook account to complete the example in this guide. Otherwise, you can use any email provider that has an available connector in Azure Logic Apps.
Add an Azure Monitor Logs action
In the Azure portal, open your Standard logic app and workflow in the designer.
In your workflow where you want to add the Azure Monitor Logs action, follow these general steps to add an Azure Monitor Logs action.
This example continues with the action named Run query and visualize results.
In the connection information pane, provide the following information:
Property Description Connection Name A name for the connection Authentication Type The authentication type to use for the connection. For more information, see Add authentication to outbound calls. Tenant ID Your Microsoft Entra tenant. Note: The account associated with the current connection is used later to send the email. When you're done, select Sign in or Create New, based on the selected authentication type.
In the Run query and visualize results action box, provide the following information:
Property Required Value Description Subscription Yes <Azure-subscription> The Azure subscription for your Log Analytics workspace or Application Insights application. Resource Group Yes <Azure-resource-group> The Azure resource group for your Log Analytics workspace or Application Insights application. Resource Type Yes Log Analytics Workspace or Application Insights The resource type to connect from your workflow. This example continues by selecting Log Analytics Workspace. Resource Name Yes <Azure-resource-name> The name for your Log Analytics workspace or Application Insights resource. In the Query box, enter the following Kusto query to retrieve the specified log data from the following sources:
Note
When you create your own queries, make sure they work correctly in Log Analytics before you add them to your Azure Monitor Logs action.
Log Analytics workspace
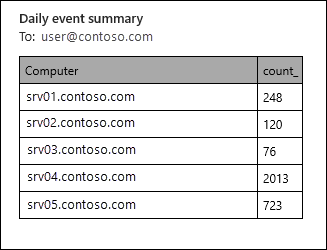
The following example query selects errors that occurred within the last day, reports their total number, and sorts them in ascending order.
Event
| where EventLevelName == "Error"
| where TimeGenerated > ago(1day)
| summarize TotalErrors=count() by Computer
| sort by Computer asc
Application Insights resource
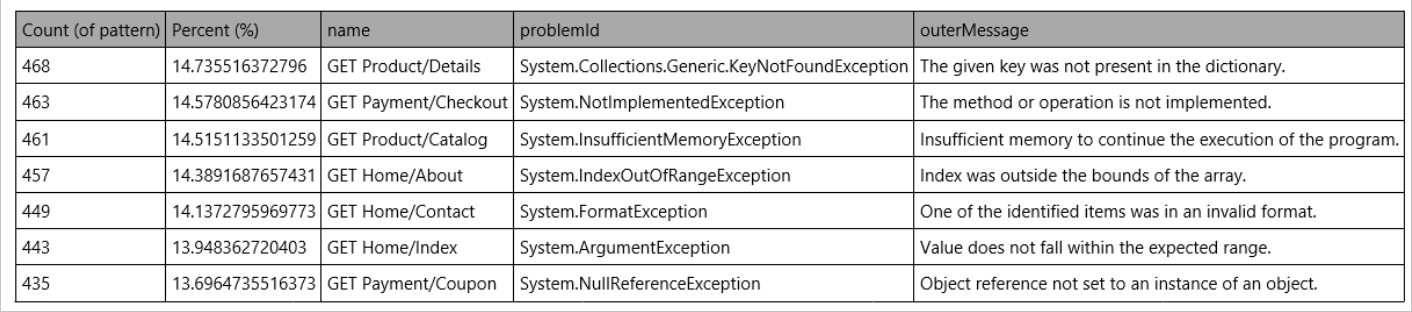
The following example query selects the failed requests within the last day and correlates them with exceptions that occurred as part of the operation, based on the
operation_Ididentifier. The query then segments the results by using theautocluster()algorithm.requests | where timestamp > ago(1d) | where success == "False" | project name, operation_Id | join ( exceptions | project problemId, outerMessage, operation_Id ) on operation_Id | evaluate autocluster()
For Time Range, select Set in query.
The following table describes the options for Time Range:
Time Range Description Exact Dynamically provide the start time and end time. Relative Set the relative value such as the last hour, last 12 hours, and so on. Set in query Applies when the TimeGenerated filter is included in query. For Chart Type, select Html Table.
Save your workflow. On the designer toolbar, select Save.
Add an email action
In your workflow where you want to add the Office 365 Outlook action, follow these general steps to add the Office 365 Outlook action named Send an email (V2)
In the To box, enter the recipient's email address. For this example, use your own email address.
In the Subject box, enter a subject for the email, for example, Top daily errors or failures.
Select inside the Body box, and then select the Dynamic content option (lightning icon), so that you can select outputs from previous steps in the workflow.
In the dynamic content list, under Run query and visualize results, select Body, which represents the results of the query that you previously entered in the Log Analytics action.
From the Advanced parameters list, select Attachments.
The Send an email action now includes the Attachments section with the Attachment name and Attachment content properties.
For the added properties, follow these steps:
In the Attachment name box, open the dynamic content list. Under Run query and visualize results, select Attachment Name.
In the Attachment content box, open the dynamic content list. Under Run query and visualize results, select Attachment Content.
Save your workflow. On the designer toolbar, select Save.
Test your workflow
On the workflow designer toolbar, select Run > Run.
When the workflow completes, check your email.
Note
The workflow generates an email with a JPG file that shows the query result set. If your query doesn't return any results, the workflow won't create a JPG file.
For the Log Analytics workspace example, the email that you receive has a body that looks similar to the following example:
For an Application Insights resource, the email that you receive has a body that looks similar to the following example: