Note
Access to this page requires authorization. You can try signing in or changing directories.
Access to this page requires authorization. You can try changing directories.
Azure Cosmos DB insights provide a view of the overall performance, failures, capacity, and operational health of all your Azure Cosmos DB resources in a unified interactive experience. This article helps you understand the benefits of this new monitoring experience, and how you can modify and adapt the experience to fit the unique needs of your organization.
Introduction
Before you begin, you should understand how information is presented and visualized.
It delivers:
- At-scale perspective of your Azure Cosmos DB resources across all your subscriptions in a single location. You can selectively scope to only the subscriptions and resources that you're interested in evaluating.
- Drill-down analysis of a particular Azure Cosmos DB resource. You can diagnose issues or perform detailed analysis by using the categories of utilization, failures, capacity, and operations. Selecting any one of the options provides an in-depth view of the relevant Azure Cosmos DB metrics.
- Customizable experience built on top of Azure Monitor workbook templates. You can change what metrics are displayed, modify or set thresholds that align with your limits, and then save into a custom workbook. Charts in the workbooks can then be pinned to Azure dashboards.
This feature doesn't require you to enable or configure anything. These Azure Cosmos DB metrics are collected by default.
Note
There's no charge to access this feature. Charges apply only for the Azure Monitor essential features that you configure or enable, as described on the Azure Monitor pricing details page.
View insights from Azure portal
Sign in to the Azure portal and navigate to your Azure Cosmos DB account.
You can view your account metrics either from the Metrics pane or the Insights pane.
Metrics: This pane provides numerical metrics that are collected at regular intervals and describes some aspect of a system at a particular time. For example, you can view and monitor the server side latency metric, normalized request unit usage metric, etc.
Insights: This pane provides a customized monitoring experience for Azure Cosmos DB. Insights use the same metrics and logs that are collected in Azure Monitor and show an aggregated view for your account.
Open the Insights pane. By default, the Insights pane shows the throughput, requests, storage, availability, latency, system, and management operations metrics. The pane shows these metrics for every container in your account. You can select the Time Range, Database, and Container for which you want to view insights. The Overview tab shows RU/s usage, data usage, index usage, throttled requests, and normalized RU/s consumption for the selected database and container.
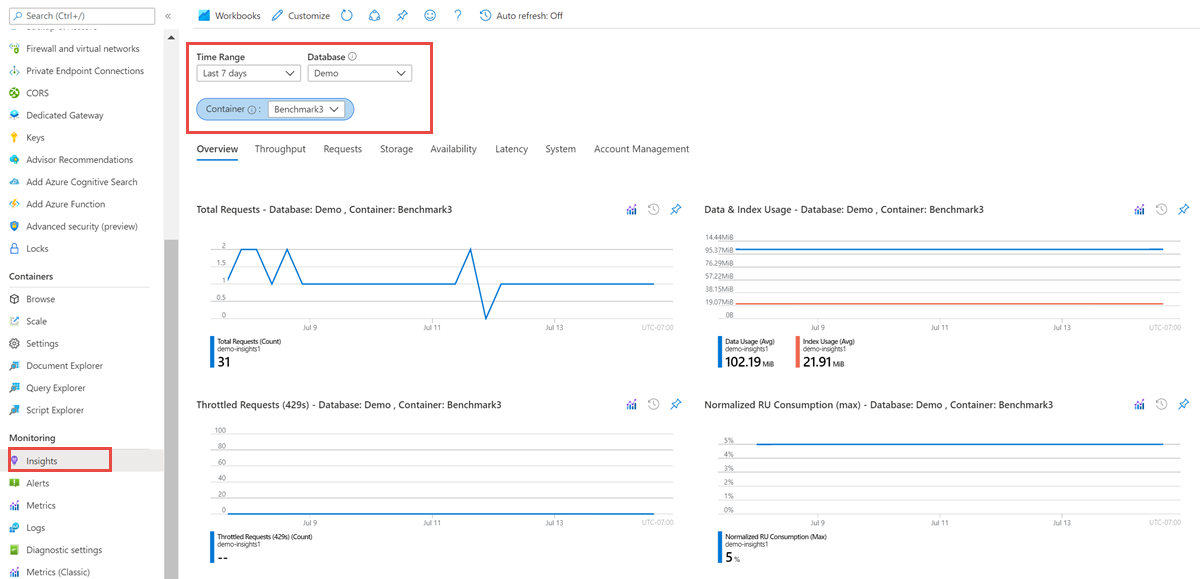
The following metrics are available from the Insights pane:
Throughput. This tab displays the total number of request units consumed or that failed (429 response code) due to exceeding the throughput or storage capacity provisioned for the container.
Requests. This tab shows the total number of requests processed by status code, by operation type, and the count of failed requests (429 response code). Requests fail when the throughput or storage capacity provisioned for the container exceeds.
Storage. This tab shows the size of data and index usage over the selected time period.
Availability. This tab shows the percentage of successful requests over the total requests per hour. The Azure Cosmos DB service level agreements (SLAs) define the success rate.
Latency. This tab shows the read and write latency observed by Azure Cosmos DB in the region where your account is operating. You can visualize latency across regions for a geo-replicated account. You can also view server-side latency by different operations. This metric doesn't represent the end-to-end request latency.
System. This tab shows how many metadata requests that the primary partition serves. It also helps to identify the throttled requests.
Management Operations. This tab shows the metrics for account management activities such as account creation, deletion, key updates, network and replication settings.

View utilization and performance metrics for Azure Cosmos DB
To view the utilization and performance of your storage accounts across all your subscriptions:
Sign in to the Azure portal.
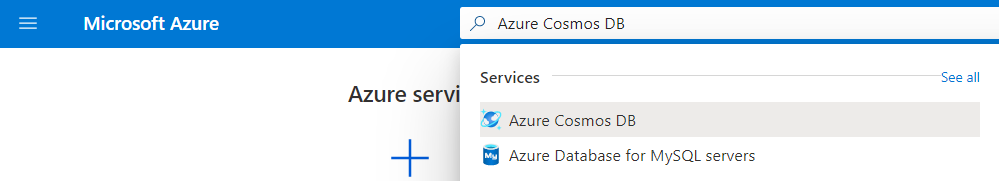
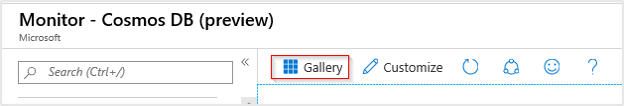
Search for Monitor and select Monitor.
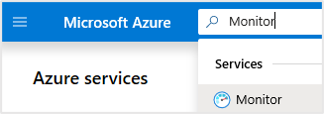
Select Azure Cosmos DB.
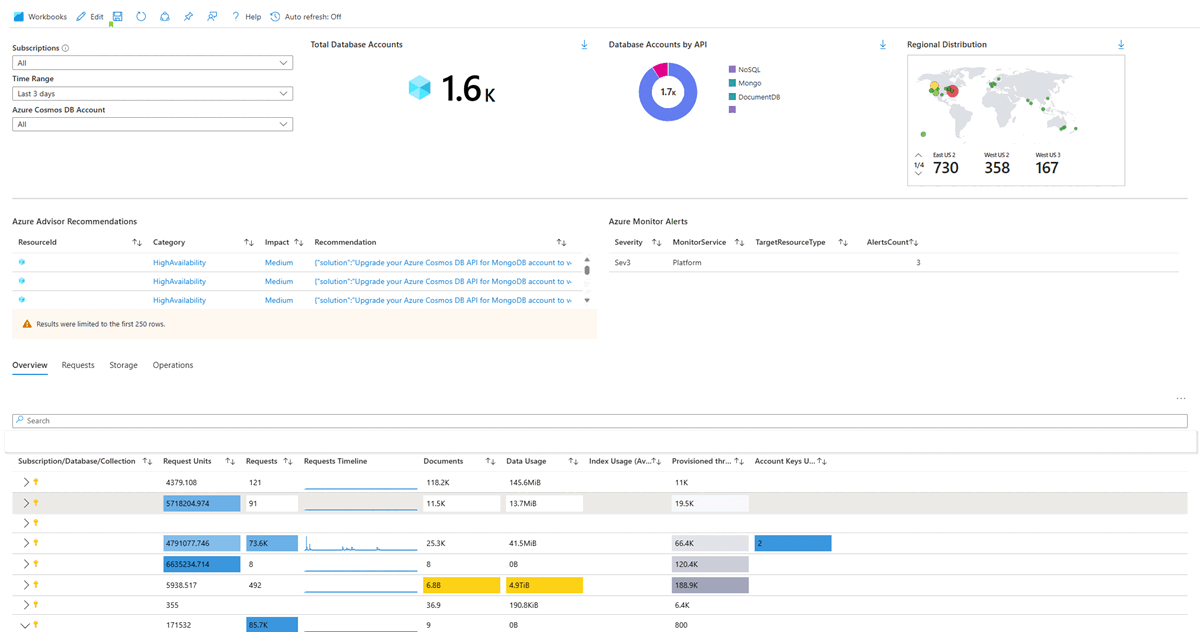
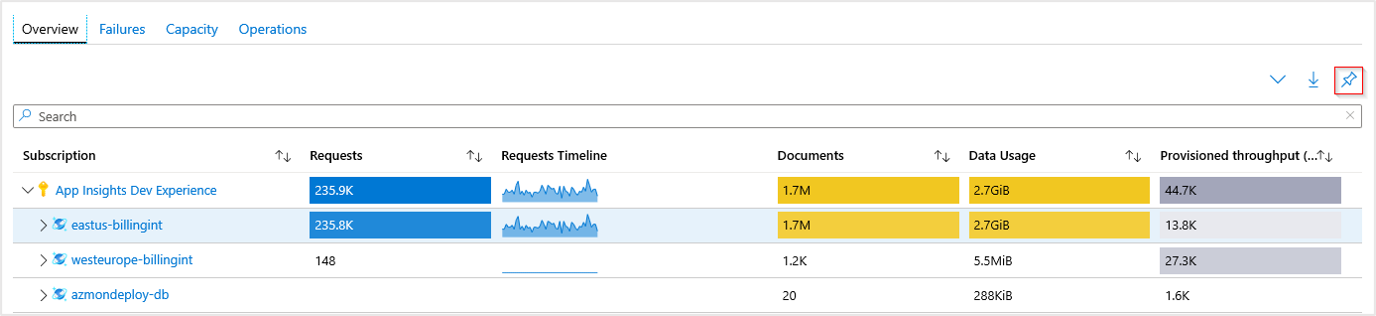
Overview
On the Overview page, the table displays interactive Azure Cosmos DB metrics. You can filter the results based on the options you select from the following dropdown lists:
- Subscriptions: Only subscriptions that have an Azure Cosmos DB resource are listed.
- Azure Cosmos DB: You can select all, a subset, or a single Azure Cosmos DB resource.
- Time Range: By default, the last four hours of information are displayed based on the corresponding selections made.
The counter tile under the dropdown lists rolls up the total number of Azure Cosmos DB resources that are in the selected subscriptions. Conditional color-coding or heatmaps for columns in the workbook report transaction metrics. The deepest color has the highest value. A lighter color is based on the lowest values.
Select a dropdown arrow next to one of the Azure Cosmos DB resources to reveal a breakdown of the performance metrics at the individual database container level.
Select the Azure Cosmos DB resource name highlighted in blue to go to the default Overview for the associated Azure Cosmos DB account.
Failures
Select the Requests tab to open the Requests portion of the workbook template. It shows you the total requests with the distribution of responses that make up those requests:
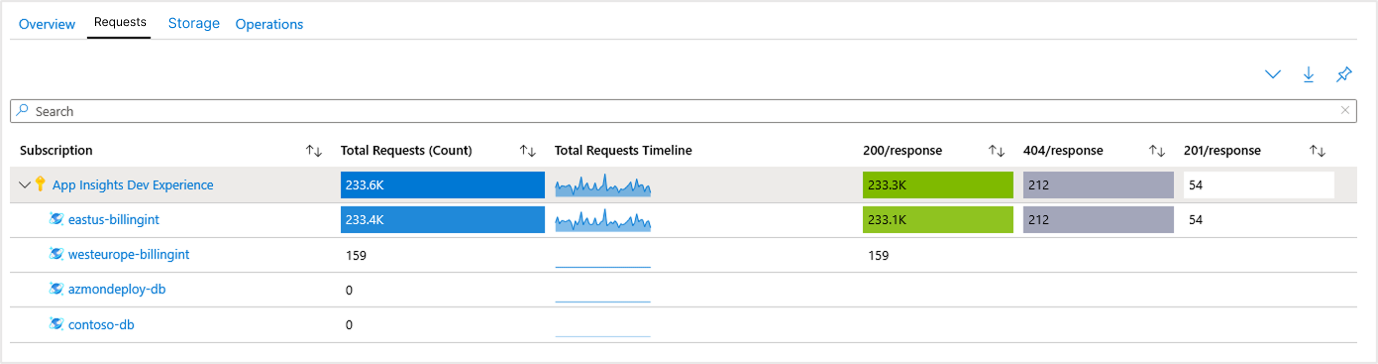
| Code | Description |
|---|---|
200 OK |
One of the following REST operations were successful: GET on a resource. PUT on a resource. POST on a resource. POST on a stored procedure resource to execute the stored procedure. |
201 Created |
A POST operation to create a resource is successful. |
404 Not Found |
The operation attempts to act on a resource that no longer exists. For example, the resource could be deleted. |
For a full list of status codes, see HTTP status codes for Azure Cosmos DB.
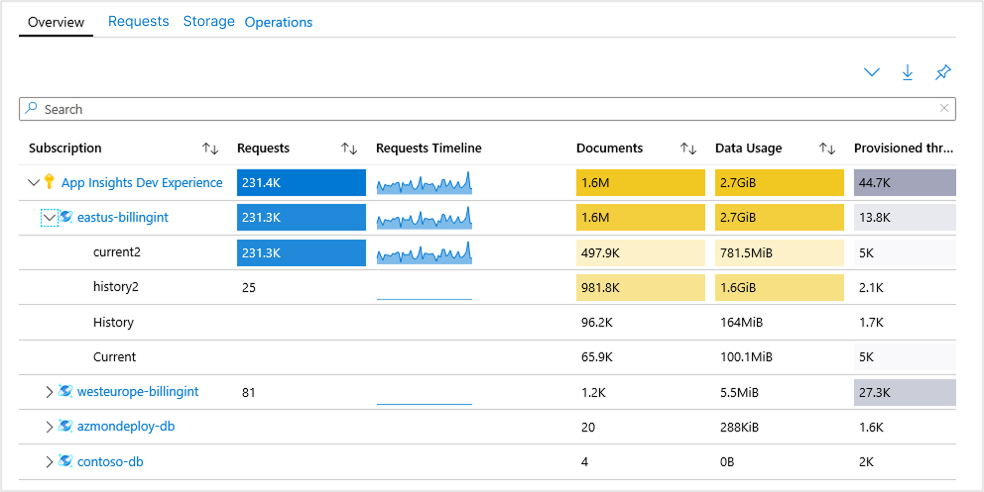
Storage
Select the Storage tab to open the Storage portion of the workbook template. It shows you:
- Quantity of documents you have.
- Document growth over time.
- Current Data usage.
- Total amount of available storage that you have remaining.
This information helps you to identify potential storage and data utilization issues.
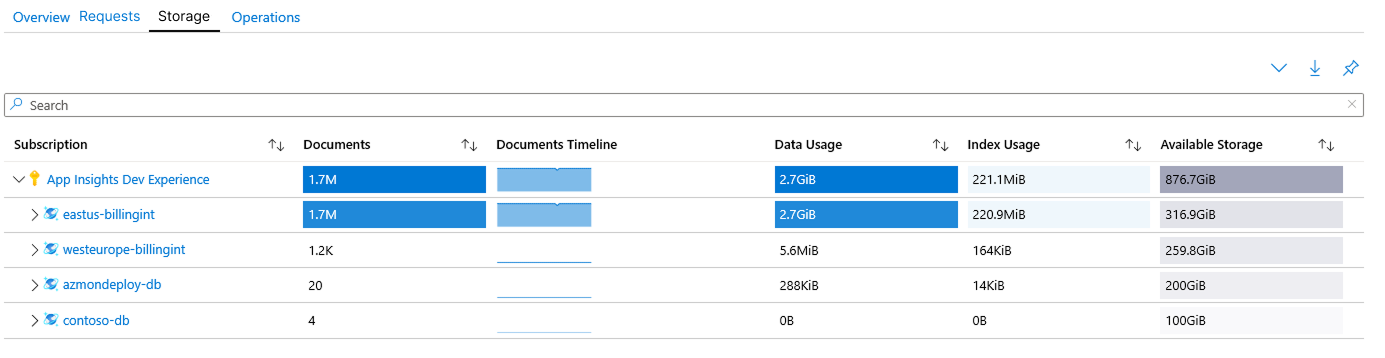
As with the Overview workbook, selecting the dropdown next to an Azure Cosmos DB resource in the Subscription column reveals a breakdown by the individual containers that make up the database.
Operations
Select the Operations tab to open the Operations portion of the workbook template. You can see your requests broken down by the type of requests made.
In the following example, you see that eastus-billingint is predominantly receiving read requests, but with a few upsert and create requests. You can also see that westeurope-billingint is read-only from a request perspective, at least over the past four hours that the workbook is currently scoped to via its time range parameter.
View from an Azure Cosmos DB resource
Search for or select any of your existing Azure Cosmos DB accounts.
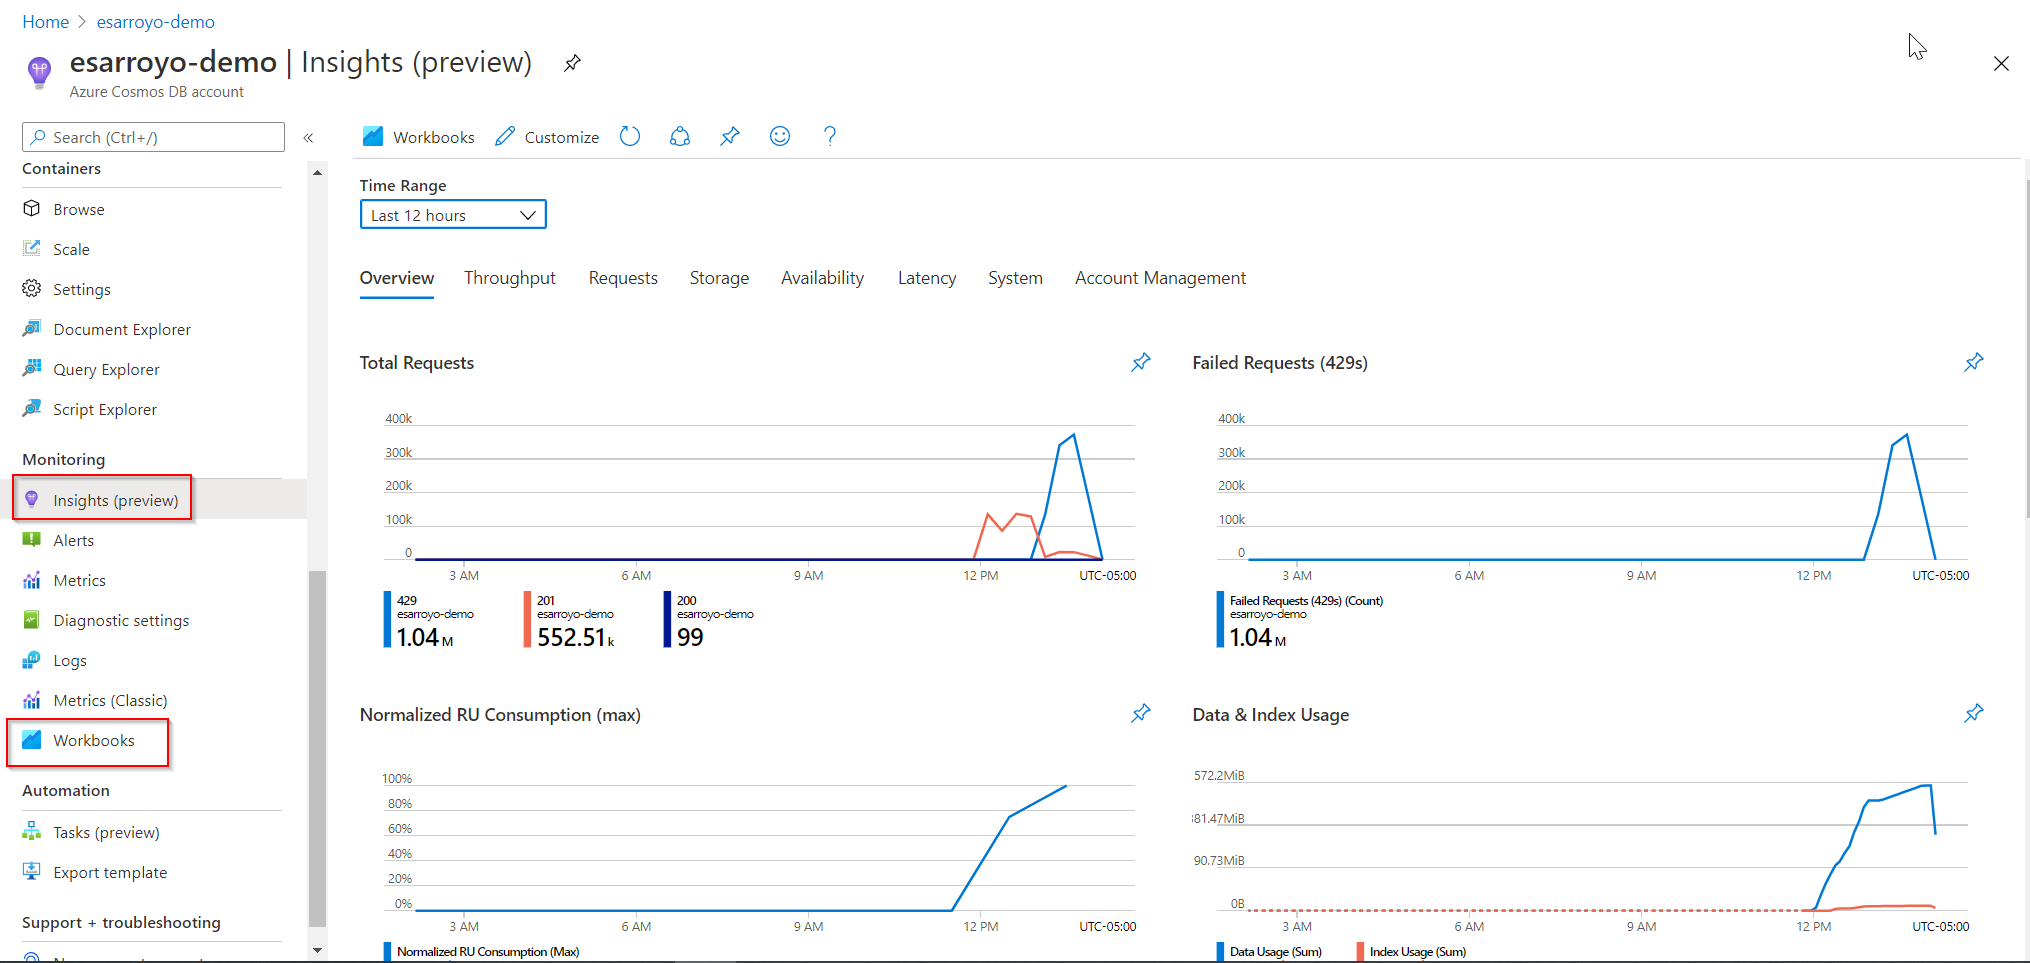
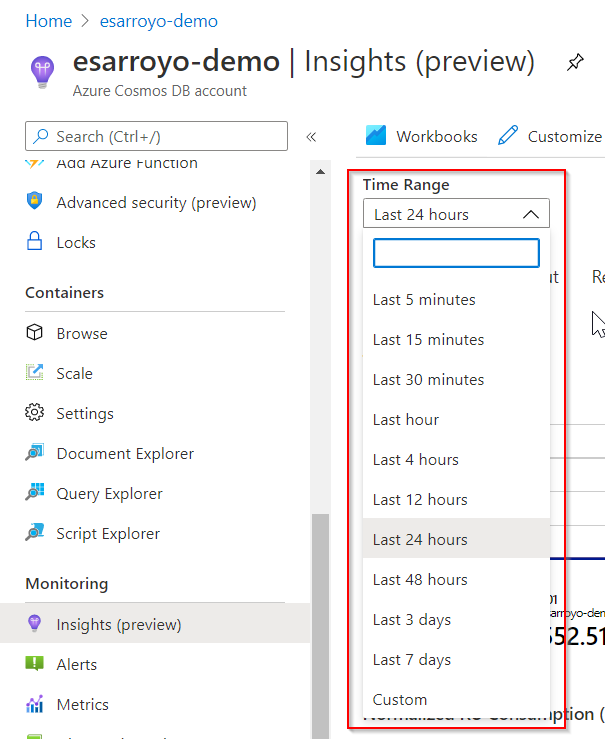
After navigating to your Azure Cosmos DB account, go to the Monitoring section and select Insights (preview) or Workbooks. These options allow you to analyze throughput, requests, storage, availability, latency, system, and account management.
Time range
By default, the Time Range field displays data from the last 24 hours. You can modify the time range to display data anywhere from the last five minutes to the last seven days. The time range selector also includes a Custom mode. Enter the start/end dates to view a custom time frame based on available data for the selected account.
Insights overview
The Overview tab provides the most common metrics for the selected Azure Cosmos DB account, including:
Total Requests
Failed Requests (429 responses)
Normalized RU Consumption (max)
Data & Index Usage
Azure Cosmos DB Account Metrics by Collection
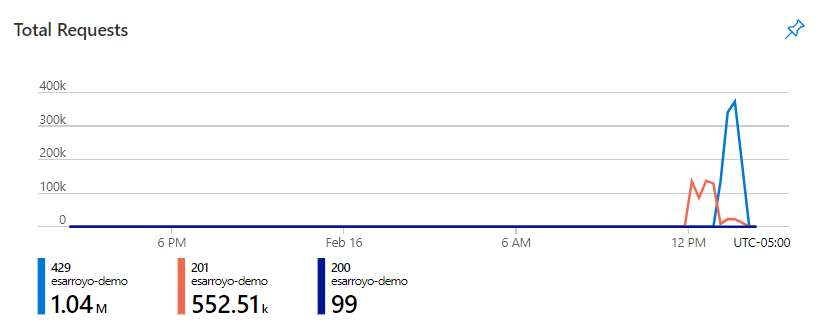
Total Requests: This graph provides a view of the total requests for the account broken down by status code. The units on the graph are a sum of the total requests for the period.
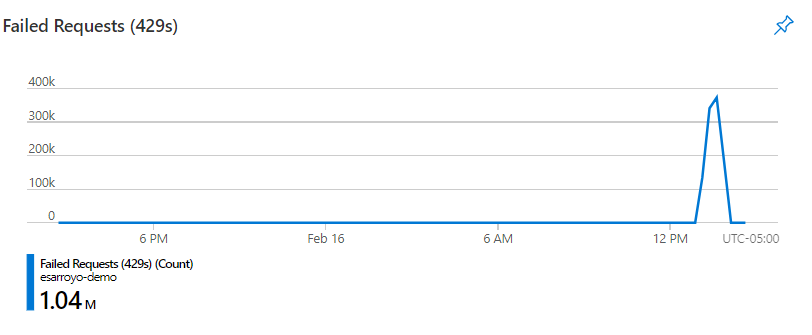
Failed Requests (429s): This graph provides a view of failed requests with a status code of 429. The units on the graph are a sum of the total failed requests for the period.
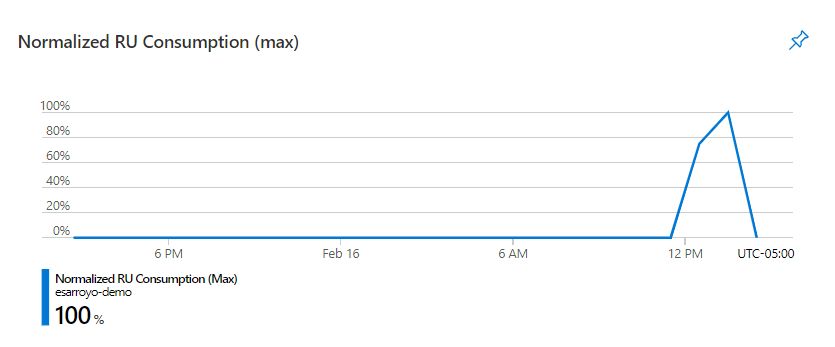
Normalized RU Consumption (max): This graph provides the maximum percentage between 0% and 100% of Normalized RU Consumption units for the specified period.
Customize the metrics
You can pin any one of the metric sections to an Azure dashboard by selecting the pushpin in the upper-right corner of the section.
To export your data into the Excel format, open the context menu.

To expand or collapse all dropdown views in the workbook, open the context menu.

Customize Azure Cosmos DB insights
This experience is built on top of Azure Monitor workbook templates. You can use Customize > Edit > Save to modify and save a copy of your modified version into a custom workbook.

Workbooks are saved within a resource group. The My Reports section is private to you. The Shared Reports section is accessible to everyone with access to the resource group. After you save the custom workbook, you must go to the workbook gallery to start it.
Troubleshooting
For troubleshooting guidance, see Troubleshooting workbook-based insights.
Related content
- Configure metric alerts
- Enable Service Health notifications.
- Create reports with workbooks.