Note
Access to this page requires authorization. You can try signing in or changing directories.
Access to this page requires authorization. You can try changing directories.
Important
Azure Cosmos DB for PostgreSQL is no longer supported for new projects. Don't use this service for new projects. Instead, use one of these two services:
Use Azure Cosmos DB for NoSQL for a distributed database solution designed for high-scale scenarios with a 99.999% availability service level agreement (SLA), instant autoscale, and automatic failover across multiple regions.
Use the Elastic Clusters feature of Azure Database For PostgreSQL for sharded PostgreSQL using the open-source Citus extension.
Audit logging of database activities in Azure Cosmos DB for PostgreSQL is available through the PostgreSQL Audit extension: pgAudit. pgAudit provides detailed session or object audit logging.
If you want Azure resource-level logs for operations like compute and storage scaling, see the Azure Activity Log.
Usage considerations
By default, pgAudit log statements are emitted along with your regular log statements by using Postgres's standard logging facility. In Azure Cosmos DB for PostgreSQL, you can configure all logs to be sent to Azure Monitor Log store for later analytics in Log Analytics.
Installing pgAudit
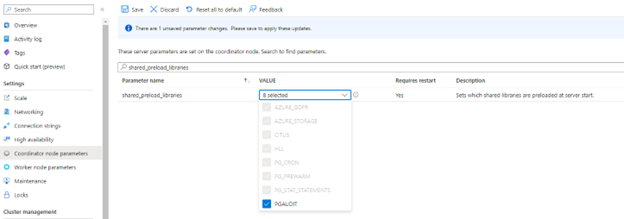
To install pgAudit, you need to include it in the server's shared preload libraries. A change to shared_preload_libraries parameter requires a cluster restart to take effect. Also, pgAudit settings are specified per-node in a cluster. To enable auditing on all nodes, you must apply the audit settings to both coordinator and worker nodes settings.
Using the Azure portal:
Select your Azure Cosmos DB for PostgreSQL cluster.
On the sidebar, select Coordinator (or Worker Node) parameters.
Search for the
shared_preload_librariesparameter.Select pgaudit and save the changes. Your Azure Cosmos DB for PostgreSQL cluster will be restarted.
You can check that pgaudit is loaded in shared_preload_libraries by executing following query in psql:
show shared_preload_libraries;You should see pgaudit in the query result.
Connect to psql and the following query for citus versions equal or newer than 11.0
BEGIN;
SET LOCAL citus.enable_metadata_sync = false;
SELECT create_extension('pgaudit');
COMMIT;
For older versions than citus 11.0:
BEGIN;
SET LOCAL citus.enable_object_propagation= false;
SELECT create_extension('pgaudit');
COMMIT;

pgAudit settings
pgAudit allows you to configure session or object audit logging. Session audit logging emits detailed logs of executed statements. Object audit logging is audit scoped to specific relations. You can choose to set up one or both types of logging.
Once you have enabled pgAudit, you can configure its parameters to start logging. To configure pgAudit, you can follow below instructions. Using the Azure portal:
Select your Azure Cosmos DB for PostgreSQL cluster.
On the sidebar, select Server Parameters.
Search for the
pgauditparameters.Pick appropriate settings parameter to edit. For example, to start logging set
pgaudit.logtoWRITE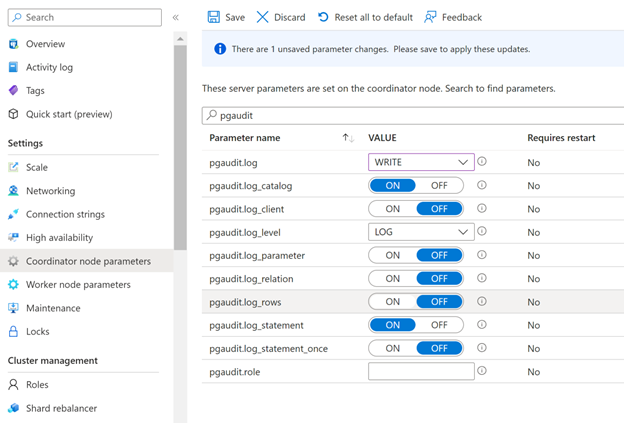
Select Save button to save changes

The pgAudit documentation provides the definition of each parameter. Test the parameters first and confirm that you're getting the expected behavior.
Note
Setting pgaudit.log_client to ON will redirect logs to a client process (like psql) instead of being written to file. This setting should generally be left disabled.
pgaudit.log_level is only enabled when pgaudit.log_client is on.
Note
In Azure Cosmos DB for PostgreSQL, pgaudit.log cannot be set using a - (minus) sign shortcut as described in the pgAudit documentation. All required statement classes (READ, WRITE, etc.) should be individually specified.
Audit log format
Each audit entry is indicated by AUDIT: near the beginning of the log line. The format of the rest of the entry is detailed in the pgAudit documentation.
Viewing audit logs
The way you access the logs depends on which endpoint you choose. For Azure Storage, see the logs storage account article. For Event Hubs, see the stream Azure logs article.
For Azure Monitor Logs, logs are sent to the workspace you selected. The Postgres logs use the AzureDiagnostics collection mode, so they can be queried from the AzureDiagnostics table. The fields in the table are described below. Learn more about querying and alerting in the Azure Monitor Logs query overview.
You can use this query to get started. You can configure alerts based on queries.
Search for all pgAudit entries in Postgres logs for a particular server in the last day
AzureDiagnostics
| where Resource == "myservername"
| where Category == "PostgreSQLlogs"
| where TimeGenerated > ago(1d)
| where Message contains "AUDIT:"