Note
Access to this page requires authorization. You can try signing in or changing directories.
Access to this page requires authorization. You can try changing directories.
Parameters are used as building blocks for filters in Azure Data Explorer dashboards. They're managed in the dashboard scope, and can be added to queries to filter the data presented by the underlying visual. A query can use one or more parameters.
This document describes the creation and use of parameters and linked filters in dashboards. Parameters can be used to filter dashboard visuals either by selecting parameter values in the filter bar or by using cross-filters.
Note
Parameter management is available in Editing mode to dashboard editors.
Prerequisites
- Visualize data with Azure Data Explorer dashboards
- Editor permissions on an Azure Data Explorer dashboard
- A dashboard with visuals
Create a parameter
To create a parameter:
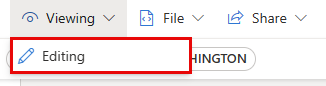
Switch from Viewing to Editing mode.
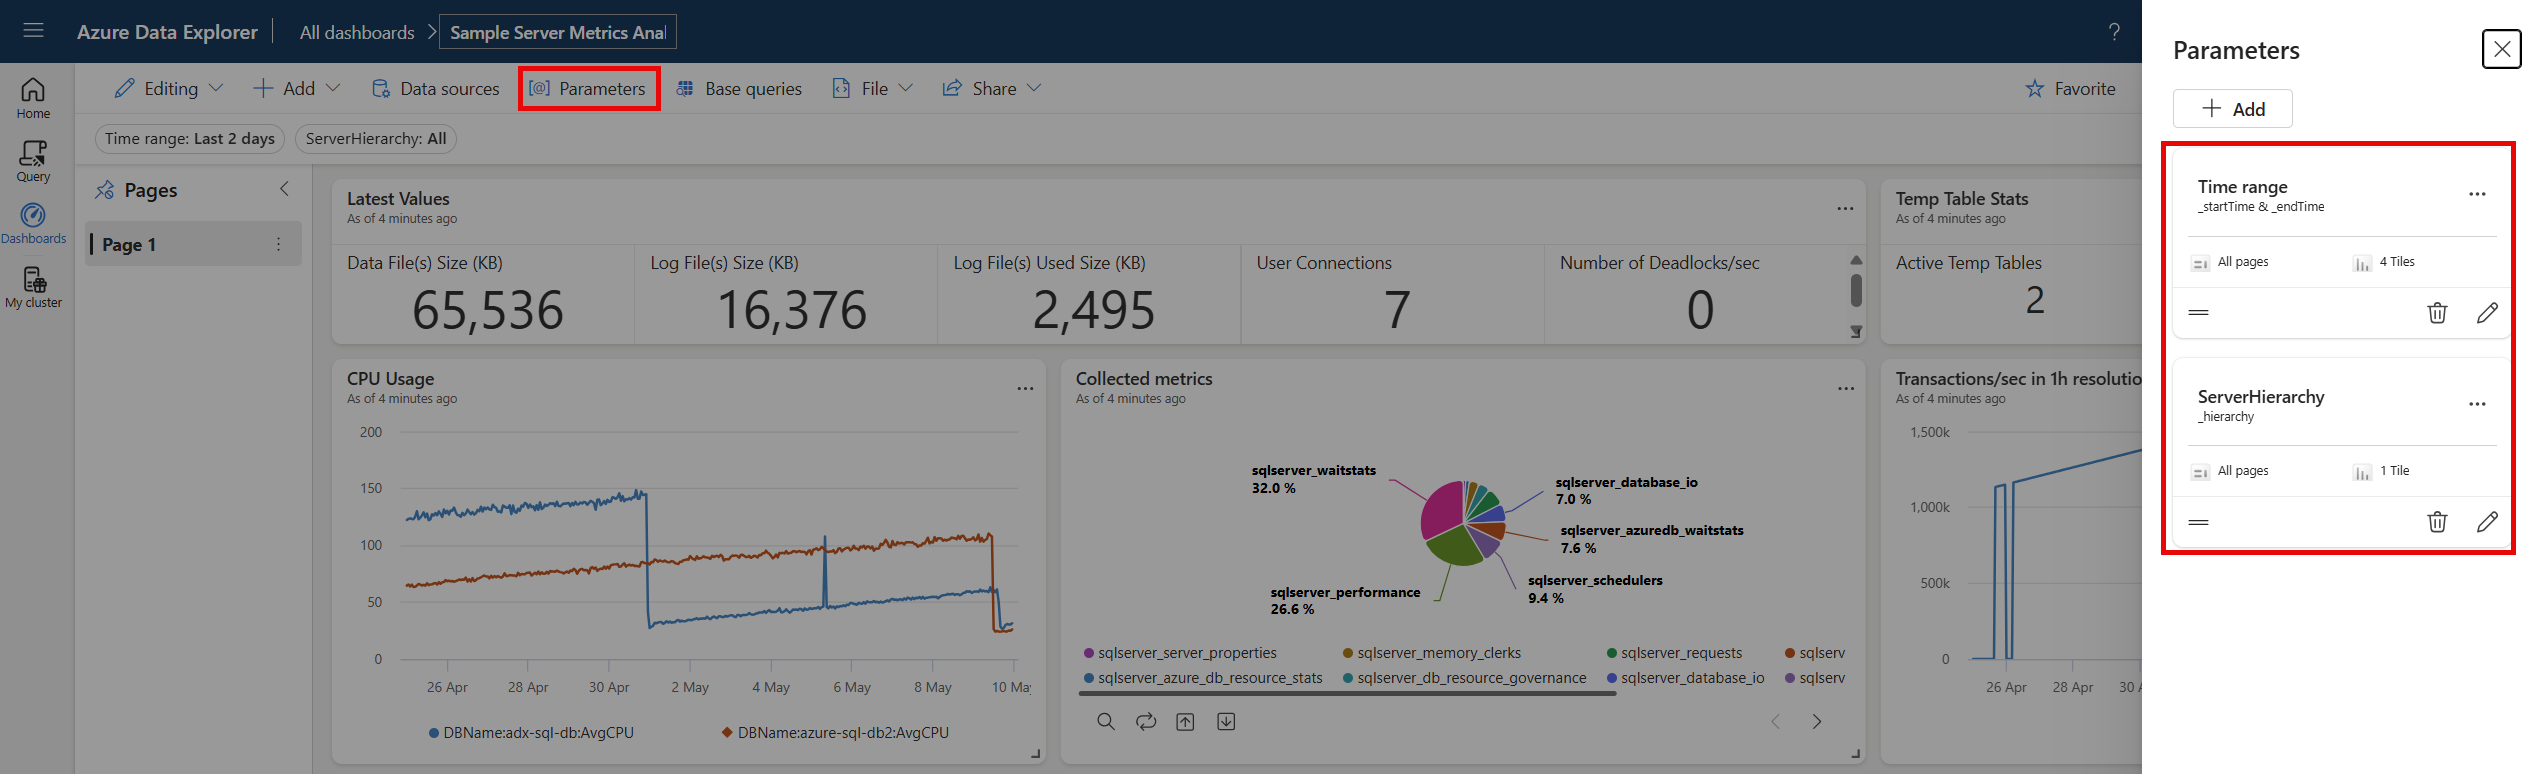
Select the Parameters button in the upper toolbar.

Select the + Add button in the Add parameter side pane.

Fill in the relevant properties for your parameter.

View parameters list
To view the list of all dashboard parameters, select the Parameters button in the upper toolbar.
Supported properties
In the Add parameter side pane, configure the following properties:
| Field | Description |
|---|---|
| Label | The name of the parameter shown on the dashboard or the edit card. |
| Parameter type | One of the following parameters:
|
| Variable name | The name of the parameter to be used in the query. Tip: Prefixing variable names with a distinctive character, such as an underscore character (_), makes them easier to find when writing queries. |
| Data type | The data type of the parameter values. |
| Show on pages | Select the pages where this parameter is displayed. The Select all option shows the parameter on all pages. |
| Source | The source of the parameter values:
|
| Default value | The default value of the filter. The filter always starts with the default value upon initial rendering of the dashboard. |
| Add a "Select all" value | Applicable only to single selection and multiple selection parameter types. Used to retrieve data for all the parameter values. This value should be built into the query to provide the functionality. For more examples of building such queries, see Use the multiple-selection query-based parameter. |
Manage parameters
After selecting Parameters from the upper toolbar, you can view the list of existing parameters. In each parameter card, select the pencil widget to edit the parameter, the trash bin to delete, or select the More [...] menu to Duplicate or move the parameter. Alternatively, the cards can be reordered by drag and drop.

The following indicators can be viewed in the parameter card:
- Parameter display name
- Variable names
- Number of queries in which the parameter was used
- Pages the parameter is pinned to
Use parameters in your query
A parameter must be used in the query to make the filter applicable for that query visual. Once defined, you can see the parameters in the Query page > filter top bar and in the query intellisense.
Note
If the parameter isn't used in the query, the filter remains inactive. Once the parameter is added to the query, the filter becomes active.
Parameter types
Several dashboard parameter types are supported, as follows:
- Default time range parameter
- Single-selection fixed-values parameters
- Multiple-selection fixed-values parameters
- Single-selection query-based parameters
- Multiple-selection query-based parameters
- Free text parameters
- Data source parameters
The following examples describe how to use parameters in a query for various parameter types.
Default time range parameter
Every dashboard has a Time range parameter by default. It shows up on the dashboard as a filter only when used in a query. Use the parameter keywords _startTime and _endTime to use the default time range parameter in a query as seen in the following example:
StormEvents
| where StartTime between (_startTime.._endTime)
| summarize TotalEvents = count() by State
| top 5 by TotalEvents
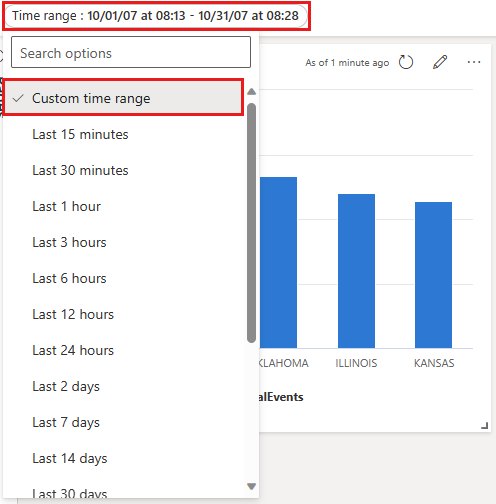
Once saved, the time range filter shows up on the dashboard. Now it can be used to filter the data on the card. You can filter your dashboard by selecting from the dropdown: Time range (last x minutes/hours/days) or a Custom time range.
Single-selection fixed-values parameters
Fixed value parameters are based on predefined values specified by the user. The following example shows you how to create a single selection fixed value parameter.
Create a single-selection fixed-values parameter
Select Parameters to open the Parameters pane and select New parameter.
Fill in the details as follows:
Label: Event Type
Parameter type: Single selection
Variable name:
_eventTypeData type: String
Pin as dashboard filter: checked
Source: Fixed values
In this example, use the following values:
Value Parameter display name Thunderstorm Wind Thunderstorm wind Hail Hail Flash Flood Flash flood Drought Drought Winter Weather Winter weather Add a Select all value: Unchecked
Default value: Thunderstorm Wind
Select Done to create the parameter.
The parameter can be seen in the Parameters side pane, but aren't currently being used in any visuals.
Use a single-selection fixed-values parameter
Run a sample query using the new Event TypTope parameter by using the
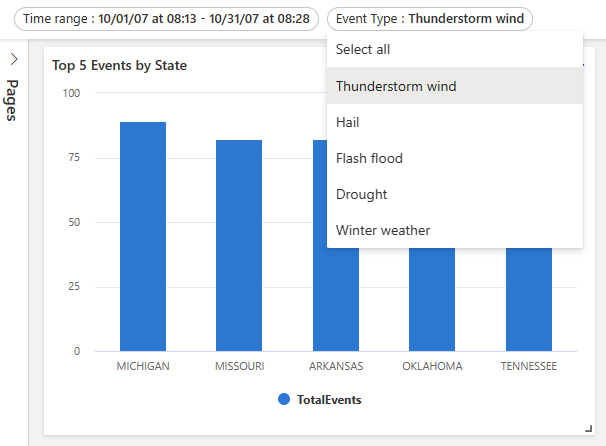
_eventTypevariable name:StormEvents | where StartTime between (_startTime.._endTime) | where EventType == _eventType | summarize TotalEvents = count() by State | top 5 by TotalEventsThe new parameter shows up in the parameter list at the top of the dashboard.
Select different values to update the visuals.
Multiple-selection fixed-values parameters
Fixed value parameters are based on predefined values specified by the user. The following example shows you how to create and use a multiple-selection fixed-value parameter.
Create a multiple-selection fixed-values parameters
Select Parameters to open the Parameters pane and select New parameter.
Fill in the details as mentioned in Use a single-selection fixed-values parameter with the following changes:
- Label: Event Type
- Parameter type: Multiple selection
- Variable name:
_eventType
Select Done to create the parameter.
The new parameters can be seen in the Parameters side pane, but aren't currently being used in any visuals.
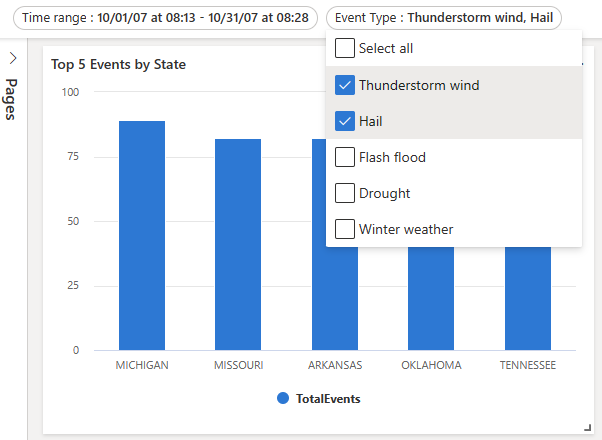
Use a multiple-selection fixed-values parameter
Run a sample query using the new Event Type parameter by using the
_eventTypevariable.StormEvents | where StartTime between (_startTime.._endTime) | where EventType in (_eventType) or isempty(_eventType) | summarize TotalEvents = count() by State | top 5 by TotalEventsThe new parameter shows up in the parameter list at the top of the dashboard.
Select one or more different values to update the visuals.
Single-selection query-based parameters
Query-based parameter values are retrieved during dashboard loading by executing the parameter query. The following example shows you how to create and use a single selection query-based parameter.
Create a single-selection query-based parameter
Select Parameters to open the Parameters pane and select New parameter.
Fill in the details as mentioned in Use a single-selection fixed-values parameter with the following changes:
Label: State
Variable name:
_stateSource: Query
Data source: StormEventsSample
Select Edit query and enter the following query. Select Done.
StormEvents | where StartTime between (_startTime.._endTime) | where EventType in (_eventType) or isempty(_eventType) | summarize TotalEvents = count() by State | top 5 by TotalEvents | project StateValue: State
Display name: State
Default value: Choose a default value
Select Done to create the parameter.
Use a single-selection query-based parameter
The following sample query with the new State parameter uses the
_statevariable:StormEvents | where StartTime between (_startTime.._endTime) | where EventType in (_eventType) or isempty(_eventType) | where State == _state | summarize TotalEvents = count() by State | top 5 by TotalEventsThe new parameter shows up in the parameter list at the top of the dashboard.
Select different values to update the visuals.
Multiple-selection query-based parameters
Query-based parameter values are derived at dashboard load time by executing the user specified query. The following example shows how to can create a multiple-selection query-based parameter:
Create a multiple-selection query-based parameter
Select Parameters to open the Parameters pane and select + New parameter.
-
- Fill in the details as mentioned in Use a single-selection fixed-values parameter with the following changes:
- Label: State
- Parameter type: Multiple selection
- Variable name:
_state
Select Done to create the parameter.
Use a multiple-selection query-based parameter
The following sample query uses the new State parameter by using the
_statevariable.StormEvents | where StartTime between (_startTime.._endTime) | where EventType in (_eventType) or isempty(_eventType) | where State in (_state) or isempty(_state) | summarize TotalEvents = count() by State | top 5 by TotalEventsNote
This sample uses the Select All option by checking for empty values with the
isempty()function.The new parameter shows up in the parameter list at the top of the dashboard.
Select one or more different values to update the visuals.
Free text parameters
Free text parameters don't contain any values. They allow you to introduce your own value.
Create a free text parameter
Select Parameters to open the Parameters pane and select + New parameter.
Fill in the details as follows:
- Label: State
- Parameter type: Free text
- Variable name: _state
- Data type: String
- Default value: No default value
Use a free text parameter
Run a sample query using the new State parameter by using the
_statevariable name:StormEvents | where StartTime between (_startTime.._endTime) | where EventType in (_eventType) or isempty(_eventType) | where State contains _state | summarize TotalEvents = count() by State | top 5 by TotalEvents
Data source parameters
Once you have added data sources to your dashboard, you can create a parameter that selects one or more of the available data sources. This parameter can be used in tiles and other parameters.
Create a data source parameter
Select Parameters to open the Parameters pane and select + New parameter.
Fill in the details as follows:
- Label: Source
- Parameter type: Data source
- Show on pages: Select all
- Values: Select all
- Default value: StormEventsSample
Select Done.
The new parameter is now visible in the parameter list at the top of the dashboard.
Use a data source parameter
Navigate to the query of a new or existing tile.
In Source, select the name of your new parameter under Data source parameters. For the above-created parameter, select Cluster.
Select Apply changes.
Use the Cluster parameter to change the data source for this connected query.
Cross-filters parameters
Cross-filters allow you to select a value in one visual and all dashboard visuals, such as line or scatter charts, are filtered to only show related data. Using cross-filters achieves the same result as selecting the equivalent value for the parameter in the parameter list at the top of the dashboard.
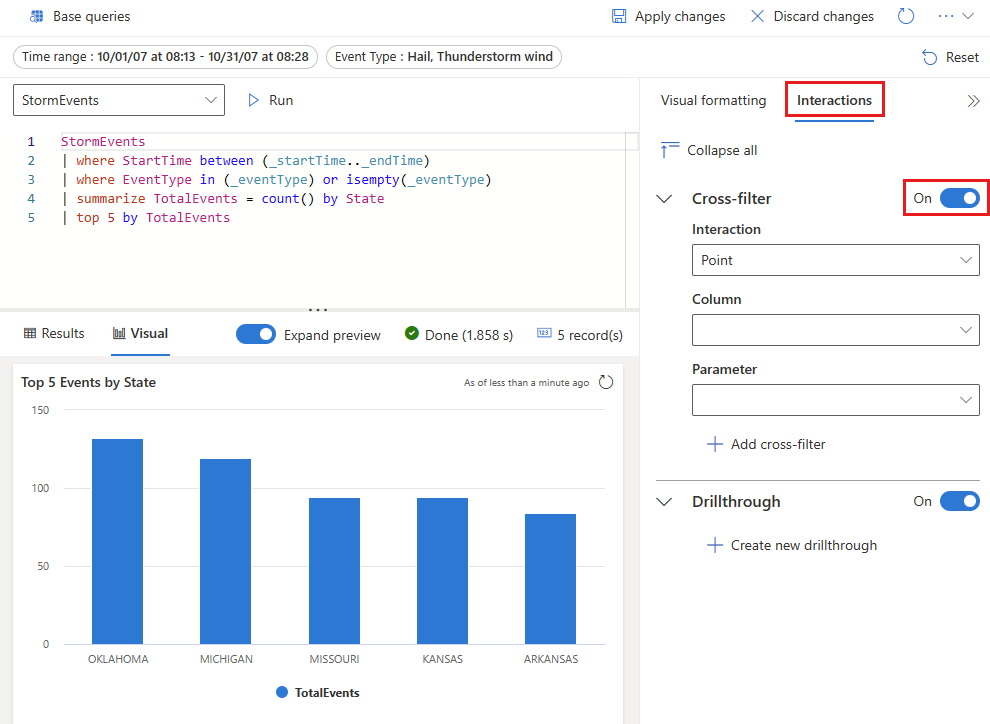
Define cross-filters
To create a cross-filter, you must turn on the option in the visual, and then specify the parameter that is used to filter the data.
Navigate to the query of the tile where you want to add cross-filters.
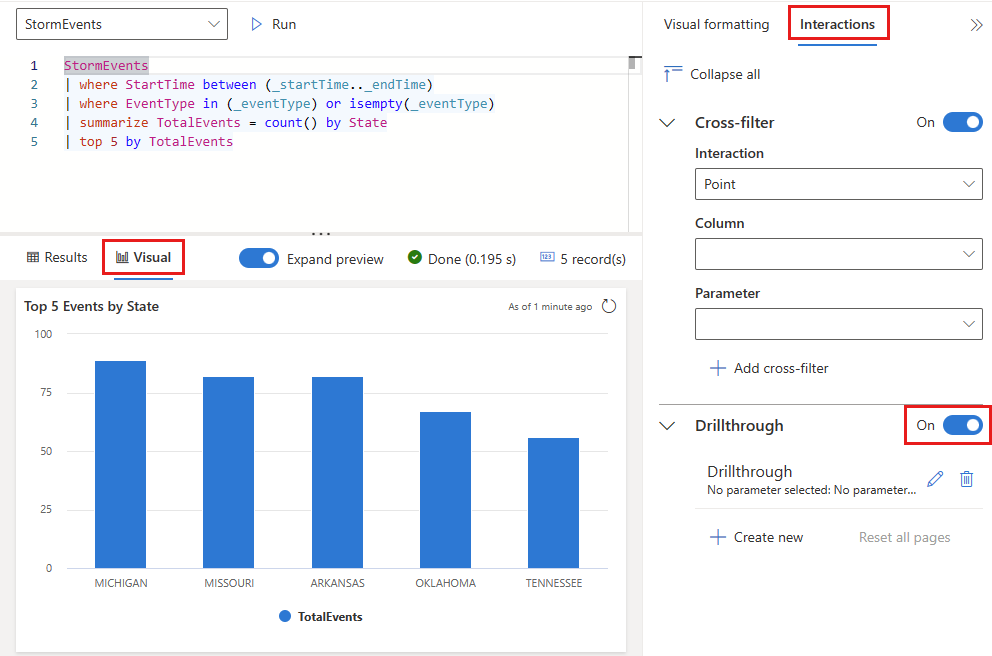
Select Visual.
In the right pane, select Interactions, and then turn on cross-filters.
Optionally, specify the Interaction type. The default is Point where you can select a value in the visual. For selecting a range of values, such as in a time chart, select Drag.
Specify both the column that is used to provide the value and a parameter used to filter the query.
Important
The column and parameter must be of the same data type.
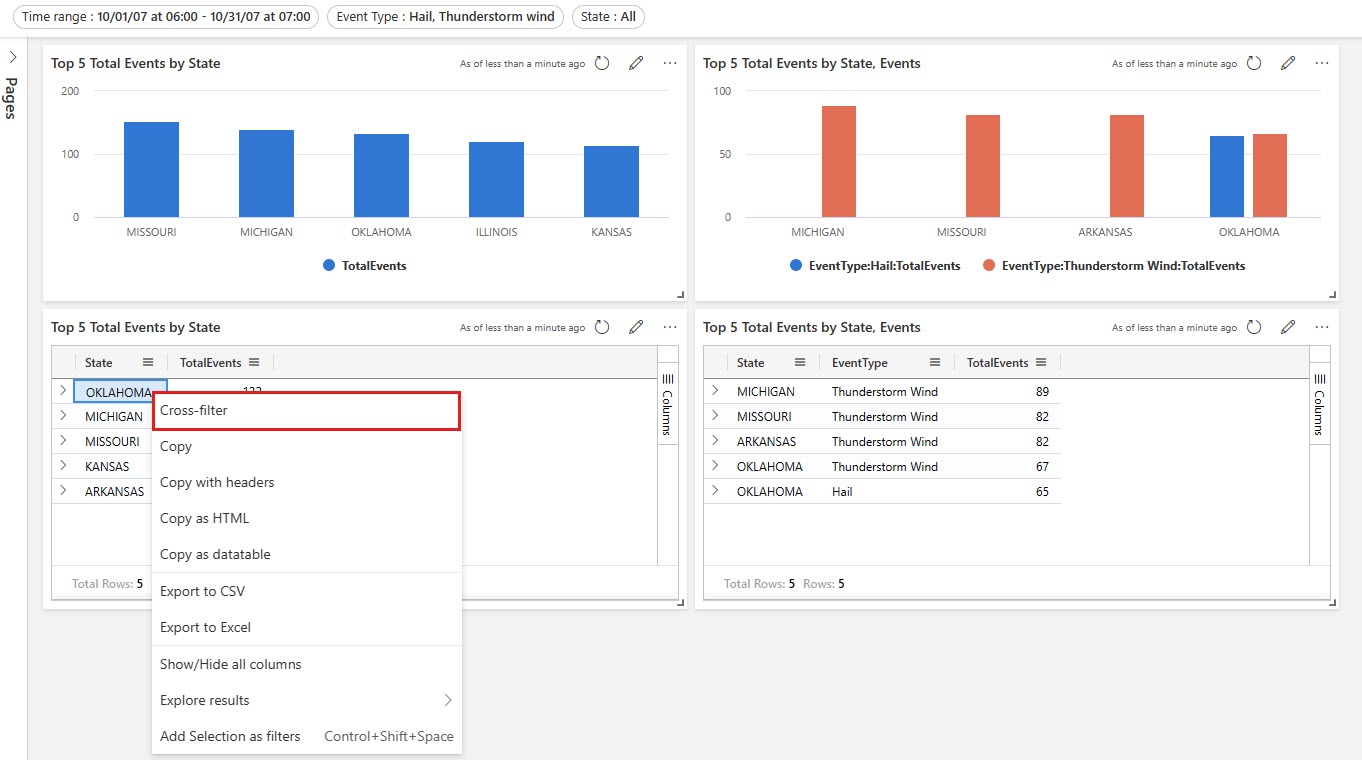
Interact with your data using cross-filter
Once the cross-filter is defined, you can use it to interact with your data. In visuals where you define cross-filters, you can select data points and use their values to filter the current dashboard page. For table visuals, select data points by right-clicking on the relevant cell and then in the context menu, select Cross-filter.
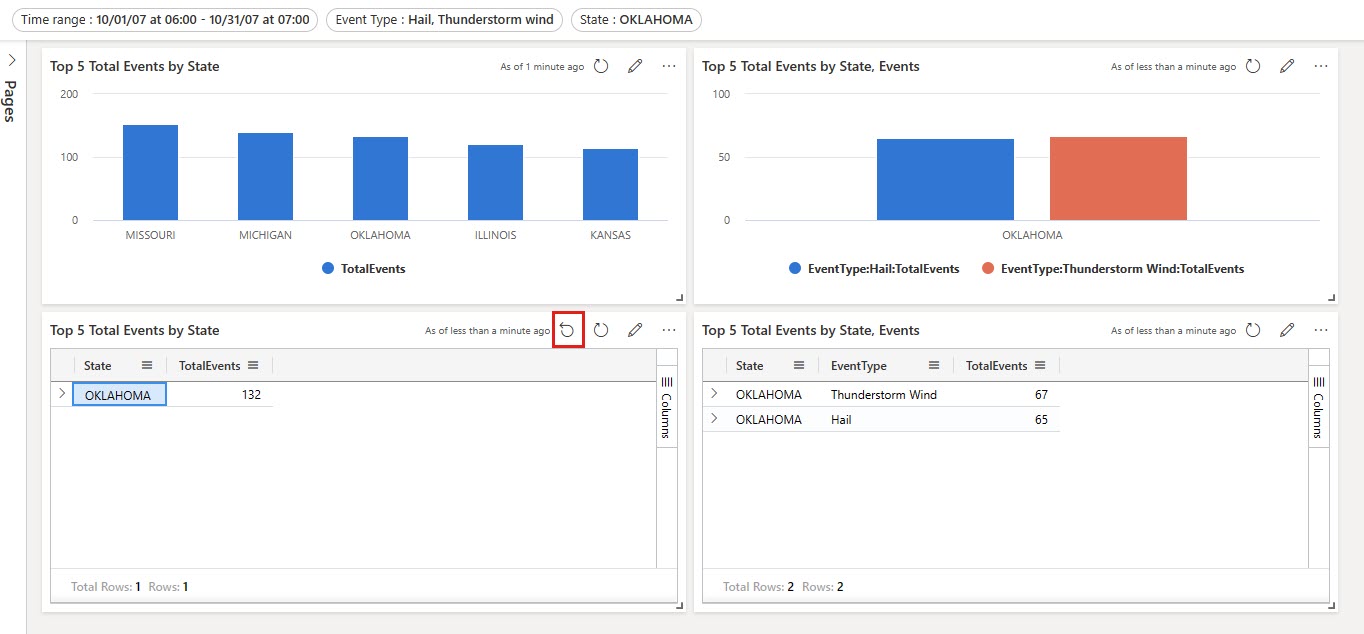
You can reset the cross-filter by selecting Reset at the top of the visual where it was selected.
Use drillthroughs as dashboard parameters
With drillthrough, you can select a value in a visual and use it to filter the visuals in a target page in the same dashboard. When the target page opens, the value is preselected in the relevant filters. The visuals on the page, such as line or scatter charts, are filtered to only show related data.
Define a drillthrough
To create a drillthrough, you must first turn on drillthroughs in the visual and then add one or more drillthroughs as required.
Edit the visual where you want to add a drillthrough. Make sure that the Visual tab is selected.
In the right pane, select Interactions, then turn on drillthrough.
Under Drillthrough, select Create new, and specify the following information. Optionally select Add another pair to add multiple parameters for a target page. Repeat this step to add drillthroughs to other pages in the current dashboard using different parameters.
Field Description Destination page One or more target pages to drill through to using the defined parameters. Column The query result's column to use as the value for a parameter in the target page. Parameter The parameter used to filter visuals in the target page using the column value. Notes Optional short description. Important
Column and parameter pairs must be of the same data type.
Interact with your data using drillthroughs
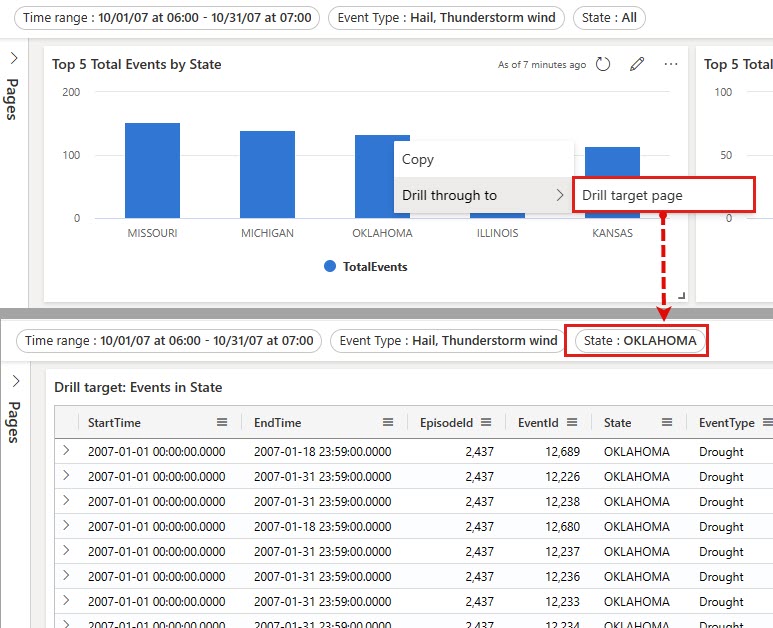
Once drillthroughs are defined, you can use them to interact with your data. To do so, in visuals or tables where you define a drillthrough, right-click on a data point, and then select Drill through to > destination page. The values from the data point are used as the parameters to filter the visuals on the target page.
To return to the source page, in the top-right of the destination page, select Reset. All filters assigned by the drillthrough are reset.
Use filter search for single and multiple selection filters
In single and multiple selection filters, type the value that you want. The filter updates to only show the values that match the search term.