Visualize data from Azure Data Explorer in Grafana
Grafana is an analytics platform where you can query and visualize data, and then create and share dashboards based on your visualizations. Grafana provides an Azure Data Explorer plug-in, which enables you to connect to and visualize data from Azure Data Explorer. The plug-in works with both Azure Managed Grafana and self-hosted Grafana.
In this article, you learn how to configure your cluster as a data source for Grafana and visualize data in Grafana for Azure Managed Grafana and self-hosted Grafana. To follow along with the examples in this article, ingest the StormEvents sample data. The StormEvents sample dataset contains weather-related data from the National Centers for Environmental Information.
Prerequisites
- For Azure Managed Grafana, an Azure account and Azure Managed Grafana instance.
- For self-hosted Grafana, Grafana version 5.3.0 or later for your operating system and the Azure Data Explorer plug-in for Grafana. You need plug-in version 3.0.5 or later to use the Grafana query builder.
- An Azure Data Explorer cluster and database. You can create a free cluster or create a full cluster. To decide which is best for you, check the feature comparison.
Configure the data source
To configure Azure Data Explorer as a data source, follow the steps for your Grafana environment.
Add the managed identity to the Viewer role
Managed Grafana creates a system-assigned managed identity for each new workspace, by default. You can use it to access your Azure Data Explorer cluster.
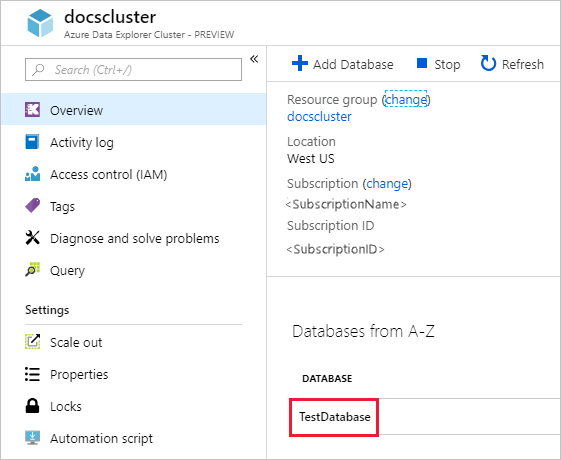
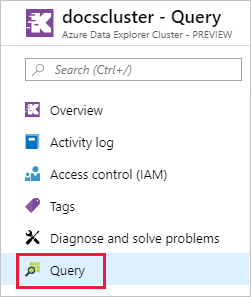
In the Azure portal, go to your Azure Data Explorer cluster.
In the Overview section, select the database that has the StormEvents sample data.
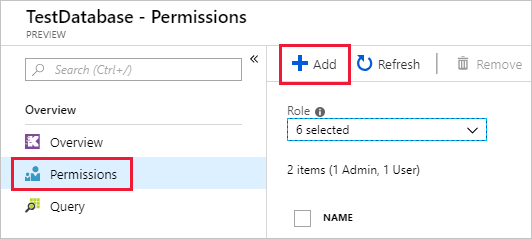
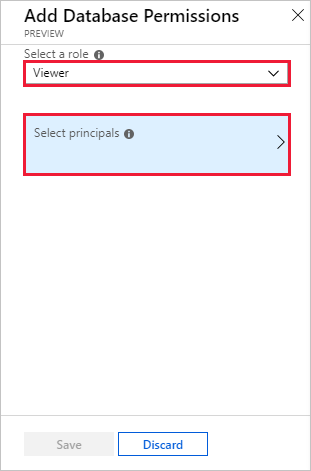
Select Permissions > Add > Viewer.
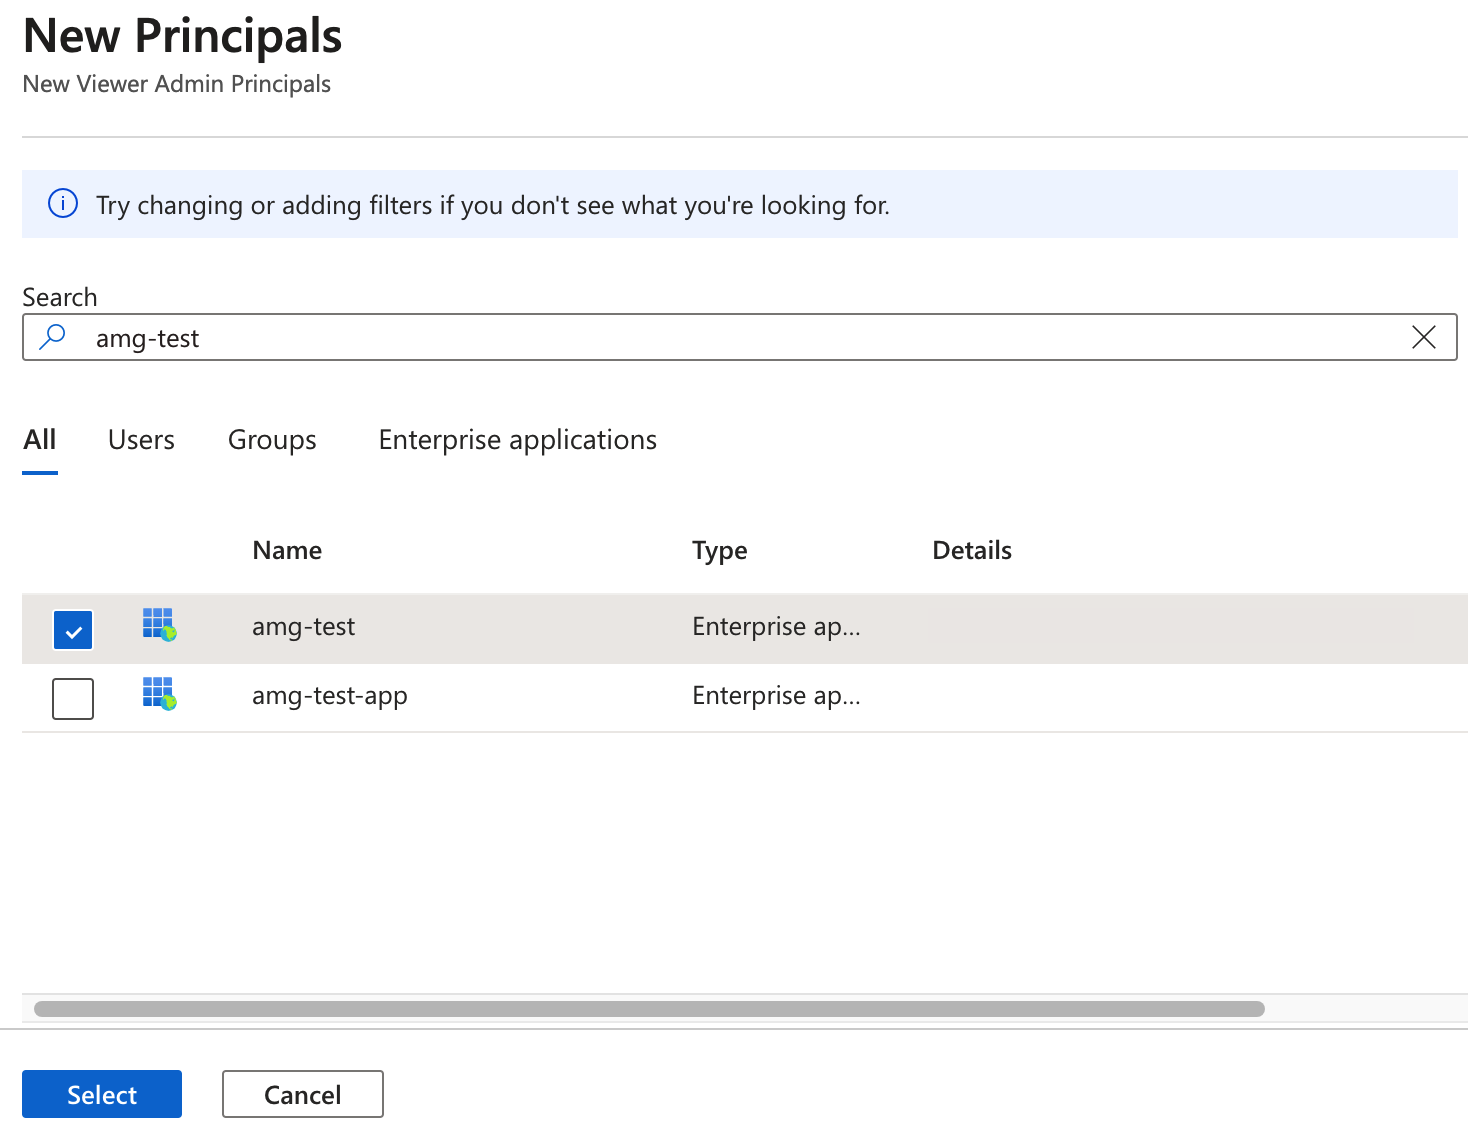
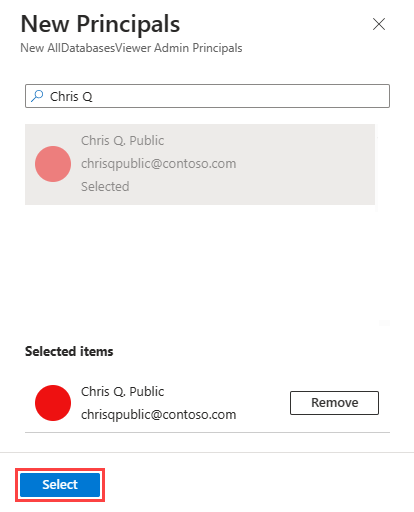
In the search box, enter your Managed Grafana workspace name.
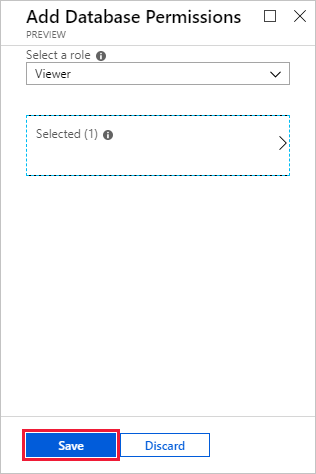
In the search results, select the result that matches your workspace name, and then choose Select.
Set up Azure Data Explorer as a Grafana data source
Managed Grafana workspaces come with the Azure Data Explorer plug-in preinstalled.
In the Azure portal, go to your Managed Grafana workspace.
Under Overview, select the Endpoint link to open the Grafana UI.
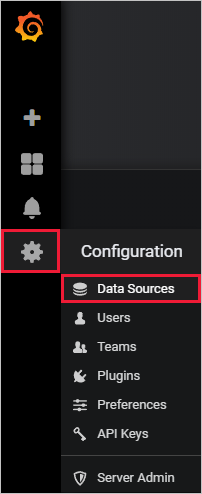
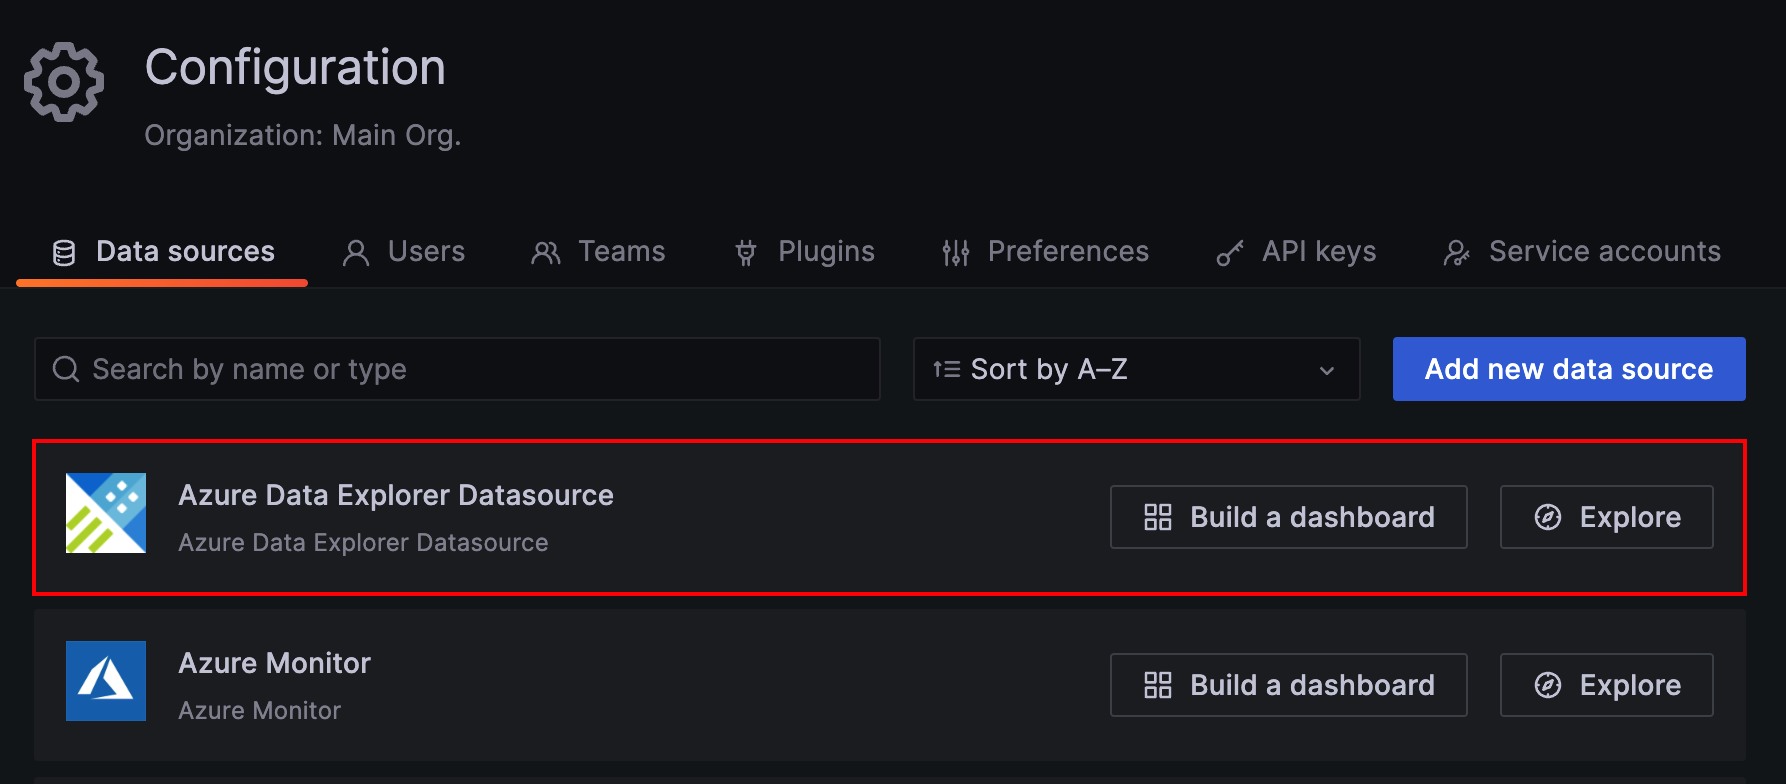
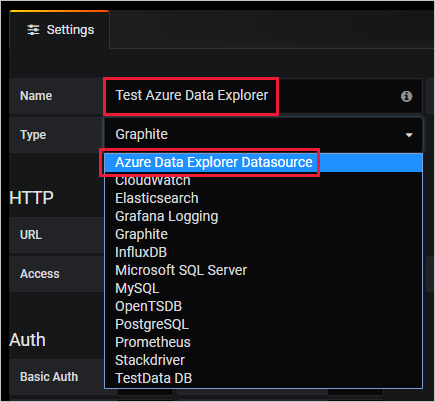
In Grafana, on the left menu, select the gear icon. Then select Data Sources.
Select Azure Data Explorer Datasource.
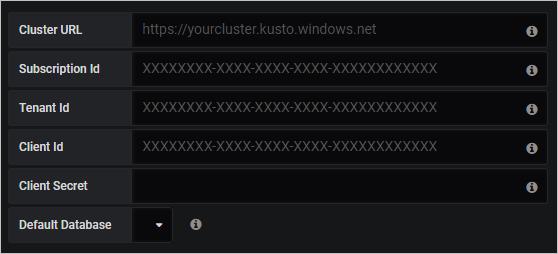
In Connection Details, enter your Azure Data Explorer cluster URL.
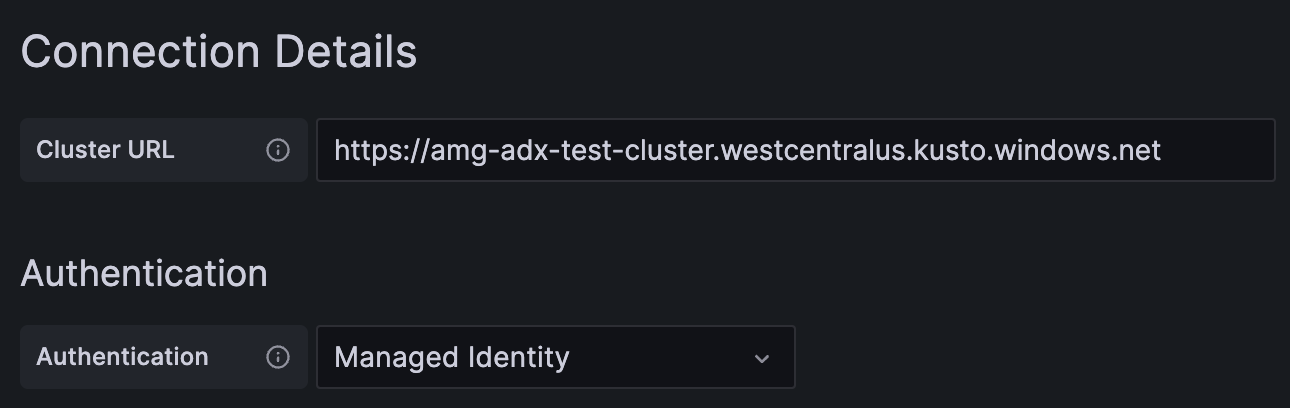
Select Save & Test.


Visualize data
You finished configuring Azure Data Explorer as a data source for Grafana. Now it's time to visualize data.
The following basic example uses both the query builder mode and the raw mode of the query editor. We recommend that you view write queries for Azure Data Explorer for examples of other queries to run against the dataset.
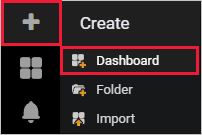
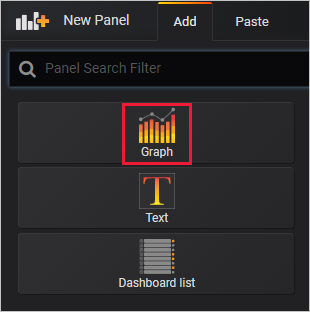
In Grafana, on the left menu, select the plus icon. Then select Dashboard.
Under the Add tab, select Graph.
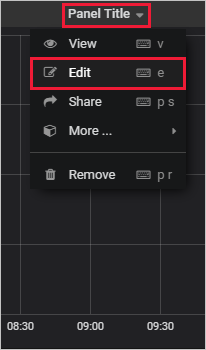
On the graph pane, select Panel Title > Edit.
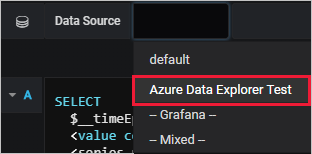
At the bottom of the pane, select Data Source, and then select the data source that you configured.
Query builder mode
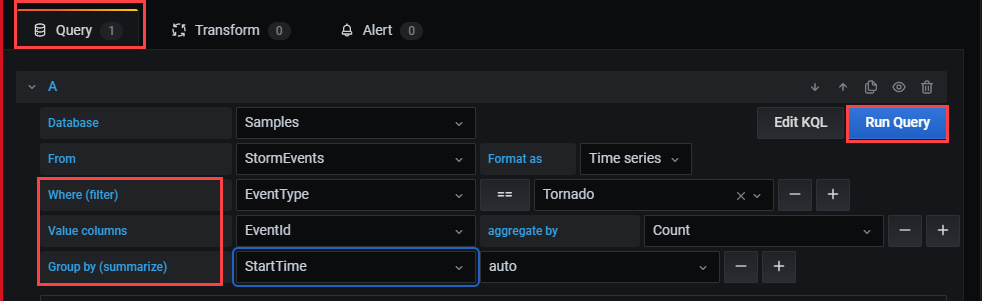
Use query builder mode to define your query.
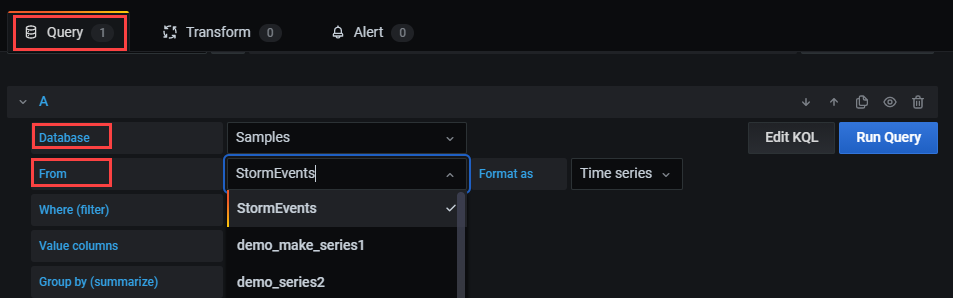
Below the data source, select Database and choose your database from the dropdown list.
Select From and choose your table from the dropdown list.
Now that the table is defined, filter the data:
- Select + to the right of Where (filter) to select one or more columns in your table.
- For each filter, define the values by using the applicable operator. This selection is similar to using the where operator in Kusto Query Language.
Select the values to present in the table:
Select + to the right of Value columns to select the value columns that will appear on the pane.
For each value column, set the aggregation type.
You can set one or more value columns. This selection is equivalent to using the summarize operator.
Select + to the right of Group by (summarize) to select one or more columns that will be used to arrange the values into groups. This selection is equivalent to the group expression in the
summarizeoperator.Select Run Query.
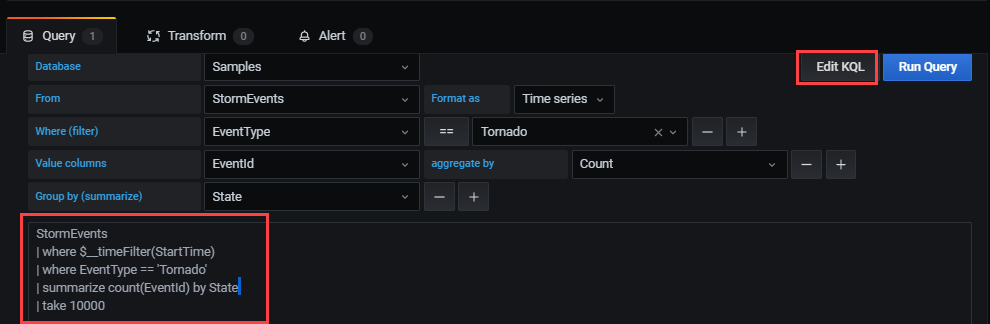
Tip
While you're finalizing the settings in the query builder, a Kusto Query Language query is created. This query shows the logic that you constructed by using the graphical query editor.
Select Edit KQL to move to raw mode. Edit your query by using the flexibility and power of the Kusto Query Language.
Raw mode
Use raw mode to edit your query.
On the query pane, paste the following query, and then select Run. The query buckets the count of events by day for the sample dataset.
StormEvents
| summarize event_count=count() by bin(StartTime, 1d)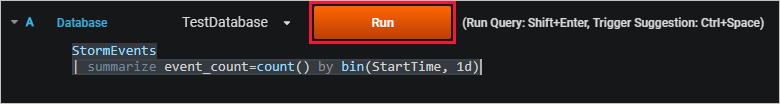
The graph doesn't show any results because it's scoped (by default) to data from the last six hours. On the top menu, select Last 6 hours.
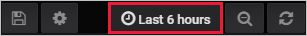
Specify a custom range that covers 2007, the year included in the StormEvents sample dataset. Then select Apply.
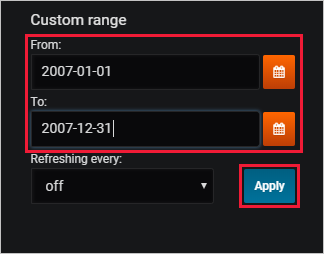
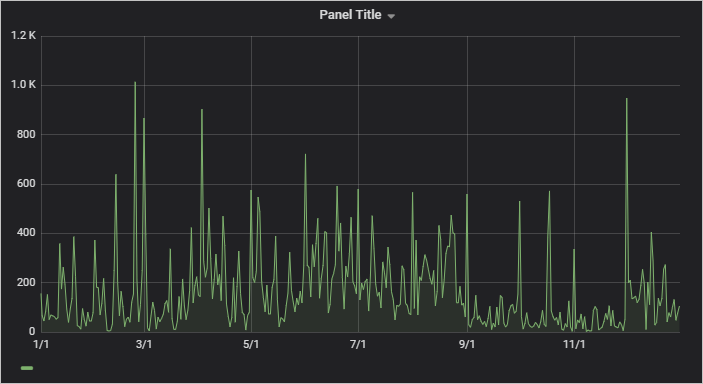
Now the graph shows the data from 2007, bucketed by day.
On the top menu, select the save icon:
 .
.
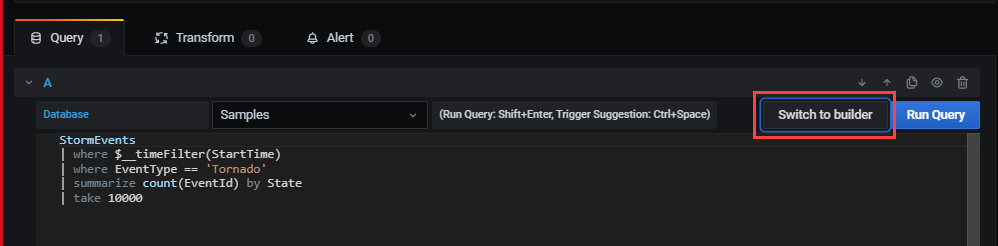
To switch to the query builder mode, select Switch to builder. Grafana will convert the query to the available logic in the query builder. The query builder logic is limited, so you might lose manual changes that you made to the query.
Create alerts
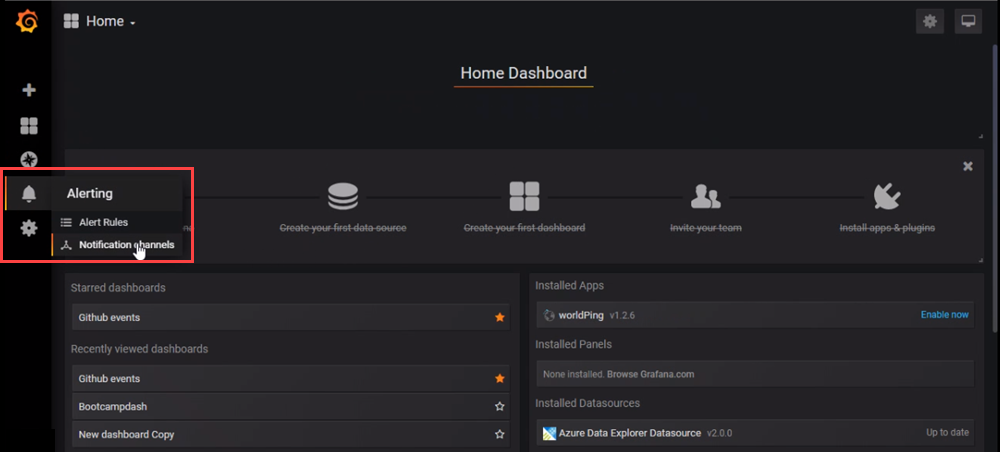
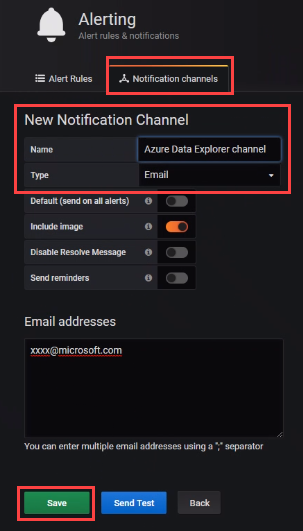
In Home Dashboard, select Alerting > Notification channels to create a new notification channel.
Enter a name and type under New Notification Channel, and then select Save.
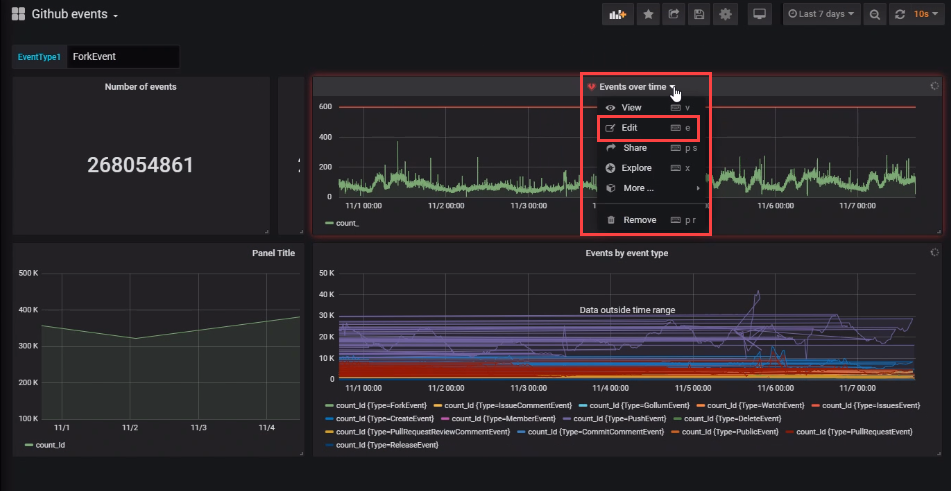
On the dashboard, select Edit from the dropdown list.
Select the alert bell icon to open the Alert pane. Select Create Alert, and then complete the properties for the alert.
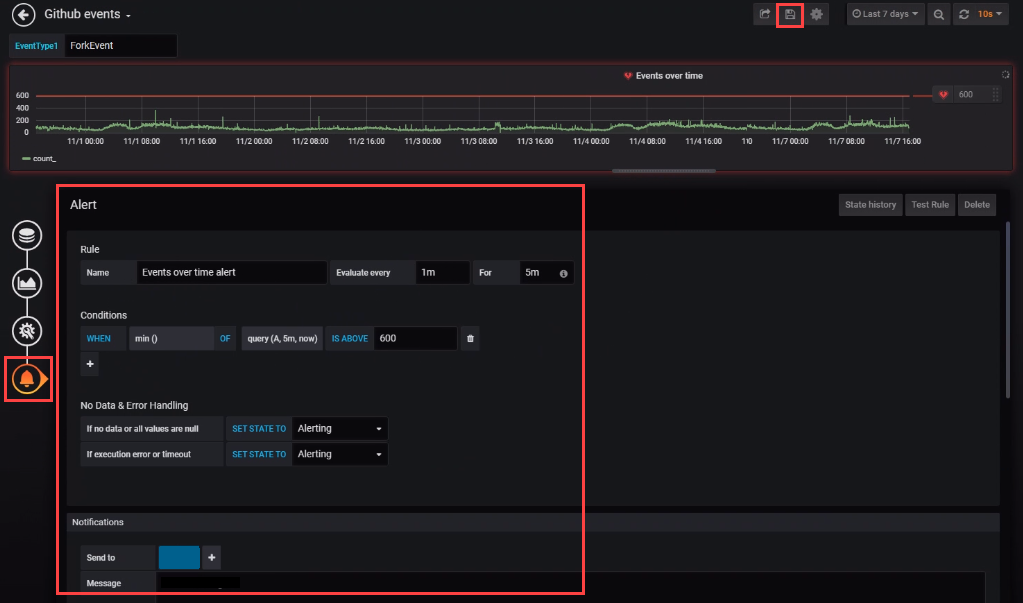
Select the Save dashboard icon to save your changes.
Related content
Feedback
Coming soon: Throughout 2024 we will be phasing out GitHub Issues as the feedback mechanism for content and replacing it with a new feedback system. For more information see: https://aka.ms/ContentUserFeedback.
Submit and view feedback for