Note
Access to this page requires authorization. You can try signing in or changing directories.
Access to this page requires authorization. You can try changing directories.
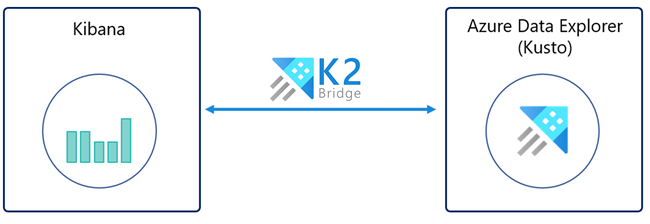
K2Bridge (Kibana-Kusto Bridge) lets you use Azure Data Explorer as a data source and visualize that data in Kibana. K2Bridge is an open-source, containerized application. It acts as a proxy between a Kibana instance and an Azure Data Explorer cluster. This article describes how to use K2Bridge to create that connection.
K2Bridge translates Kibana queries to Kusto Query Language (KQL) and sends the Azure Data Explorer results back to Kibana.
K2Bridge supports Kibana's Discover, Visualize and Dashboard tabs.
With the Discover tab you can:
- Search and explore the data.
- Filter results.
- Add or remove fields in the results grid.
- View record content.
- Save and share searches.
With the Visualize tab you can:
- Create visualizations like: bar charts, pie charts, data tables, heat maps, and more.
- Save a visualization
With the Dashboard tab you can:
- Create panels by using new or saved visualizations.
- Save a dashboard.
The following image shows a Kibana instance bound to Azure Data Explorer by K2Bridge. The user experience in Kibana is unchanged.

Prerequisites
Before you can visualize data from Azure Data Explorer in Kibana, have the following ready:
- An Azure subscription. Create a free Azure account.
- An Azure Data Explorer cluster and database. You will need the cluster's URL and the database name.
- Helm v3, the Kubernetes package manager.
- Azure Kubernetes Service (AKS) cluster or any other Kubernetes cluster. Use version 1.21.2 or newer, with a minimum of three Azure Kubernetes Service nodes. Version 1.21.2 has been tested and verified. If you need an AKS cluster, see how to deploy an AKS cluster using the Azure CLI or using the Azure portal.
- A Microsoft Entra service principal authorized to view data in Azure Data Explorer, including the client ID and client secret. Alternatively, you can use a system-assigned managed identity.
If you choose to use a Microsoft Entra service principal, you will need to create a Microsoft Entra service principal. For the installation, you will need the ClientID and a Secret. We recommend a service principal with viewer permission and discourage you from using higher-level permissions. To assign permissions, see Manage database permissions in the Azure portal or use management commands to Manage database security roles.
If you choose to use a system assigned identity, you will need to get the agent pool managed identity ClientID (located in the generated "[MC_xxxx]" resource group)
Run K2Bridge on Azure Kubernetes Service (AKS)
By default, the Helm chart of K2Bridge references a publicly available image located in Microsoft Container Registry (MCR). MCR doesn't require any credentials.
Download the required Helm charts.
Add the Elasticsearch dependency to Helm. The dependency is required because K2Bridge uses a small internal Elasticsearch instance. The instance services metadata-related requests like index-patterns queries and saved queries. This internal instance saves no business data. You can consider the instance to be an implementation detail.
To add the Elasticsearch dependency to Helm, run these commands:
helm repo add elastic https://helm.elastic.co
helm repo update
To get the K2Bridge chart from the charts directory of the GitHub repository:
Clone the repository from GitHub.
Go to the K2Bridges root repository directory.
Run this command:
helm dependency update charts/k2bridge
Deploy K2Bridge.
Set the variables to the correct values for your environment.
ADX_URL=[YOUR_ADX_CLUSTER_URL] #For example, https://mycluster.westeurope.kusto.windows.net
ADX_DATABASE=[YOUR_ADX_DATABASE_NAME]
ADX_CLIENT_ID=[SERVICE_PRINCIPAL_CLIENT_ID]
ADX_CLIENT_SECRET=[SERVICE_PRINCIPAL_CLIENT_SECRET]
ADX_TENANT_ID=[SERVICE_PRINCIPAL_TENANT_ID]
Note
When using a managed identity, the ADX_CLIENT_ID value is the client ID of the managed identity, located in the generated "[MC_xxxx]" resource group. For more information, see MC_ resource group. The ADX_SECRET_ID is only required if you use a Microsoft Entra service principal.
Optionally, enable Application Insights telemetry. If you're using Application Insights for the first time, create an Application Insights resource. Copy the instrumentation key to a variable.
APPLICATION_INSIGHTS_KEY=[INSTRUMENTATION_KEY]
COLLECT_TELEMETRY=true
Install the K2Bridge chart. Visualizations and dashboards are supported with the Kibana 7.10 version only. The latest image tags are: 6.8_latest and 7.16_latest, which support Kibana 6.8 and Kibana 7.10 respectively. The image of '7.16_latest' supports Kibana OSS 7.10.2, and its internal Elasticsearch instance is 7.16.2.
If a Microsoft Entra service principal was used:
helm install k2bridge charts/k2bridge -n k2bridge --set settings.adxClusterUrl="$ADX_URL" --set settings.adxDefaultDatabaseName="$ADX_DATABASE" --set settings.aadClientId="$ADX_CLIENT_ID" --set settings.aadClientSecret="$ADX_CLIENT_SECRET" --set settings.aadTenantId="$ADX_TENANT_ID" [--set image.tag=6.8_latest/7.16_latest]
[--set image.repository=$REPOSITORY_NAME/$CONTAINER_NAME]
[--set privateRegistry="$IMAGE_PULL_SECRET_NAME"] [--set settings.collectTelemetry=$COLLECT_TELEMETRY]
Or, if managed identity was used:
helm install k2bridge charts/k2bridge -n k2bridge --set settings.adxClusterUrl="$ADX_URL" --set settings.adxDefaultDatabaseName="$ADX_DATABASE" --set settings.aadClientId="$ADX_CLIENT_ID" --set settings.useManagedIdentity=true --set settings.aadTenantId="$ADX_TENANT_ID" [--set image.tag=7.16_latest] [--set settings.collectTelemetry=$COLLECT_TELEMETRY]In Configuration, you can find the complete set of configuration options.
The previous command's output suggests the next Helm command to deploy Kibana. Optionally, run this command:
helm install kibana elastic/kibana --version 7.17.3 -n k2bridge --set image=docker.elastic.co/kibana/kibana-oss --set imageTag=7.10.2 --set elasticsearchHosts=http://k2bridge:8080Use port forwarding to access Kibana on localhost.
kubectl port-forward service/kibana-kibana 5601 --namespace k2bridgeConnect to Kibana by going to http://127.0.0.1:5601.
Expose Kibana to users. There are multiple methods to do so. The method you use largely depends on your use case.
For example, you can expose the service as a Load Balancer service. To do so, add the --set service.type=LoadBalancer parameter to the earlier Kibana Helm install command.
Then run this command:
kubectl get service -w -n k2bridgeThe output should look like this:
NAME            TYPE           CLUSTER-IP     EXTERNAL-IP   PORT(S)          AGE
kibana-kibana   LoadBalancer   xx.xx.xx.xx    <pending>     5601:30128/TCP   4m24s
You can then use the generated EXTERNAL-IP value that appears. Use it to access Kibana by opening a browser and going to <EXTERNAL-IP>:5601.
Configure index patterns to access your data.
In a new Kibana instance:
- Open Kibana.
- Browse to Management.
- Select Index Patterns.
- Create an index pattern. The name of the index must exactly match the table name or function name without an asterisk (*). You can copy the relevant line from the list.
Note
To run K2Bridge on other Kubernetes providers, change the Elasticsearch storageClassName value in values.yaml to match the one suggested by the provider.
Discover data
When Azure Data Explorer is configured as a data source for Kibana, you can use Kibana to explore the data.
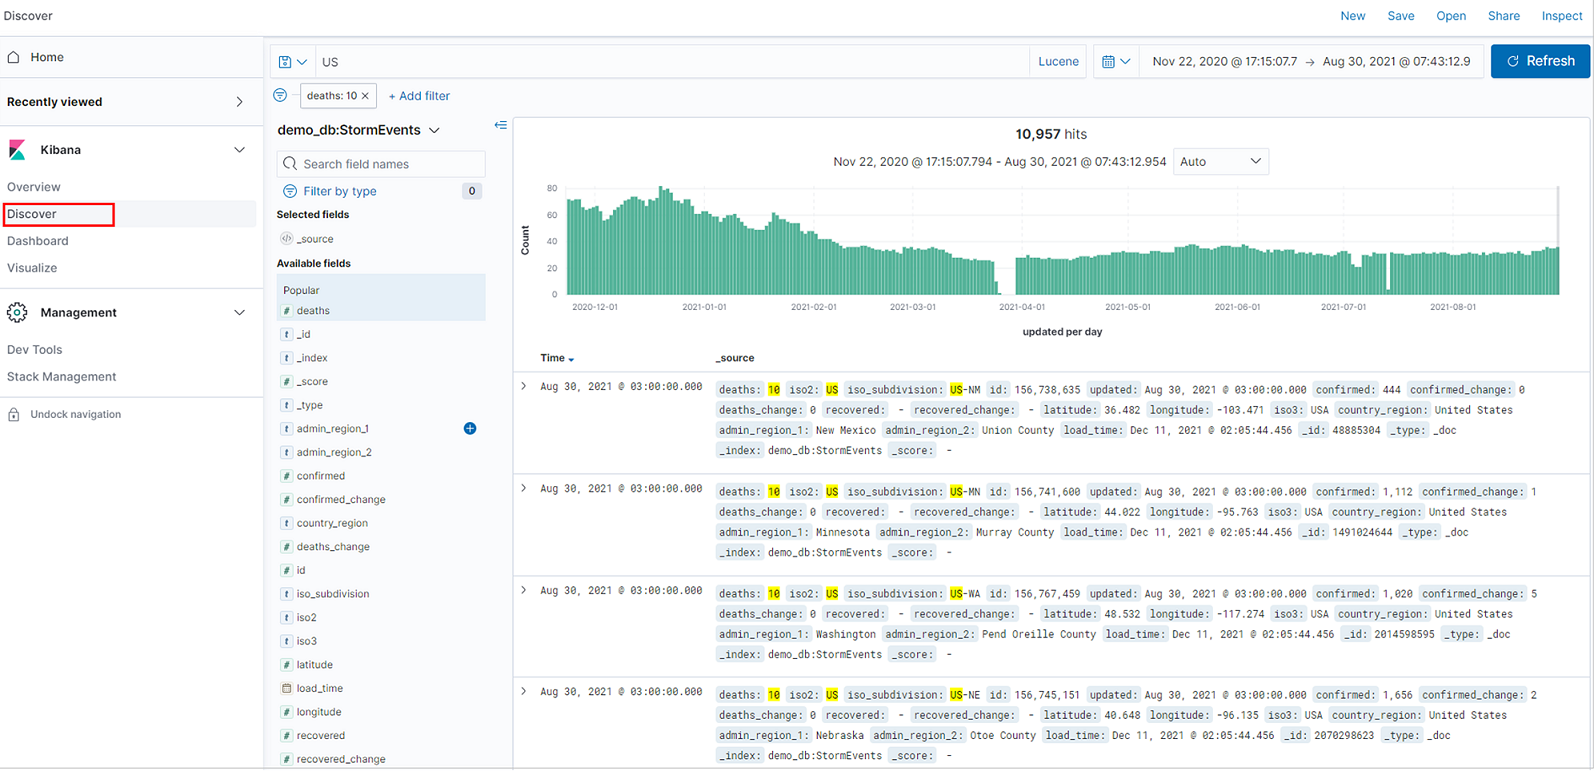
In Kibana, select the Discover tab.
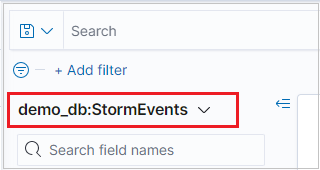
From the index pattern list, select an index pattern that defines the data source to explore. Here, the index pattern is an Azure Data Explorer table.
If your data has a time-filter field, you can specify the time range. At the upper right of the Discover page, select a time filter. By default, the page shows data for the last 15 minutes.

The results table shows the first 500 records. You can expand a document to examine the field data in either JSON or table format.
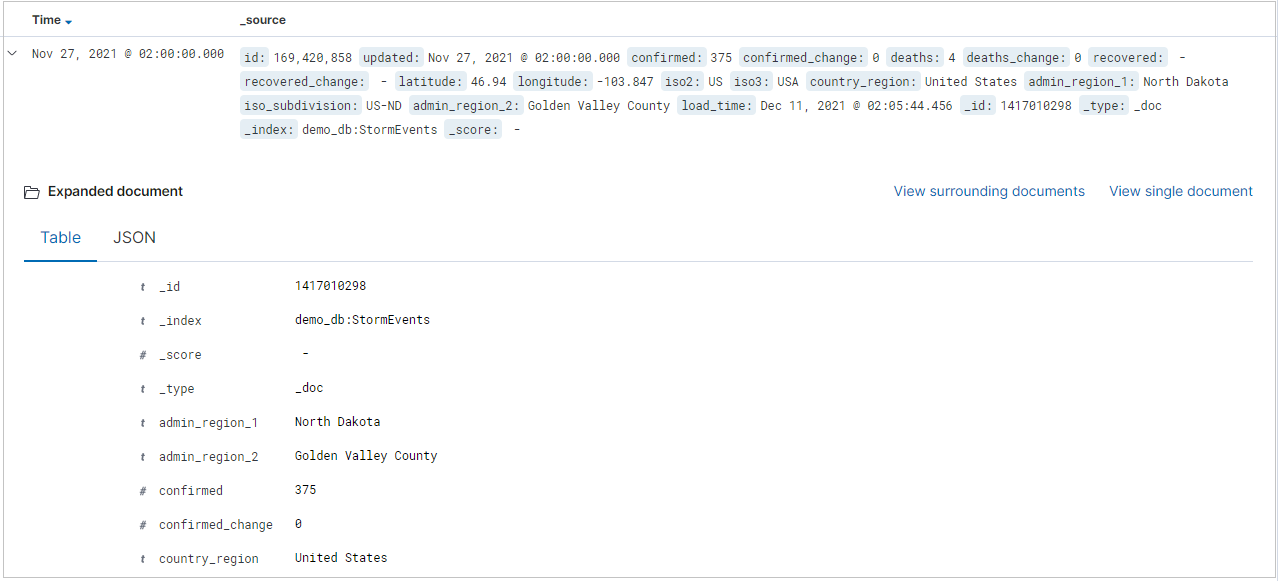
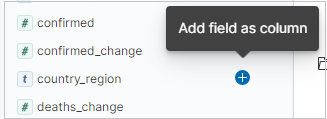
You can add specific columns to the results table by selecting add next to the field name. By default, the results table includes the _source column and a Time column if the time field exists.
In the query bar, you can search for data by:
- Entering a search term.
- Using the Lucene query syntax. For example:
- Search for "error" to find all records that contain this value.
- Search for "status: 200" to get all records with a status value of 200.
- Using the logical operators AND, OR, and NOT.
- Using the asterisk (*) and question mark (?) wildcard characters. For example, the query "destination_city: L*" matches records where the destination-city value starts with "L" or "l". (K2Bridge isn't case-sensitive.)

Note
Only kibana's Lucene query syntax is supported. Do not use the KQL option, which stands for Kibana Query Language.
Tip
In Searching, you can find more search rules and logic.
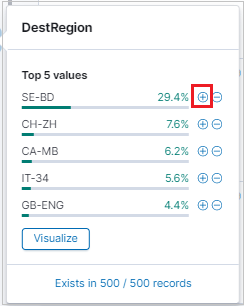
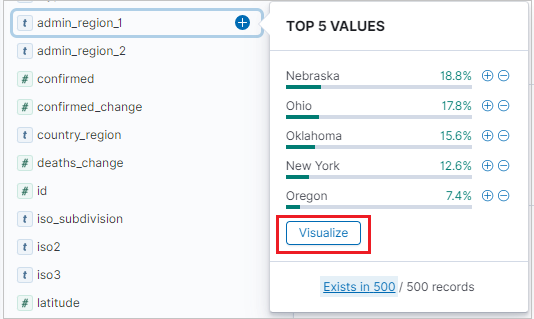
To filter your search results, use the Available field list. The field list is where you can see:
- The top five values for the field.
- The number of records that contain the field.
- The percentage of records that contain each value.
Tip
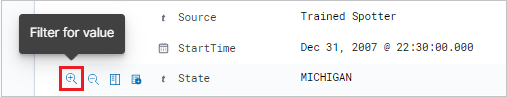
Use the magnifying glass to find all records that have a specific value.
You can also use the magnifying glass to filter results and see the results table-format view of each record in the results table.
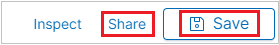
Select either Save or Share to retain your search.
Visualize data
Use Kibana visualizations to get at-a-glance views of Azure Data Explorer data.
Create a visualization from the Discover tab
To create a vertical bar visualization, in the Discover tab, locate the Available fields side bar.
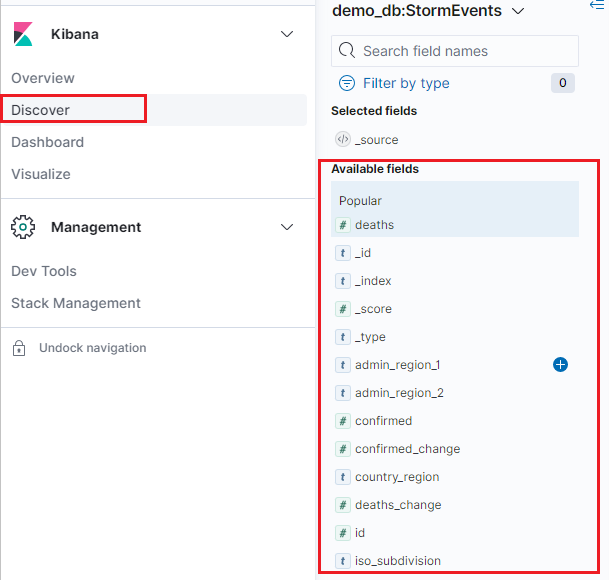
Select a field name, then click Visualize.
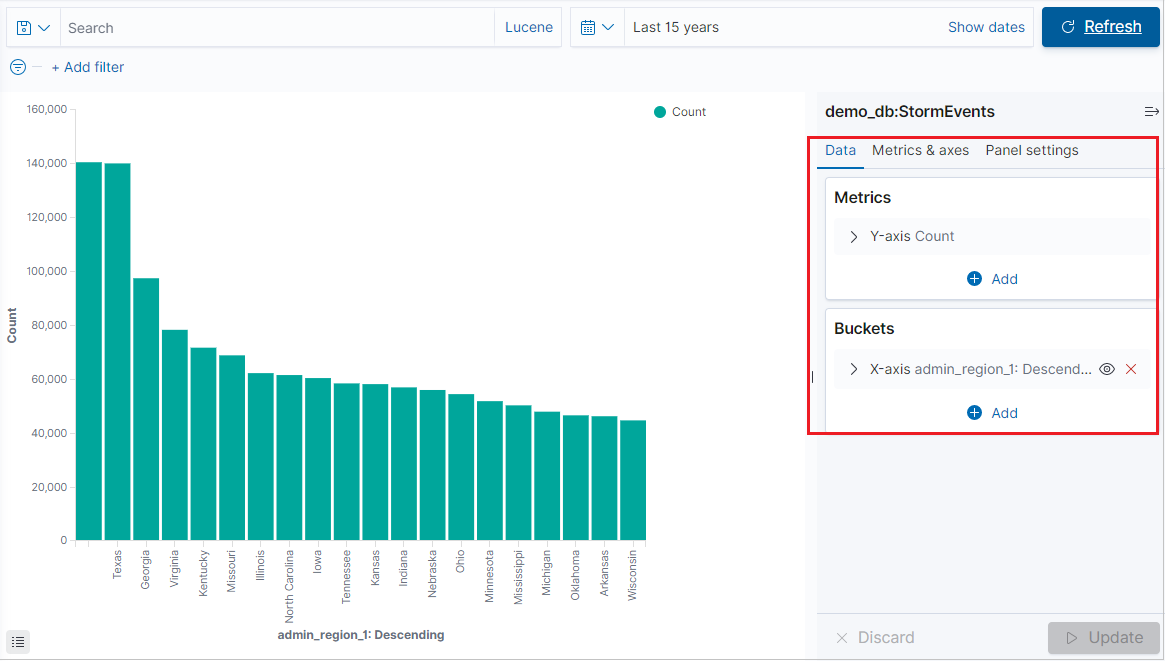
The Visualize tab opens and displays the visualization. To edit the data and metrics of the visualization, see also Create a visualization from the Visualize tab.
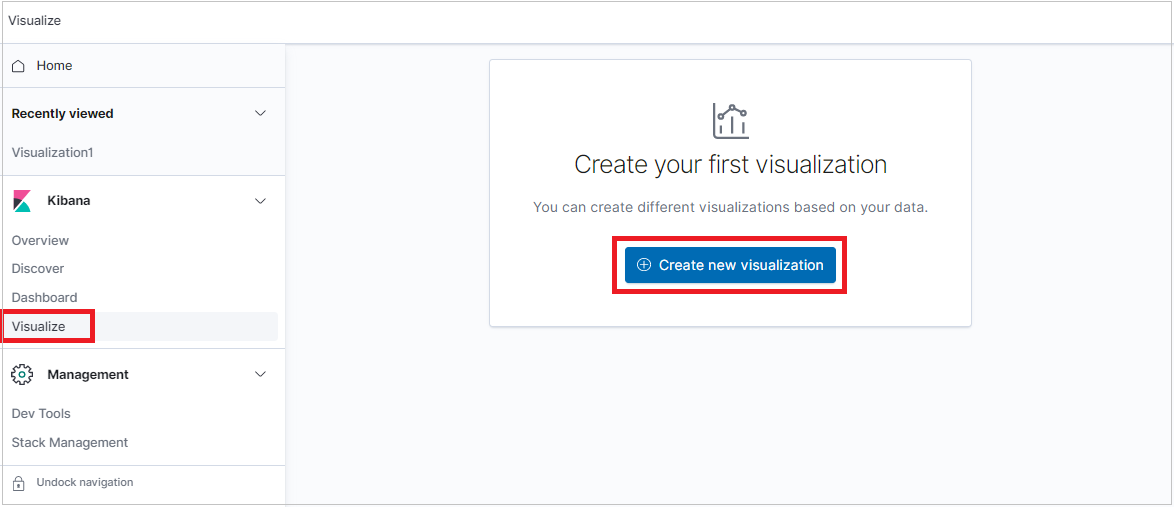
Create a visualization from the Visualize tab
Select the Visualize tab and click Create visualization.
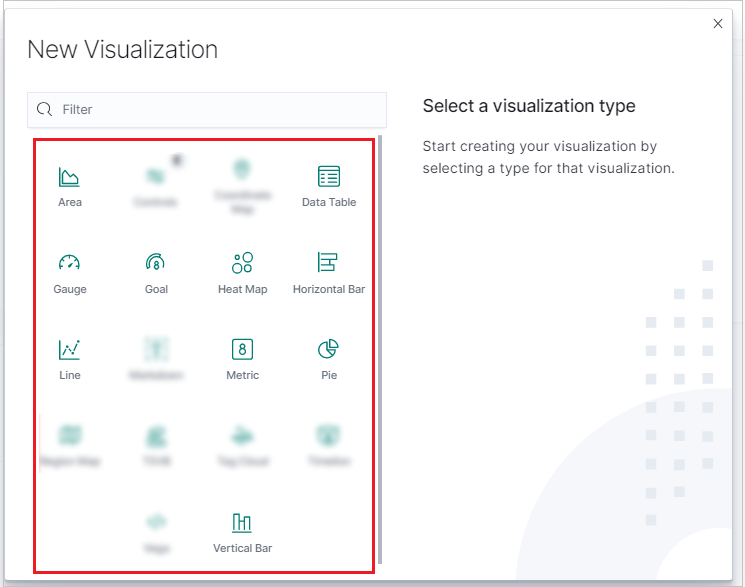
In the New Visualization window, select a visualization type.
After the visualization generates, you can edit the metrics and add up to one bucket.
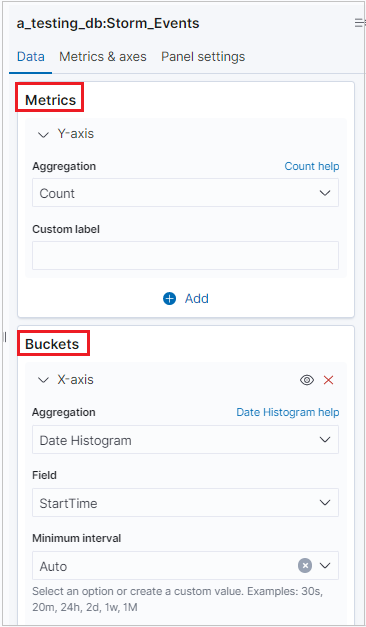
Note
K2Bridge supports one bucket aggregation. Some aggregations support search options. Use the Lucene syntax, not the KQL option, which stands for the Kibana Query Language syntax.
Important
- The following visualizations are supported:
Vertical bar,Area chart,Line chart,Horizontal bar,Pie chart,Gauge,Data table,Heat map,Goal chart, andMetric chart. - The following metrics are supported:
Average,Count,Max,Median,Min,Percentiles,Standard deviation,Sum,Top hitsandUnique count. - The metric
Percentiles ranksis not supported. - Using bucket aggregations is optional, you can visualize data without bucket aggregation.
- The following buckets are supported:
No bucket aggregation,Date histogram,Filters,Range,Date range,Histogram,andTerms. - The buckets
IPv4 rangeandSignificant termsare not supported.
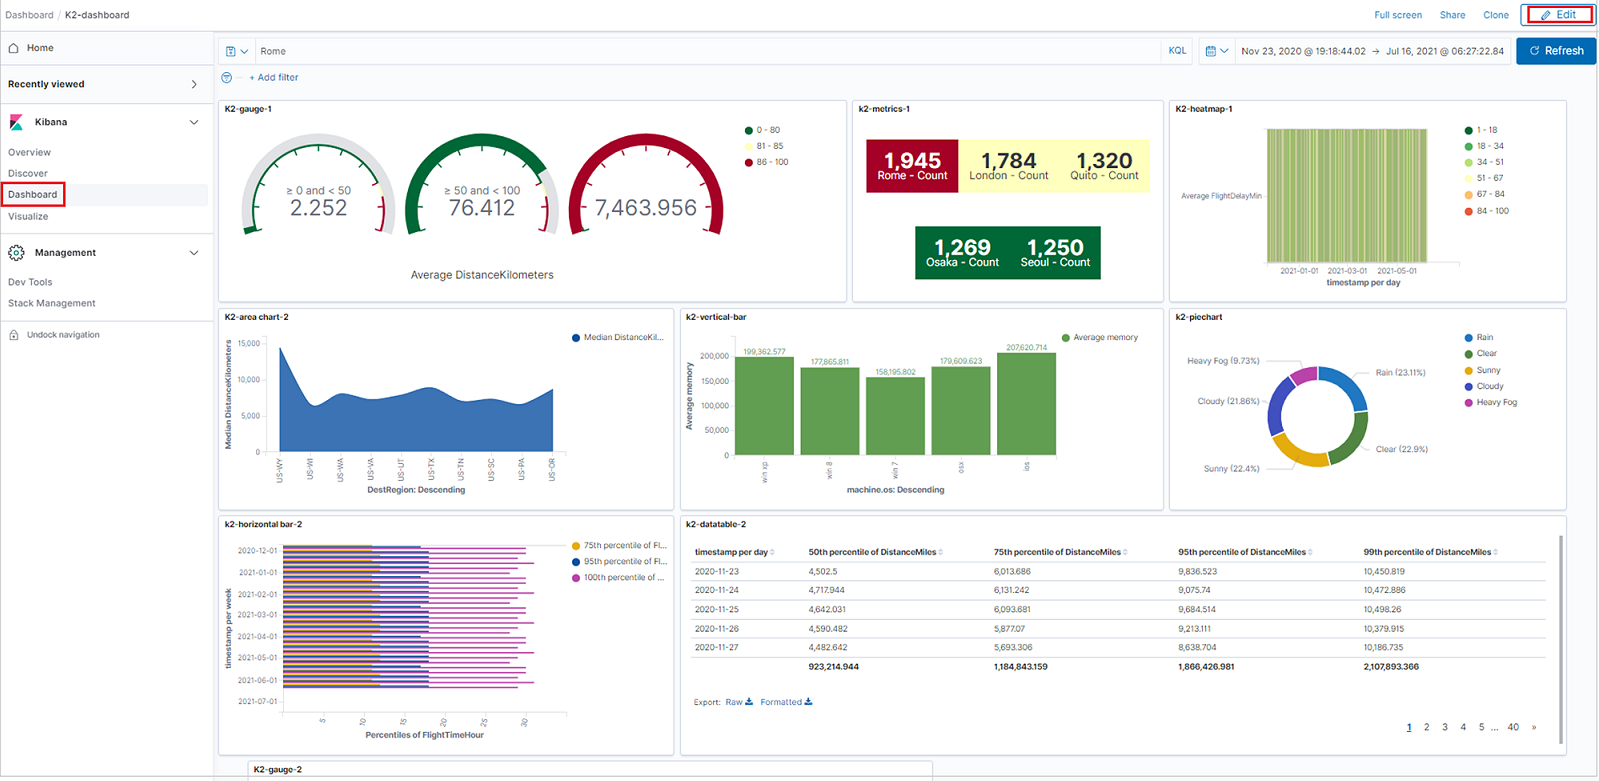
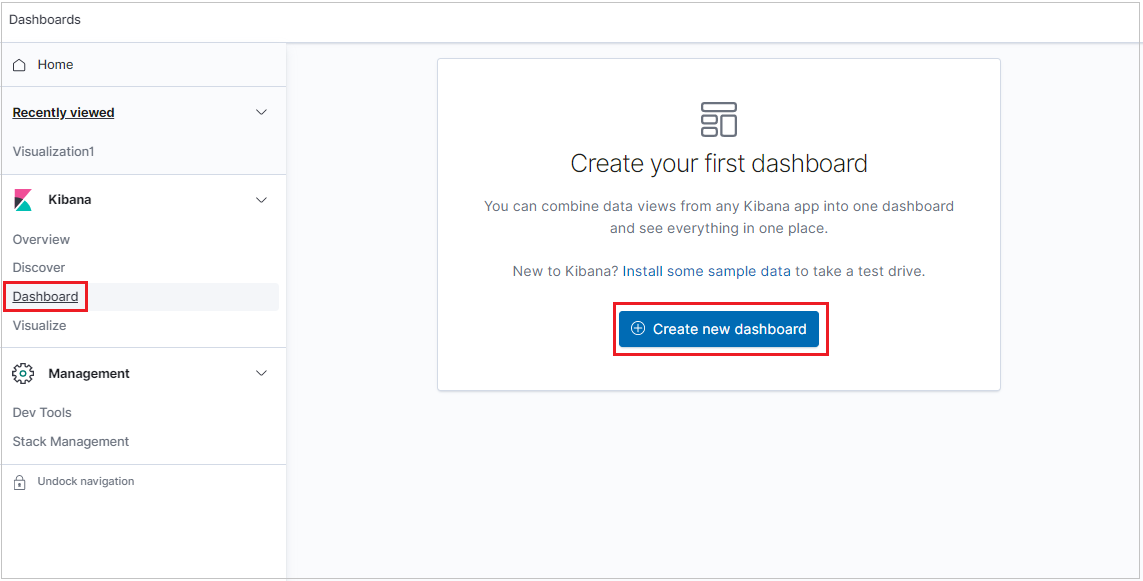
Create dashboards
You can create dashboards with Kibana visualizations to summarize, compare, and contrast at-a-glance views of Azure Data Explorer data.
To create a dashboard, select the Dashboard tab, then click Create new dashboard.
The new dashboard opens in edit mode.
To add a new visualization panel, click Create new.
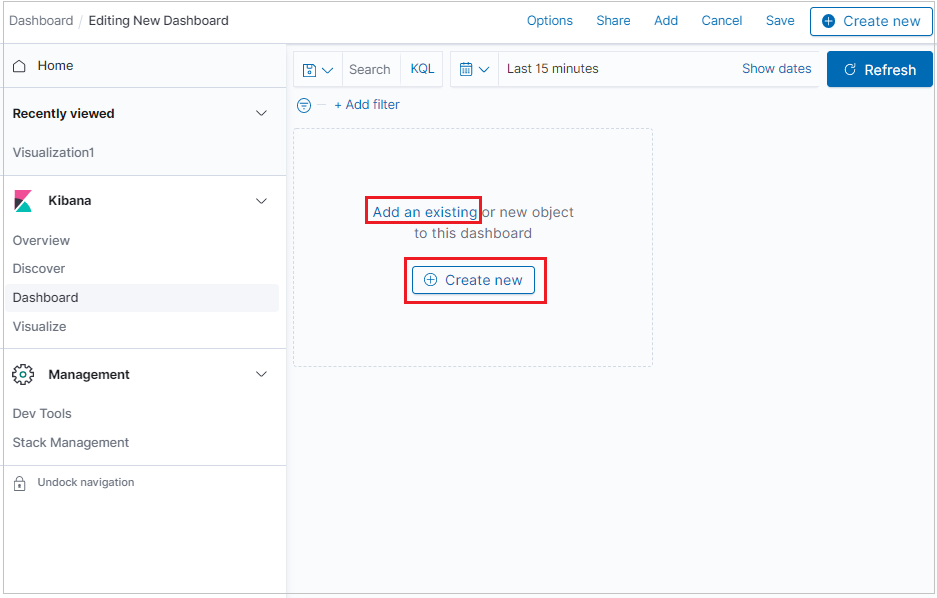
To add a visualization you already created, click Add an existing and select a visualization.
To arrange panels, organize panels by priority, resize the panels, and more, click Edit, then use the following options:
- To move a panel, click and hold the panel header, then drag to the new location.
- To resize a panel, click the resize control, then drag to the new dimensions.