series_shapes_fl()
The function series_shapes_fl() is a user-defined function (UDF) that detects positive/negative trend or jump in a series. This function takes a table containing multiple time series (dynamic numerical array), and calculates trend and jump scores for each series. The output is a dictionary (dynamic) containing the scores.
Syntax
T | extend series_shapes_fl(y_series, advanced)
Learn more about syntax conventions.
Parameters
| Name | Type | Required | Description |
|---|---|---|---|
| y_series | dynamic |
✔️ | An array cell of numeric values. |
| advanced | bool |
The default is false. Set to true to output additional calculated parameters. |
Function definition
You can define the function by either embedding its code as a query-defined function, or creating it as a stored function in your database, as follows:
Define the function using the following let statement. No permissions are required.
Important
A let statement can't run on its own. It must be followed by a tabular expression statement. To run a working example of series_shapes_fl(), see Example.
let series_shapes_fl=(series:dynamic, advanced:bool=false)
{
    let n = array_length(series);
//  calculate normal dynamic range between 10th and 90th percentiles
    let xs = array_sort_asc(series);
    let low_idx = tolong(n*0.1);
    let high_idx = tolong(n*0.9);
    let low_pct = todouble(xs[low_idx]);
    let high_pct = todouble(xs[high_idx]);
    let norm_range = high_pct-low_pct;
//  trend score
    let lf = series_fit_line_dynamic(series);
    let slope = todouble(lf.slope);
    let rsquare = todouble(lf.rsquare);
    let rel_slope = abs(n*slope/norm_range);
    let sign_slope = iff(slope >= 0.0, 1.0, -1.0);
    let norm_slope = sign_slope*rel_slope/(rel_slope+0.1);  //  map rel_slope from [-Inf, +Inf] to [-1, 1]; 0.1 is a clibration constant
    let trend_score = norm_slope*rsquare;
//  jump score
    let lf2=series_fit_2lines_dynamic(series);
    let lslope = todouble(lf2.left.slope);
    let rslope = todouble(lf2.right.slope);
    let rsquare2 = todouble(lf2.rsquare);
    let split_idx = tolong(lf2.split_idx);
    let last_left = todouble(lf2.left.interception)+lslope*split_idx;
    let first_right = todouble(lf2.right.interception)+rslope;
    let jump = first_right-last_left;
    let rel_jump = abs(jump/norm_range);
    let sign_jump = iff(first_right >= last_left, 1.0, -1.0);
    let norm_jump = sign_jump*rel_jump/(rel_jump+0.1);  //  map rel_jump from [-Inf, +Inf] to [-1, 1]; 0.1 is a clibration constant
    let jump_score1 = norm_jump*rsquare2;
//  filter for jumps that are not close to the series edges and the right slope has the same direction
    let norm_rslope = abs(rslope/norm_range);
    let jump_score = iff((sign_jump*rslope >= 0.0 or norm_rslope < 0.02) and split_idx between((0.1*n)..(0.9*n)), jump_score1, 0.0);
    let res = iff(advanced, bag_pack("n", n, "low_pct", low_pct, "high_pct", high_pct, "norm_range", norm_range, "slope", slope, "rsquare", rsquare, "rel_slope", rel_slope, "norm_slope", norm_slope,
                              "trend_score", trend_score, "split_idx", split_idx, "jump", jump, "rsquare2", rsquare2, "last_left", last_left, "first_right", first_right, "rel_jump", rel_jump,
                              "lslope", lslope, "rslope", rslope, "norm_rslope", norm_rslope, "norm_jump", norm_jump, "jump_score", jump_score)
                              , bag_pack("trend_score", trend_score, "jump_score", jump_score));
    res
};
// Write your query to use the function here.
Example
To use a query-defined function, invoke it after the embedded function definition.
let series_shapes_fl=(series:dynamic, advanced:bool=false)
{
let n = array_length(series);
// calculate normal dynamic range between 10th and 90th percentiles
let xs = array_sort_asc(series);
let low_idx = tolong(n*0.1);
let high_idx = tolong(n*0.9);
let low_pct = todouble(xs[low_idx]);
let high_pct = todouble(xs[high_idx]);
let norm_range = high_pct-low_pct;
// trend score
let lf = series_fit_line_dynamic(series);
let slope = todouble(lf.slope);
let rsquare = todouble(lf.rsquare);
let rel_slope = abs(n*slope/norm_range);
let sign_slope = iff(slope >= 0.0, 1.0, -1.0);
let norm_slope = sign_slope*rel_slope/(rel_slope+0.1); // map rel_slope from [-Inf, +Inf] to [-1, 1]; 0.1 is a clibration constant
let trend_score = norm_slope*rsquare;
// jump score
let lf2=series_fit_2lines_dynamic(series);
let lslope = todouble(lf2.left.slope);
let rslope = todouble(lf2.right.slope);
let rsquare2 = todouble(lf2.rsquare);
let split_idx = tolong(lf2.split_idx);
let last_left = todouble(lf2.left.interception)+lslope*split_idx;
let first_right = todouble(lf2.right.interception)+rslope;
let jump = first_right-last_left;
let rel_jump = abs(jump/norm_range);
let sign_jump = iff(first_right >= last_left, 1.0, -1.0);
let norm_jump = sign_jump*rel_jump/(rel_jump+0.1); // map rel_jump from [-Inf, +Inf] to [-1, 1]; 0.1 is a clibration constant
let jump_score1 = norm_jump*rsquare2;
// filter for jumps that are not close to the series edges and the right slope has the same direction
let norm_rslope = abs(rslope/norm_range);
let jump_score = iff((sign_jump*rslope >= 0.0 or norm_rslope < 0.02) and split_idx between((0.1*n)..(0.9*n)), jump_score1, 0.0);
let res = iff(advanced, bag_pack("n", n, "low_pct", low_pct, "high_pct", high_pct, "norm_range", norm_range, "slope", slope, "rsquare", rsquare, "rel_slope", rel_slope, "norm_slope", norm_slope,
"trend_score", trend_score, "split_idx", split_idx, "jump", jump, "rsquare2", rsquare2, "last_left", last_left, "first_right", first_right, "rel_jump", rel_jump,
"lslope", lslope, "rslope", rslope, "norm_rslope", norm_rslope, "norm_jump", norm_jump, "jump_score", jump_score)
, bag_pack("trend_score", trend_score, "jump_score", jump_score));
res
};
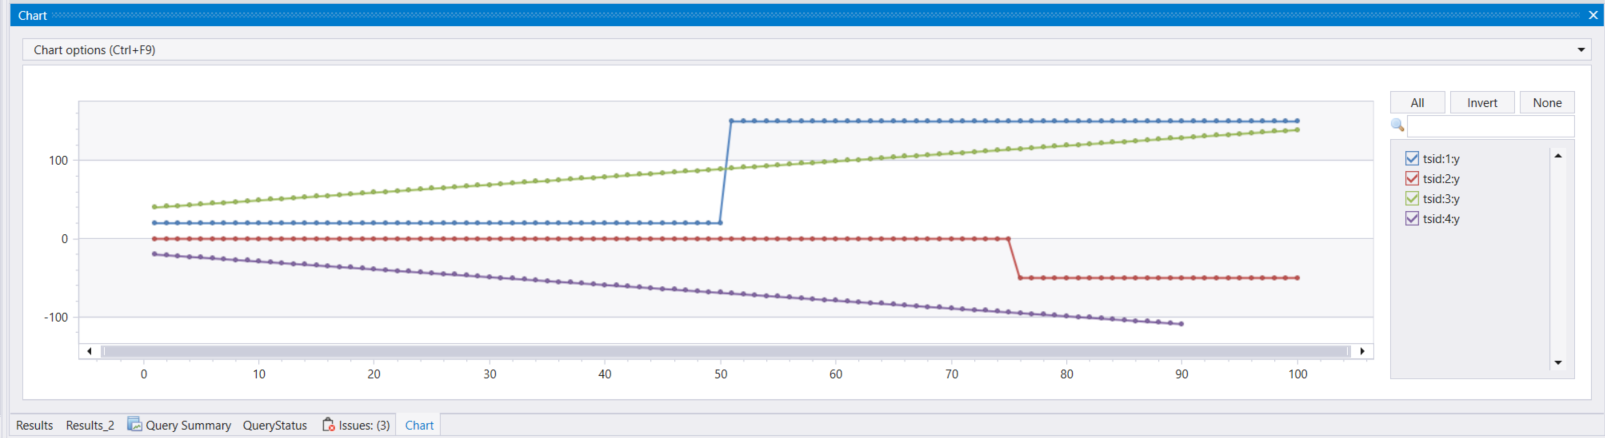
let ts_len = 100;
let noise_pct = 2;
let noise_gain = 3;
union
(print tsid=1 | extend y = array_concat(repeat(20, ts_len/2), repeat(150, ts_len/2))),
(print tsid=2 | extend y = array_concat(repeat(0, ts_len*3/4), repeat(-50, ts_len/4))),
(print tsid=3 | extend y = range(40, 139, 1)),
(print tsid=4 | extend y = range(-20, -109, -1))
| extend x = range(1, array_length(y), 1)
//
| extend shapes = series_shapes_fl(y)
| order by tsid asc
| fork (take 4) (project tsid, shapes)
| render timechart with(series=tsid, xcolumn=x, ycolumns=y)
Output
The respective trend and jump scores:
tsid	shapes
1	    {
          "trend_score": 0.703199714530169,
          "jump_score": 0.90909090909090906
        }
2	    {
          "trend_score": -0.51663751343174869,
          "jump_score": -0.90909090909090906
        }
3	    {
          "trend_score": 0.92592592592592582,
          "jump_score": 0.0
        }
4	    {
          "trend_score": -0.92592592592592582,
          "jump_score": 0.0
        }
Feedback
Coming soon: Throughout 2024 we will be phasing out GitHub Issues as the feedback mechanism for content and replacing it with a new feedback system. For more information see: https://aka.ms/ContentUserFeedback.
Submit and view feedback for