geo_point_to_s2cell()
Calculates the S2 cell token string value of a geographic location.
S2 cell can be a useful geospatial clustering tool. An S2 cell is a cell on a spherical surface and it has geodesic edges. S2 cells are part of a hierarchy dividing up the Earth's surface. They have a maximum of 31 levels, ranging from zero to 30, which define the number of times a cell is subdivided. Levels range from the largest coverage on level zero with area coverage of 85,011,012.19km², to the lowest coverage of 0.44 cm² at level 30. As S2 cells are subdivided at higher levels, the cell center is preserved well. Two geographic locations can be very close to each other but they have different S2 cell tokens.
Note
If you invoke the geo_s2cell_to_central_point() function on an S2 cell token string that was calculated on longitude x and latitude y, the function won't necessarily return x and y.
Read more about S2 cell hierarchy.
Syntax
geo_point_to_s2cell(longitude, latitude, [ level ])
Learn more about syntax conventions.
Parameters
| Name | Type | Required | Description |
|---|---|---|---|
| longitude | real |
✔️ | Geospatial coordinate, longitude value in degrees. Valid value is a real number and in the range [-180, +180]. |
| latitude | real |
✔️ | Geospatial coordinate, latitude value in degrees. Valid value is a real number and in the range [-90, +90]. |
| level | int |
Defines the requested cell level. Supported values are in the range [0, 30]. If unspecified, the default value 11 is used. |
Returns
The S2 cell token string value of a given geographic location. If the coordinates or levels are invalid, the query produces an empty result.
S2 cell approximate area coverage per level value
For every level, the size of the S2 cell is similar but not exactly equal. Nearby cell sizes tend to be more equal.
| Level | Minimum random cell edge length (UK) | Maximum random cell edge length (US) |
|---|---|---|
| 0 | 7842 km | 7842 km |
| 1 | 3921 km | 5004 km |
| 2 | 1825 km | 2489 km |
| 3 | 840 km | 1310 km |
| 4 | 432 km | 636 km |
| 5 | 210 km | 315 km |
| 6 | 108 km | 156 km |
| 7 | 54 km | 78 km |
| 8 | 27 km | 39 km |
| 9 | 14 km | 20 km |
| 10 | 7 km | 10 km |
| 11 | 3 km | 5 km |
| 12 | 1699 m | 2 km |
| 13 | 850 m | 1225 m |
| 14 | 425 m | 613 m |
| 15 | 212 m | 306 m |
| 16 | 106 m | 153 m |
| 17 | 53 m | 77 m |
| 18 | 27 m | 38 m |
| 19 | 13 m | 19 m |
| 20 | 7 m | 10 m |
| 21 | 3 m | 5 m |
| 22 | 166 cm | 2 m |
| 23 | 83 cm | 120 cm |
| 24 | 41 cm | 60 cm |
| 25 | 21 cm | 30 cm |
| 26 | 10 cm | 15 cm |
| 27 | 5 cm | 7 cm |
| 28 | 2 cm | 4 cm |
| 29 | 12 mm | 18 mm |
| 30 | 6 mm | 9 mm |
The table source can be found in this S2 Cell statistical resource.
For comparison with other available grid systems, see geospatial clustering with Kusto Query Language.
Examples
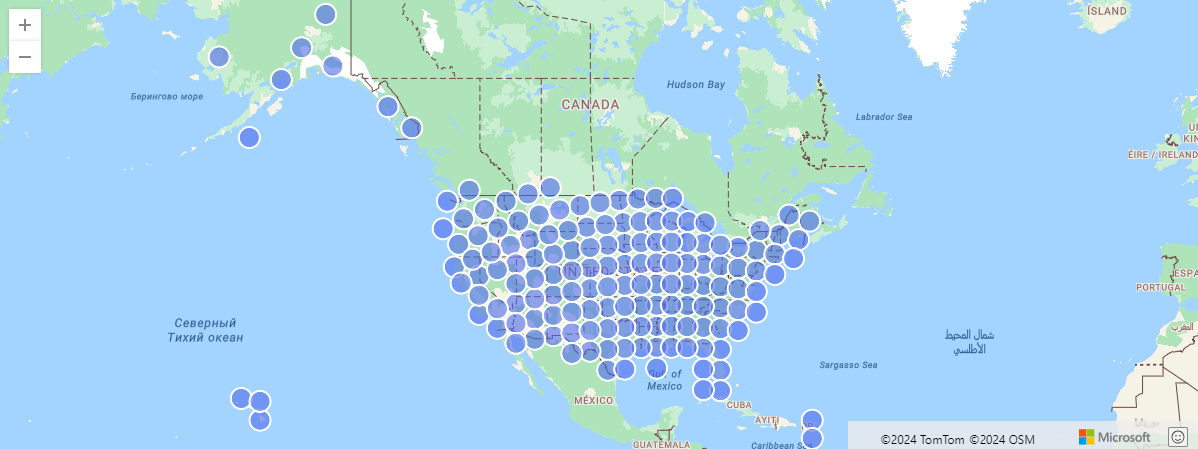
US storm events aggregated by S2 cell
The following example finds US storm events aggregated by S2 cells.
StormEvents
| project BeginLon, BeginLat
| summarize by hash=geo_point_to_s2cell(BeginLon, BeginLat, 5)
| project geo_s2cell_to_central_point(hash)
| render scatterchart with (kind=map)
Output
The following example calculates the S2 cell ID.
print s2cell = geo_point_to_s2cell(-80.195829, 25.802215, 8)
Output
| s2cell |
|---|
| 88d9b |
Find a group of coordinates
The following example finds groups of coordinates. Every pair of coordinates in the group resides in the S2 cell with a maximum area of 1632.45 km².
datatable(location_id:string, longitude:real, latitude:real)
[
  "A", 10.1234, 53,
  "B", 10.3579, 53,
  "C", 10.6842, 53,
]
| summarize count = count(),                                        // items per group count
            locations = make_list(location_id)                      // items in the group
            by s2cell = geo_point_to_s2cell(longitude, latitude, 8) // s2 cell of the group
Output
| s2cell | count | locations |
|---|---|---|
| 47b1d | 2 | ["A","B"] |
| 47ae3 | 1 | ["C"] |
Empty results
The following example produces an empty result because of the invalid coordinate input.
print s2cell = geo_point_to_s2cell(300,1,8)
Output
| s2cell |
|---|
The following example produces an empty result because of the invalid level input.
print s2cell = geo_point_to_s2cell(1,1,35)
Output
| s2cell |
|---|
The following example produces an empty result because of the invalid level input.
print s2cell = geo_point_to_s2cell(1,1,int(null))
Output
| s2cell |
|---|
Related content
Feedback
Coming soon: Throughout 2024 we will be phasing out GitHub Issues as the feedback mechanism for content and replacing it with a new feedback system. For more information see: https://aka.ms/ContentUserFeedback.
Submit and view feedback for