Plotly (preview)
The Plotly graphics library supports ~80 chart types that are useful for advanced charting including geographic, scientific, machine learning, 3d, animation, and many other chart types. For more information, see Plotly.
To render a Plotly visual in Kusto Query Language, the query must generate a table with a single string cell containing Plotly JSON. This Plotly JSON string can be generated by one of the following two methods:
Write your own Plotly visualization in Python
In this method, you dynamically create the Plotly JSON string in Python using the Plotly package. This process requires use of the python() plugin. The Python script is run on the existing Azure Data Explorer nodes using the inline python() plugin. It generates a Plotly JSON that is rendered by the client application.
Using this method, all types of Plotly visualizations are supported.
Note
For best performance, make sure that the python plugin image contains the latest version of the Python engine (currently 3.10.8). This can be checked with the get_packages_version_fl() function. To upgrade the Python image see Change the Python language extensions image on your cluster.
Example
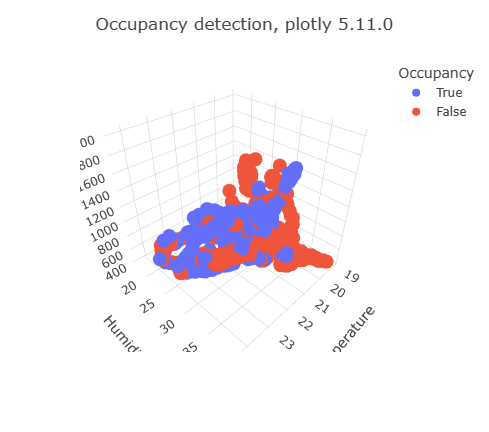
The following KQL query uses inline Python to create a 3D scatter chart:
OccupancyDetection
| project Temperature, Humidity, CO2, Occupancy
| where rand() < 0.1
| evaluate python(typeof(plotly:string),
```if 1:
    import plotly.express as px
    fig = px.scatter_3d(df, x='Temperature', y='Humidity', z='CO2', color='Occupancy')
    fig.update_layout(title=dict(text="Occupancy detection, plotly 5.11.0"))
    plotly_obj = fig.to_json()
    result = pd.DataFrame(data = [plotly_obj], columns = ["plotly"])
```)

The Plotly graphics library supports ~80 chart types including basic charts, scientific, statistical, financial, maps, 3D, animations, and more. To render a Plotly visual in KQL, the query must generate a table with a single string cell containing Plotly JSON.
Since python is not available in this service, you create this Plotly JSON using a preprepared template.
Use a preprepared Plotly template
In this method, a preprepared Plotly JSON for specific visualization can be reused by replacing the data objects with the required data to be rendered. The templates can be stored in a standard Azure Data Explorer table, and the data replacement logic can be packed in a stored function.
Currently, the supported templates are: plotly_anomaly_fl() and plotly_scatter3d_fl(). Refer to these documents for syntax and usage.
Example
let plotly_scatter3d_fl=(tbl:(*), x_col:string, y_col:string, z_col:string, aggr_col:string='', chart_title:string='3D Scatter chart')
{
    let scatter3d_chart = toscalar(PlotlyTemplate | where name == "scatter3d" | project plotly);
    let tbl_ex = tbl | extend _x = column_ifexists(x_col, 0.0), _y = column_ifexists(y_col, 0.0), _z = column_ifexists(z_col, 0.0), _aggr = column_ifexists(aggr_col, 'ALL');
    tbl_ex
    | serialize
    | summarize _x=pack_array(make_list(_x)), _y=pack_array(make_list(_y)), _z=pack_array(make_list(_z)) by _aggr
    | summarize _aggr=make_list(_aggr), _x=make_list(_x), _y=make_list(_y), _z=make_list(_z)
    | extend plotly = scatter3d_chart
    | extend plotly=replace_string(plotly, '$CLASS1$', tostring(_aggr[0]))
    | extend plotly=replace_string(plotly, '$CLASS2$', tostring(_aggr[1]))
    | extend plotly=replace_string(plotly, '$CLASS3$', tostring(_aggr[2]))
    | extend plotly=replace_string(plotly, '$X_NAME$', x_col)
    | extend plotly=replace_string(plotly, '$Y_NAME$', y_col)
    | extend plotly=replace_string(plotly, '$Z_NAME$', z_col)
    | extend plotly=replace_string(plotly, '$CLASS1_X$', tostring(_x[0]))
    | extend plotly=replace_string(plotly, '$CLASS1_Y$', tostring(_y[0]))
    | extend plotly=replace_string(plotly, '$CLASS1_Z$', tostring(_z[0]))
    | extend plotly=replace_string(plotly, '$CLASS2_X$', tostring(_x[1]))
    | extend plotly=replace_string(plotly, '$CLASS2_Y$', tostring(_y[1]))
    | extend plotly=replace_string(plotly, '$CLASS2_Z$', tostring(_z[1]))
    | extend plotly=replace_string(plotly, '$CLASS3_X$', tostring(_x[2]))
    | extend plotly=replace_string(plotly, '$CLASS3_Y$', tostring(_y[2]))
    | extend plotly=replace_string(plotly, '$CLASS3_Z$', tostring(_z[2]))
    | extend plotly=replace_string(plotly, '$TITLE$', chart_title)
    | project plotly
};
Iris
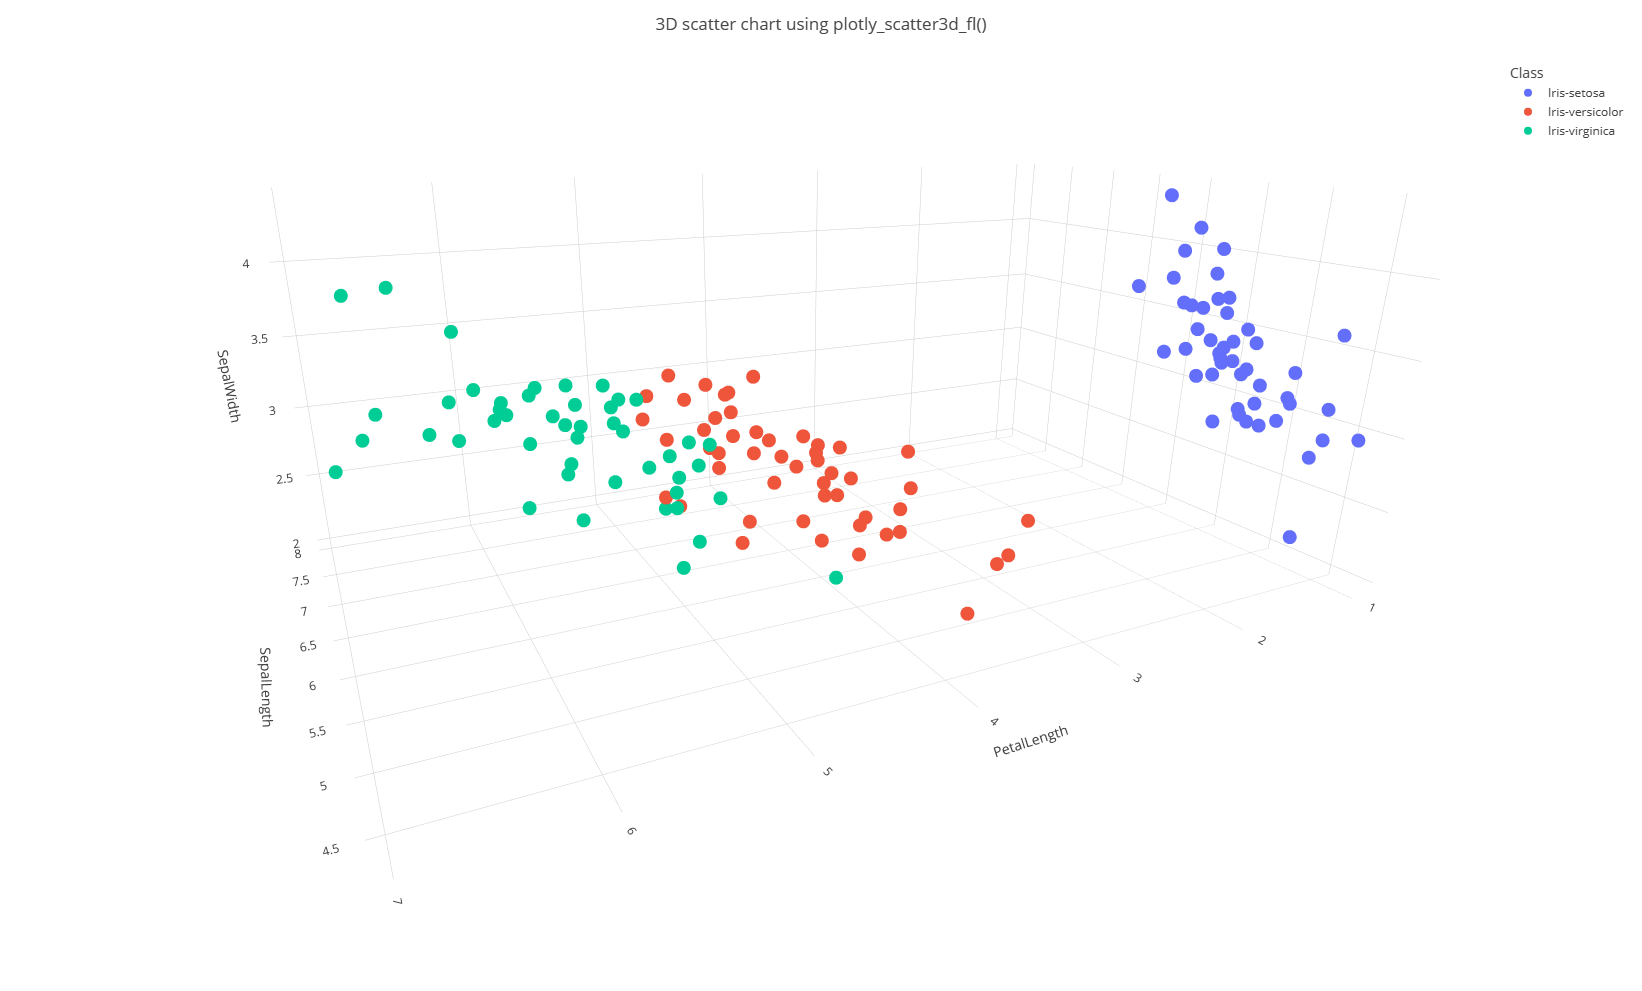
| invoke plotly_scatter3d_fl(x_col='SepalLength', y_col='PetalLength', z_col='SepalWidth', aggr_col='Class', chart_title='3D scatter chart using plotly_scatter3d_fl()')
| render plotly

Related content
Feedback
Coming soon: Throughout 2024 we will be phasing out GitHub Issues as the feedback mechanism for content and replacing it with a new feedback system. For more information see: https://aka.ms/ContentUserFeedback.
Submit and view feedback for