plotly_scatter3d_fl()
The function plotly_scatter3d_fl() is a user-defined function (UDF) that allows you to customize a plotly template to create an interactive 3D scatter chart.
The function accepts a table containing the records to be rendered, the names of the x, y, z & aggregation columns, and the chart title string. The function returns a single cell table containing plotly JSON. Optionally, you can render the data in an Azure Data Explorer dashboard tile. For more information, see Plotly (preview).
Prerequisite
Extract the required 'scatter3d' template from the publicly available PlotlyTemplate table. Copy this table from the Samples database to your database by running the following KQL command from your target database:
.set PlotlyTemplate <| cluster('help.kusto.windows.net').database('Samples').PlotlyTemplate
Syntax
T | invoke plotly_scatter3d_fl(x_col, y_col, z_col, aggr_col [, chart_title ])
Learn more about syntax conventions.
Parameters
| Name | Type | Required | Description |
|---|---|---|---|
| x_col | string |
✔️ | The name of the column for the X coordinated of the 3D plot. |
| y_col | string |
✔️ | The name of the column for the Y coordinated of the 3D plot. |
| z_col | string |
✔️ | The name of the column for the Z coordinated of the 3D plot. |
| aggr_col | string |
✔️ | The name of the grouping column. Records in the same group are rendered in distinct color. |
| chart_title | string |
The chart title. The default is '3D Scatter chart'. |
Function definition
You can define the function by either embedding its code as a query-defined function, or creating it as a stored function in your database, as follows:
Define the function using the following let statement. No permissions are required.
Important
A let statement can't run on its own. It must be followed by a tabular expression statement. To run a working example of plotly_scatter3d_fl(), see Example.
let plotly_scatter3d_fl=(tbl:(*), x_col:string, y_col:string, z_col:string, aggr_col:string='', chart_title:string='3D Scatter chart')
{
    let scatter3d_chart = toscalar(PlotlyTemplate | where name == "scatter3d" | project plotly);
    let tbl_ex = tbl | extend _x = column_ifexists(x_col, 0.0), _y = column_ifexists(y_col, 0.0), _z = column_ifexists(z_col, 0.0), _aggr = column_ifexists(aggr_col, 'ALL');
    tbl_ex
    | serialize
    | summarize _x=pack_array(make_list(_x)), _y=pack_array(make_list(_y)), _z=pack_array(make_list(_z)) by _aggr
    | summarize _aggr=make_list(_aggr), _x=make_list(_x), _y=make_list(_y), _z=make_list(_z)
    | extend plotly = scatter3d_chart
    | extend plotly=replace_string(plotly, '$CLASS1$', tostring(_aggr[0]))
    | extend plotly=replace_string(plotly, '$CLASS2$', tostring(_aggr[1]))
    | extend plotly=replace_string(plotly, '$CLASS3$', tostring(_aggr[2]))
    | extend plotly=replace_string(plotly, '$X_NAME$', x_col)
    | extend plotly=replace_string(plotly, '$Y_NAME$', y_col)
    | extend plotly=replace_string(plotly, '$Z_NAME$', z_col)
    | extend plotly=replace_string(plotly, '$CLASS1_X$', tostring(_x[0]))
    | extend plotly=replace_string(plotly, '$CLASS1_Y$', tostring(_y[0]))
    | extend plotly=replace_string(plotly, '$CLASS1_Z$', tostring(_z[0]))
    | extend plotly=replace_string(plotly, '$CLASS2_X$', tostring(_x[1]))
    | extend plotly=replace_string(plotly, '$CLASS2_Y$', tostring(_y[1]))
    | extend plotly=replace_string(plotly, '$CLASS2_Z$', tostring(_z[1]))
    | extend plotly=replace_string(plotly, '$CLASS3_X$', tostring(_x[2]))
    | extend plotly=replace_string(plotly, '$CLASS3_Y$', tostring(_y[2]))
    | extend plotly=replace_string(plotly, '$CLASS3_Z$', tostring(_z[2]))
    | extend plotly=replace_string(plotly, '$TITLE$', chart_title)
    | project plotly
};
// Write your query to use your function here.
Example
The following example uses the invoke operator to run the function.
To use a query-defined function, invoke it after the embedded function definition.
let plotly_scatter3d_fl=(tbl:(*), x_col:string, y_col:string, z_col:string, aggr_col:string='', chart_title:string='3D Scatter chart')
{
let scatter3d_chart = toscalar(PlotlyTemplate | where name == "scatter3d" | project plotly);
let tbl_ex = tbl | extend _x = column_ifexists(x_col, 0.0), _y = column_ifexists(y_col, 0.0), _z = column_ifexists(z_col, 0.0), _aggr = column_ifexists(aggr_col, 'ALL');
tbl_ex
| serialize
| summarize _x=pack_array(make_list(_x)), _y=pack_array(make_list(_y)), _z=pack_array(make_list(_z)) by _aggr
| summarize _aggr=make_list(_aggr), _x=make_list(_x), _y=make_list(_y), _z=make_list(_z)
| extend plotly = scatter3d_chart
| extend plotly=replace_string(plotly, '$CLASS1$', tostring(_aggr[0]))
| extend plotly=replace_string(plotly, '$CLASS2$', tostring(_aggr[1]))
| extend plotly=replace_string(plotly, '$CLASS3$', tostring(_aggr[2]))
| extend plotly=replace_string(plotly, '$X_NAME$', x_col)
| extend plotly=replace_string(plotly, '$Y_NAME$', y_col)
| extend plotly=replace_string(plotly, '$Z_NAME$', z_col)
| extend plotly=replace_string(plotly, '$CLASS1_X$', tostring(_x[0]))
| extend plotly=replace_string(plotly, '$CLASS1_Y$', tostring(_y[0]))
| extend plotly=replace_string(plotly, '$CLASS1_Z$', tostring(_z[0]))
| extend plotly=replace_string(plotly, '$CLASS2_X$', tostring(_x[1]))
| extend plotly=replace_string(plotly, '$CLASS2_Y$', tostring(_y[1]))
| extend plotly=replace_string(plotly, '$CLASS2_Z$', tostring(_z[1]))
| extend plotly=replace_string(plotly, '$CLASS3_X$', tostring(_x[2]))
| extend plotly=replace_string(plotly, '$CLASS3_Y$', tostring(_y[2]))
| extend plotly=replace_string(plotly, '$CLASS3_Z$', tostring(_z[2]))
| extend plotly=replace_string(plotly, '$TITLE$', chart_title)
| project plotly
};
Iris
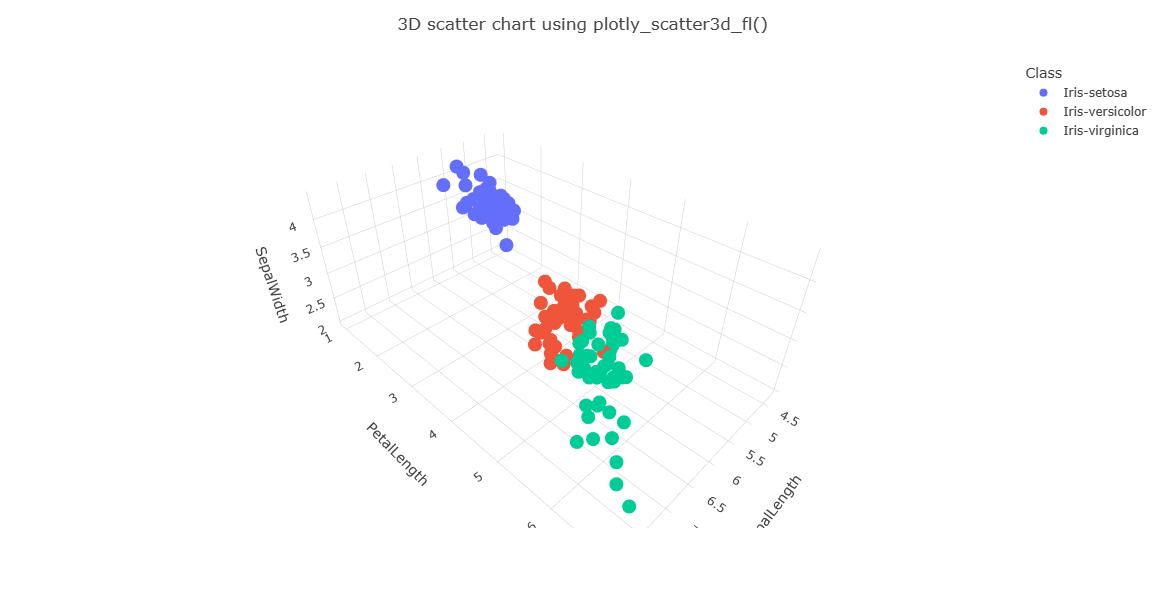
| invoke plotly_scatter3d_fl(x_col='SepalLength', y_col='PetalLength', z_col='SepalWidth', aggr_col='Class', chart_title='3D scatter chart using plotly_scatter3d_fl()')
| render plotly
Output
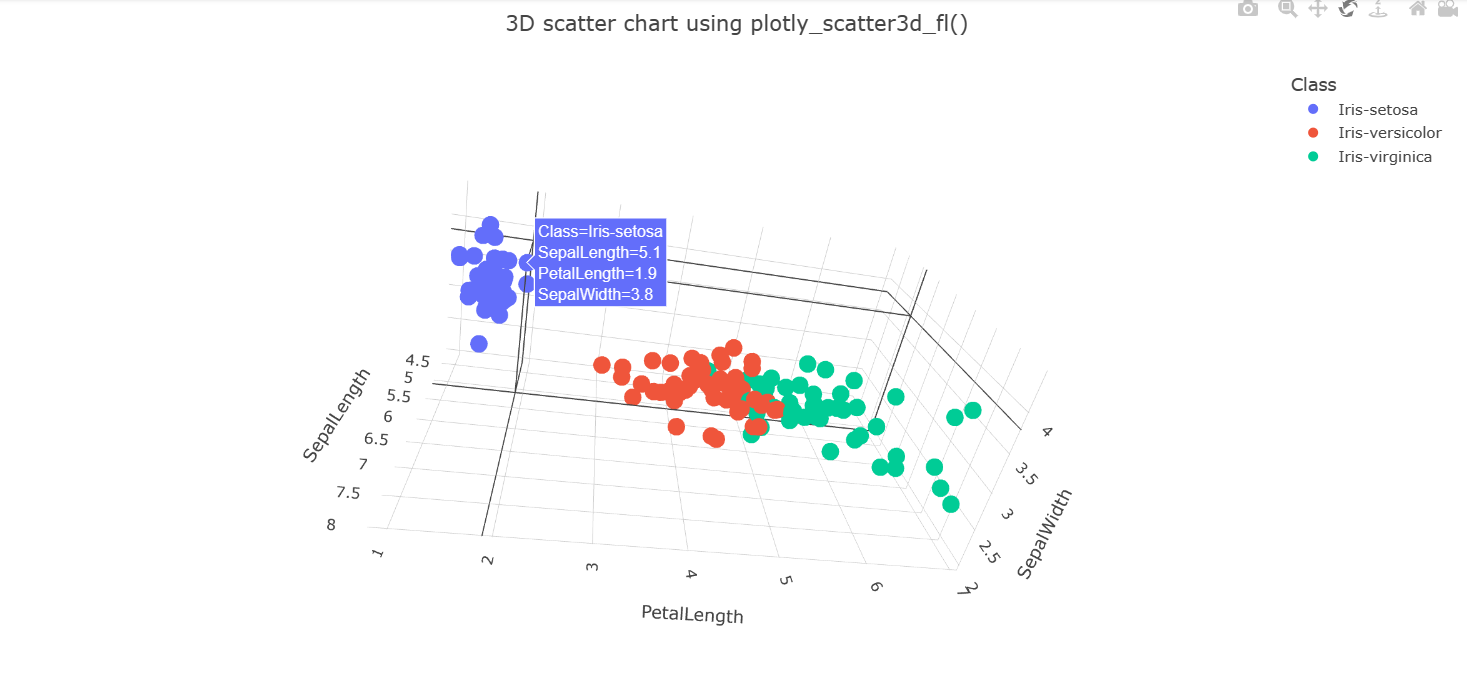
The output is a Plotly JSON string that can be rendered in an Azure Data Explorer dashboard tile. For more information on creating dashboard tiles, see Visualize data with Azure Data Explorer dashboards .
You can rotate, zoom and hover over specific records:
Feedback
Coming soon: Throughout 2024 we will be phasing out GitHub Issues as the feedback mechanism for content and replacing it with a new feedback system. For more information see: https://aka.ms/ContentUserFeedback.
Submit and view feedback for