Monitor VM activity on your Azure Stack Edge Pro GPU device
APPLIES TO:  Azure Stack Edge Pro - GPUAzure Stack Edge Pro 2Azure Stack Edge Pro RAzure Stack Edge Mini R
This article describes how to view activity logs in the Azure portal for virtual machines on your Azure Stack Edge Pro GPU device.
Note
You can zoom in on a VM's CPU and memory usage during periods of activity on the Metrics tab for the virtual machine. For more information, see Monitor VM metrics.
View activity logs
To view activity logs for the virtual machines on your Azure Stack Edge Pro GPU device, do these steps:
Go to the device and then to Virtual Machines. Select Activity log.
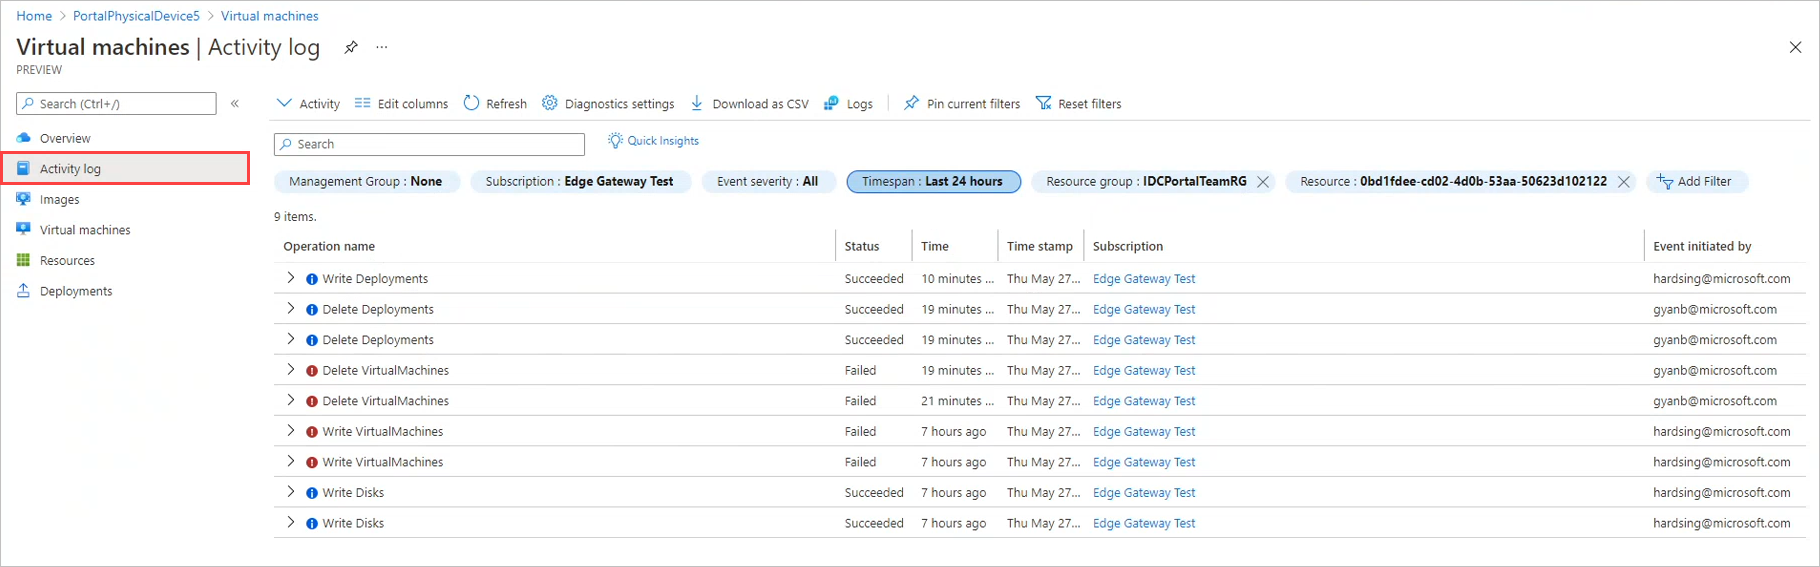
You'll see the VM guest logs for virtual machines on the device.
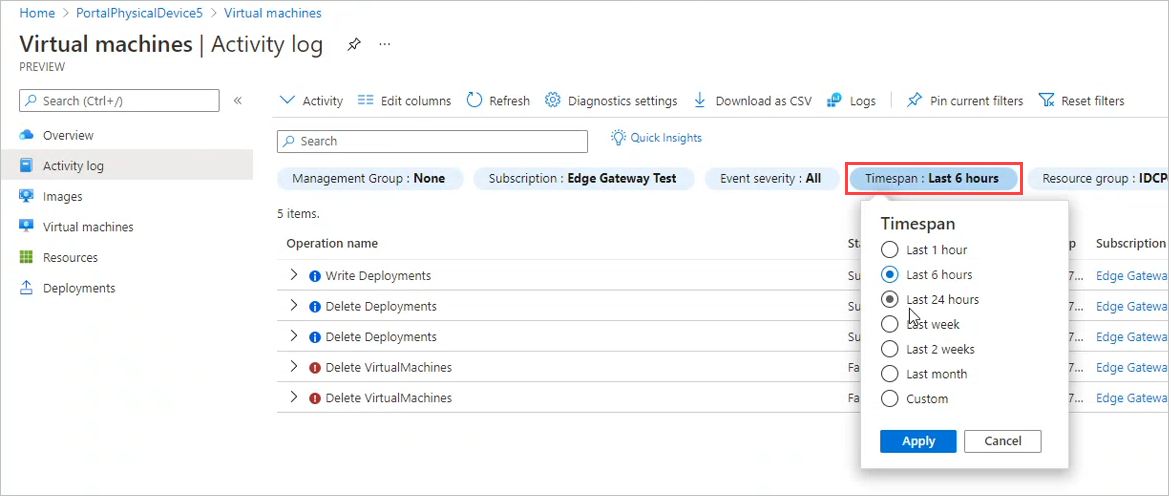
Use filters above the list to target the activity you need to see.
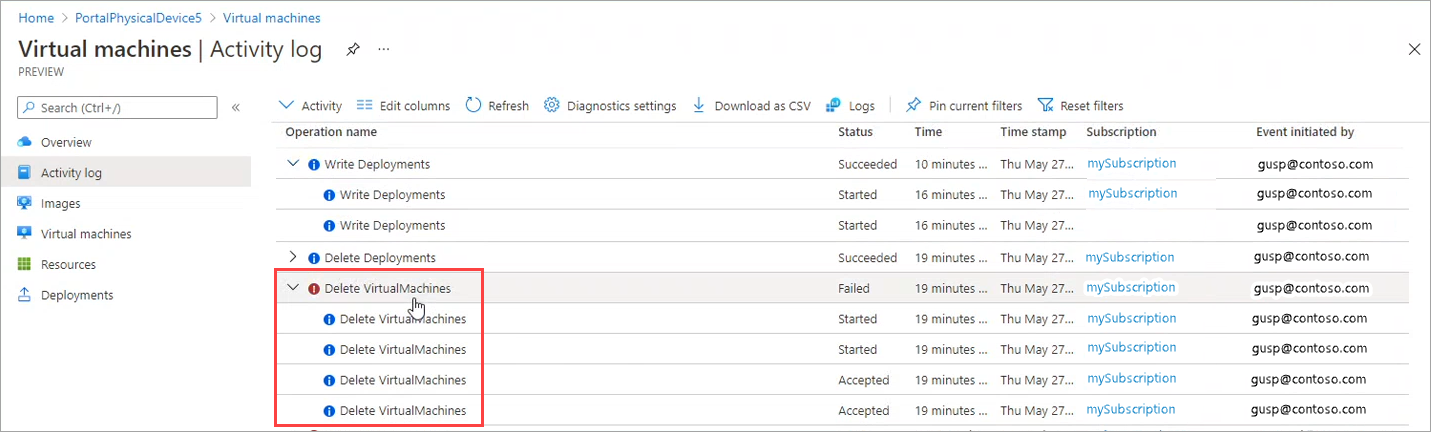
Click the down arrow by an operation name to view the associated activity.
On any Activity log pane in Azure, you can filter and sort activities, select columns to display, drill down to details for a specific activity, and get Quick Insights into errors, failed deployments, alerts, service health, and security changes over the last 24 hours. For more information about the logs and the filtering options, see View activity logs.
Next steps
Feedback
Coming soon: Throughout 2024 we will be phasing out GitHub Issues as the feedback mechanism for content and replacing it with a new feedback system. For more information see: https://aka.ms/ContentUserFeedback.
Submit and view feedback for