Note
Access to this page requires authorization. You can try signing in or changing directories.
Access to this page requires authorization. You can try changing directories.
APPLIES TO:  Azure Stack Edge Pro - GPUAzure Stack Edge Pro 2Azure Stack Edge Pro RAzure Stack Edge Mini R
This article describes how to monitor CPU and memory metrics for a virtual machine on your Azure Stack Edge Pro GPU device.
About VM metrics
The Metrics tab for a virtual machine lets you view CPU and memory metrics, adjusting the time period and zooming in on periods of interest.
The VM metrics are based on CPU and memory usage data collected from the VM's guest operating system. Resource usage is sampled once per minute.
If a device is disconnected, metrics are cached on the device. When the device is reconnected, the metrics are pushed from the cache, and the VM Metrics are updated.
Monitor CPU and memory metrics
Open the device in the Azure portal, and go to Virtual Machines. Select the virtual machine, and select Metrics.
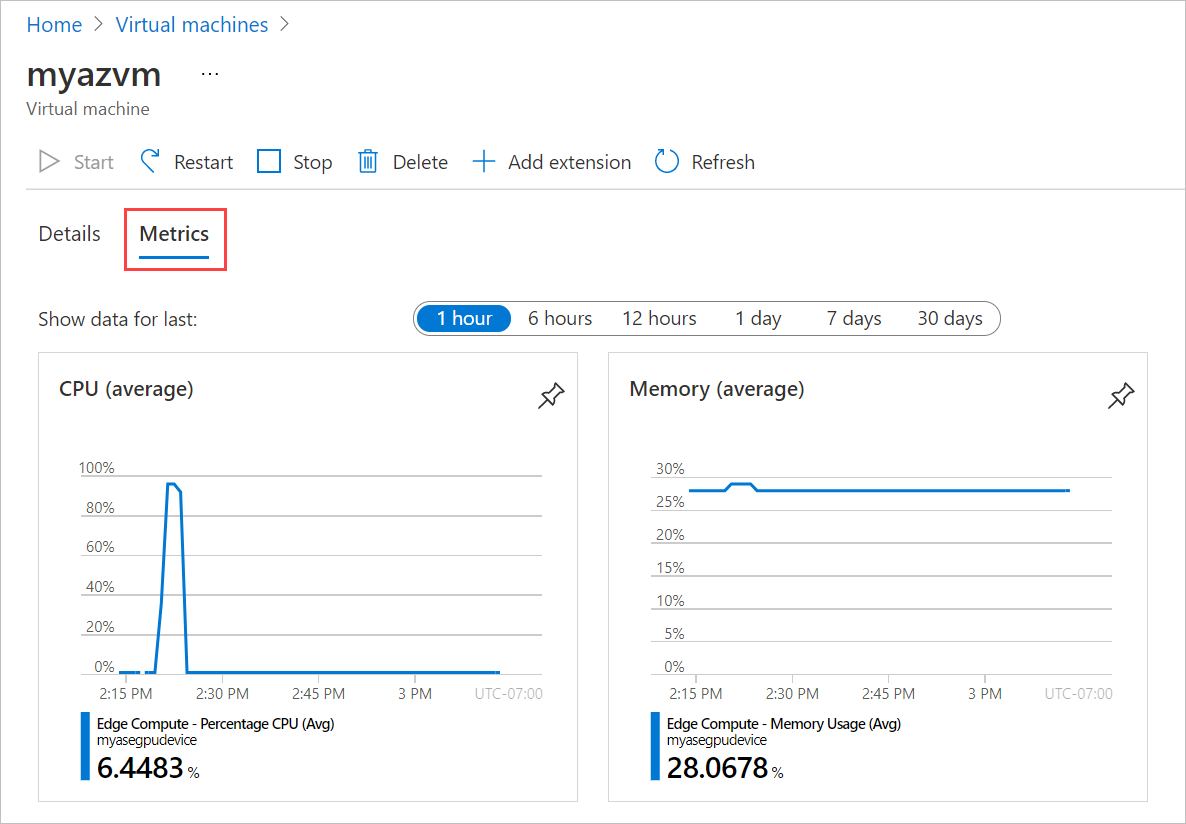
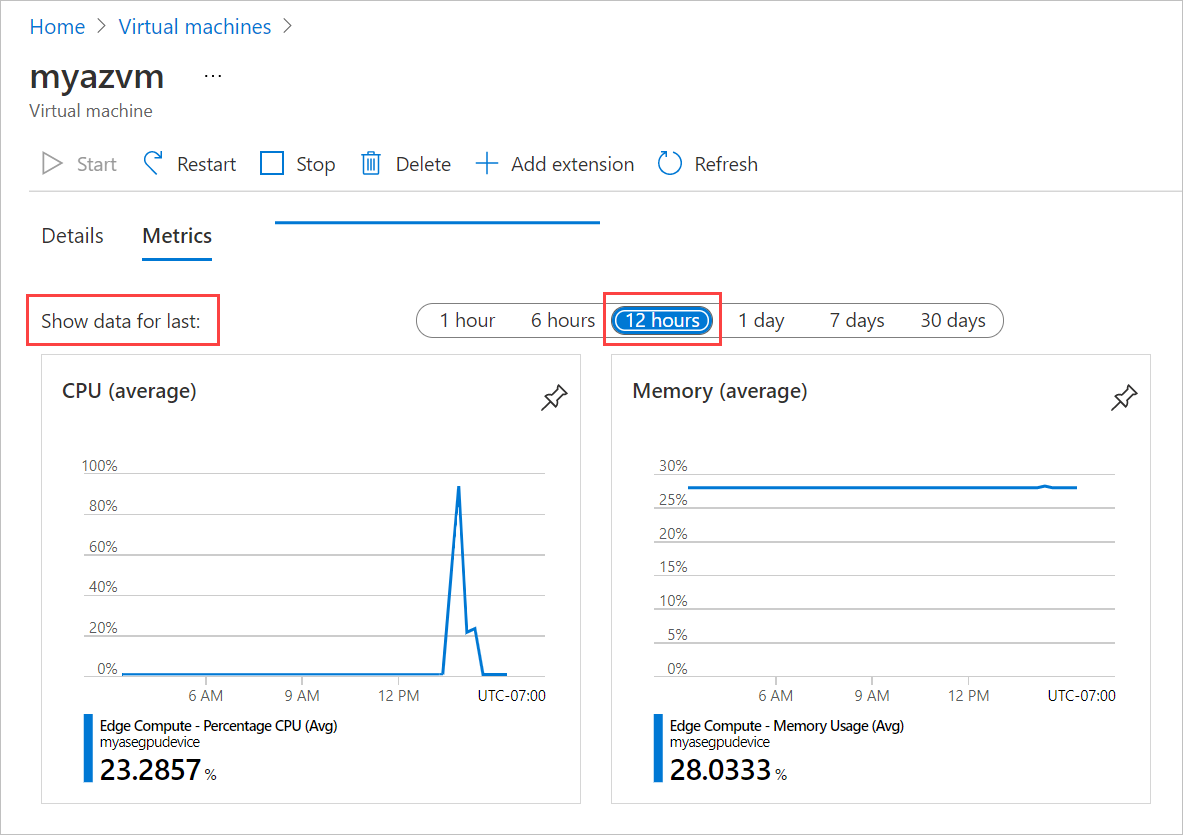
By default, the graphs show average CPU and memory usage for the previous hour. To see data for a different time period, select a different option beside Show data for last.
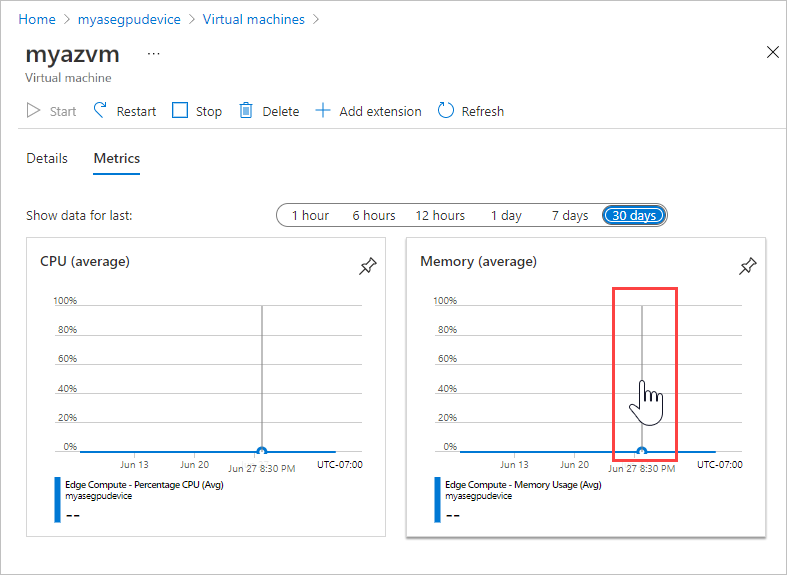
Point anywhere in either chart with your mouse to display a vertical line with a hand that you can move left or right to view an earlier or later data sample. Click to open a detail view for that time period.