Note
Access to this page requires authorization. You can try signing in or changing directories.
Access to this page requires authorization. You can try changing directories.
This page describes how to monitor usage for Unity Gateway services using the usage tracking system table.
The usage tracking table captures request and response details for model services, model provider services, and MCP services. For model requests, it records metrics such as token usage and latency. For MCP requests, it records call and service metadata. Use the table to monitor users, track costs, and analyze service usage and performance.
Usage tracking also captures ai_query requests to Databricks-provided model services.
Account and workspace admins can view a consolidated overview of AI usage on the AI page in Governance Hub.
Requirements
- A Azure Databricks workspace in a Unity Gateway supported region.
- Unity Catalog enabled for your workspace. See Enable a workspace for Unity Catalog.
Pricing
Usage tracking is a billed Unity Gateway feature. Azure Databricks charges for the usage that it logs to the system.ai_gateway.usage table. See Unity Gateway pricing.
Query the usage table
Unity Gateway logs usage data to the system.ai_gateway.usage system table. You can view the table in the UI, or query the table from Databricks SQL or a notebook.
Note
Both account and metastore admin roles are required to view or query the system.ai_gateway.usage table by default. Admins can manage access to system tables to control permissions for users, groups, and service principals.
To view the table in the UI, click the usage tracking table link on the model service page to open the table in Catalog Explorer.
To query the table from Databricks SQL or a notebook:
SELECT * FROM system.ai_gateway.usage;
Tip
Genie Code (Agent mode) can do this for you. Try this example prompt:
Query the system.ai_gateway.usage table to analyze AI Gateway usage showing request count and total tokens, grouped by endpoint name for the last 7 days.
Built-in usage dashboard
Note
Some workspaces do not yet show the Govern dropdown. In those workspaces, use the standalone Create Dashboard, View Dashboard, and Update buttons on the Unity Gateway page instead.
Create built-in usage dashboard
Account admins can create a built-in Unity Gateway usage dashboard to monitor usage, track costs, and gain insights into model service performance and consumption. From the Unity Gateway page, click Govern in the top right, then click Create Usage Dashboard. The warehouse that runs the dashboard queries is selected automatically.
Note
Dashboard creation is restricted to account admins because it requires SELECT permissions on the system.ai_gateway.usage table. The dashboard's data is subject to the usage table's retention policies. See Which system tables are available?.
When a newer version of the built-in usage dashboard is available, account admins can click Update on the dashboard version row in the Govern dropdown on the Unity Gateway page.
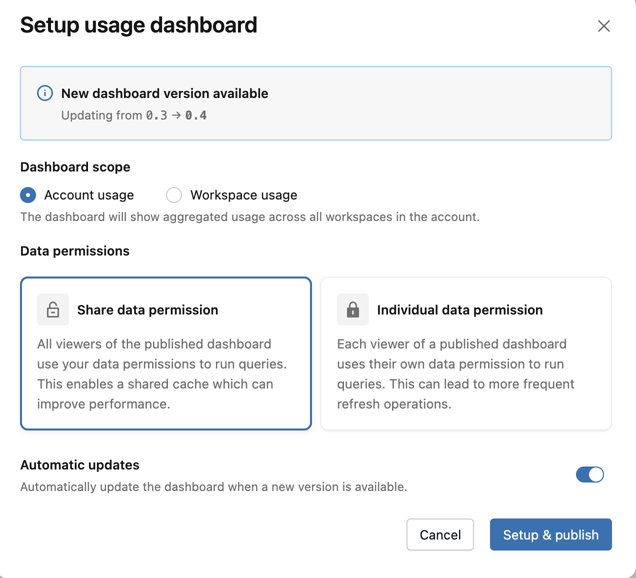
You can use the following dashboard configuration options to manage the dashboard:
- Scope: Select whether to scope the dashboard to the account or workspace.
- Permissions: Choose whether queries run using the dashboard owner’s permissions or each viewer’s permissions. See What are shared data permissions?.
- Automatic updates: When you enable this option, the dashboard updates automatically whenever a newer version becomes available and an account administrator visits the Unity Gateway page.
When the dashboard is updated to version 0.3 or higher, a schedule is automatically created to refresh the dashboard every 6 hours. If needed, this schedule can be disabled in the Lakeview dashboard. See Create a schedule.
View usage dashboard
To view the dashboard, click Govern in the top right of the Unity Gateway page, then click Usage Dashboard. The dashboard opens in a new tab. The built-in dashboard has comprehensive visibility into Unity Gateway model service usage, performance, and cost. It includes multiple pages tracking requests, token consumption, latency metrics, error rates, cost breakdowns, external MCP server traffic, and coding agent activity.
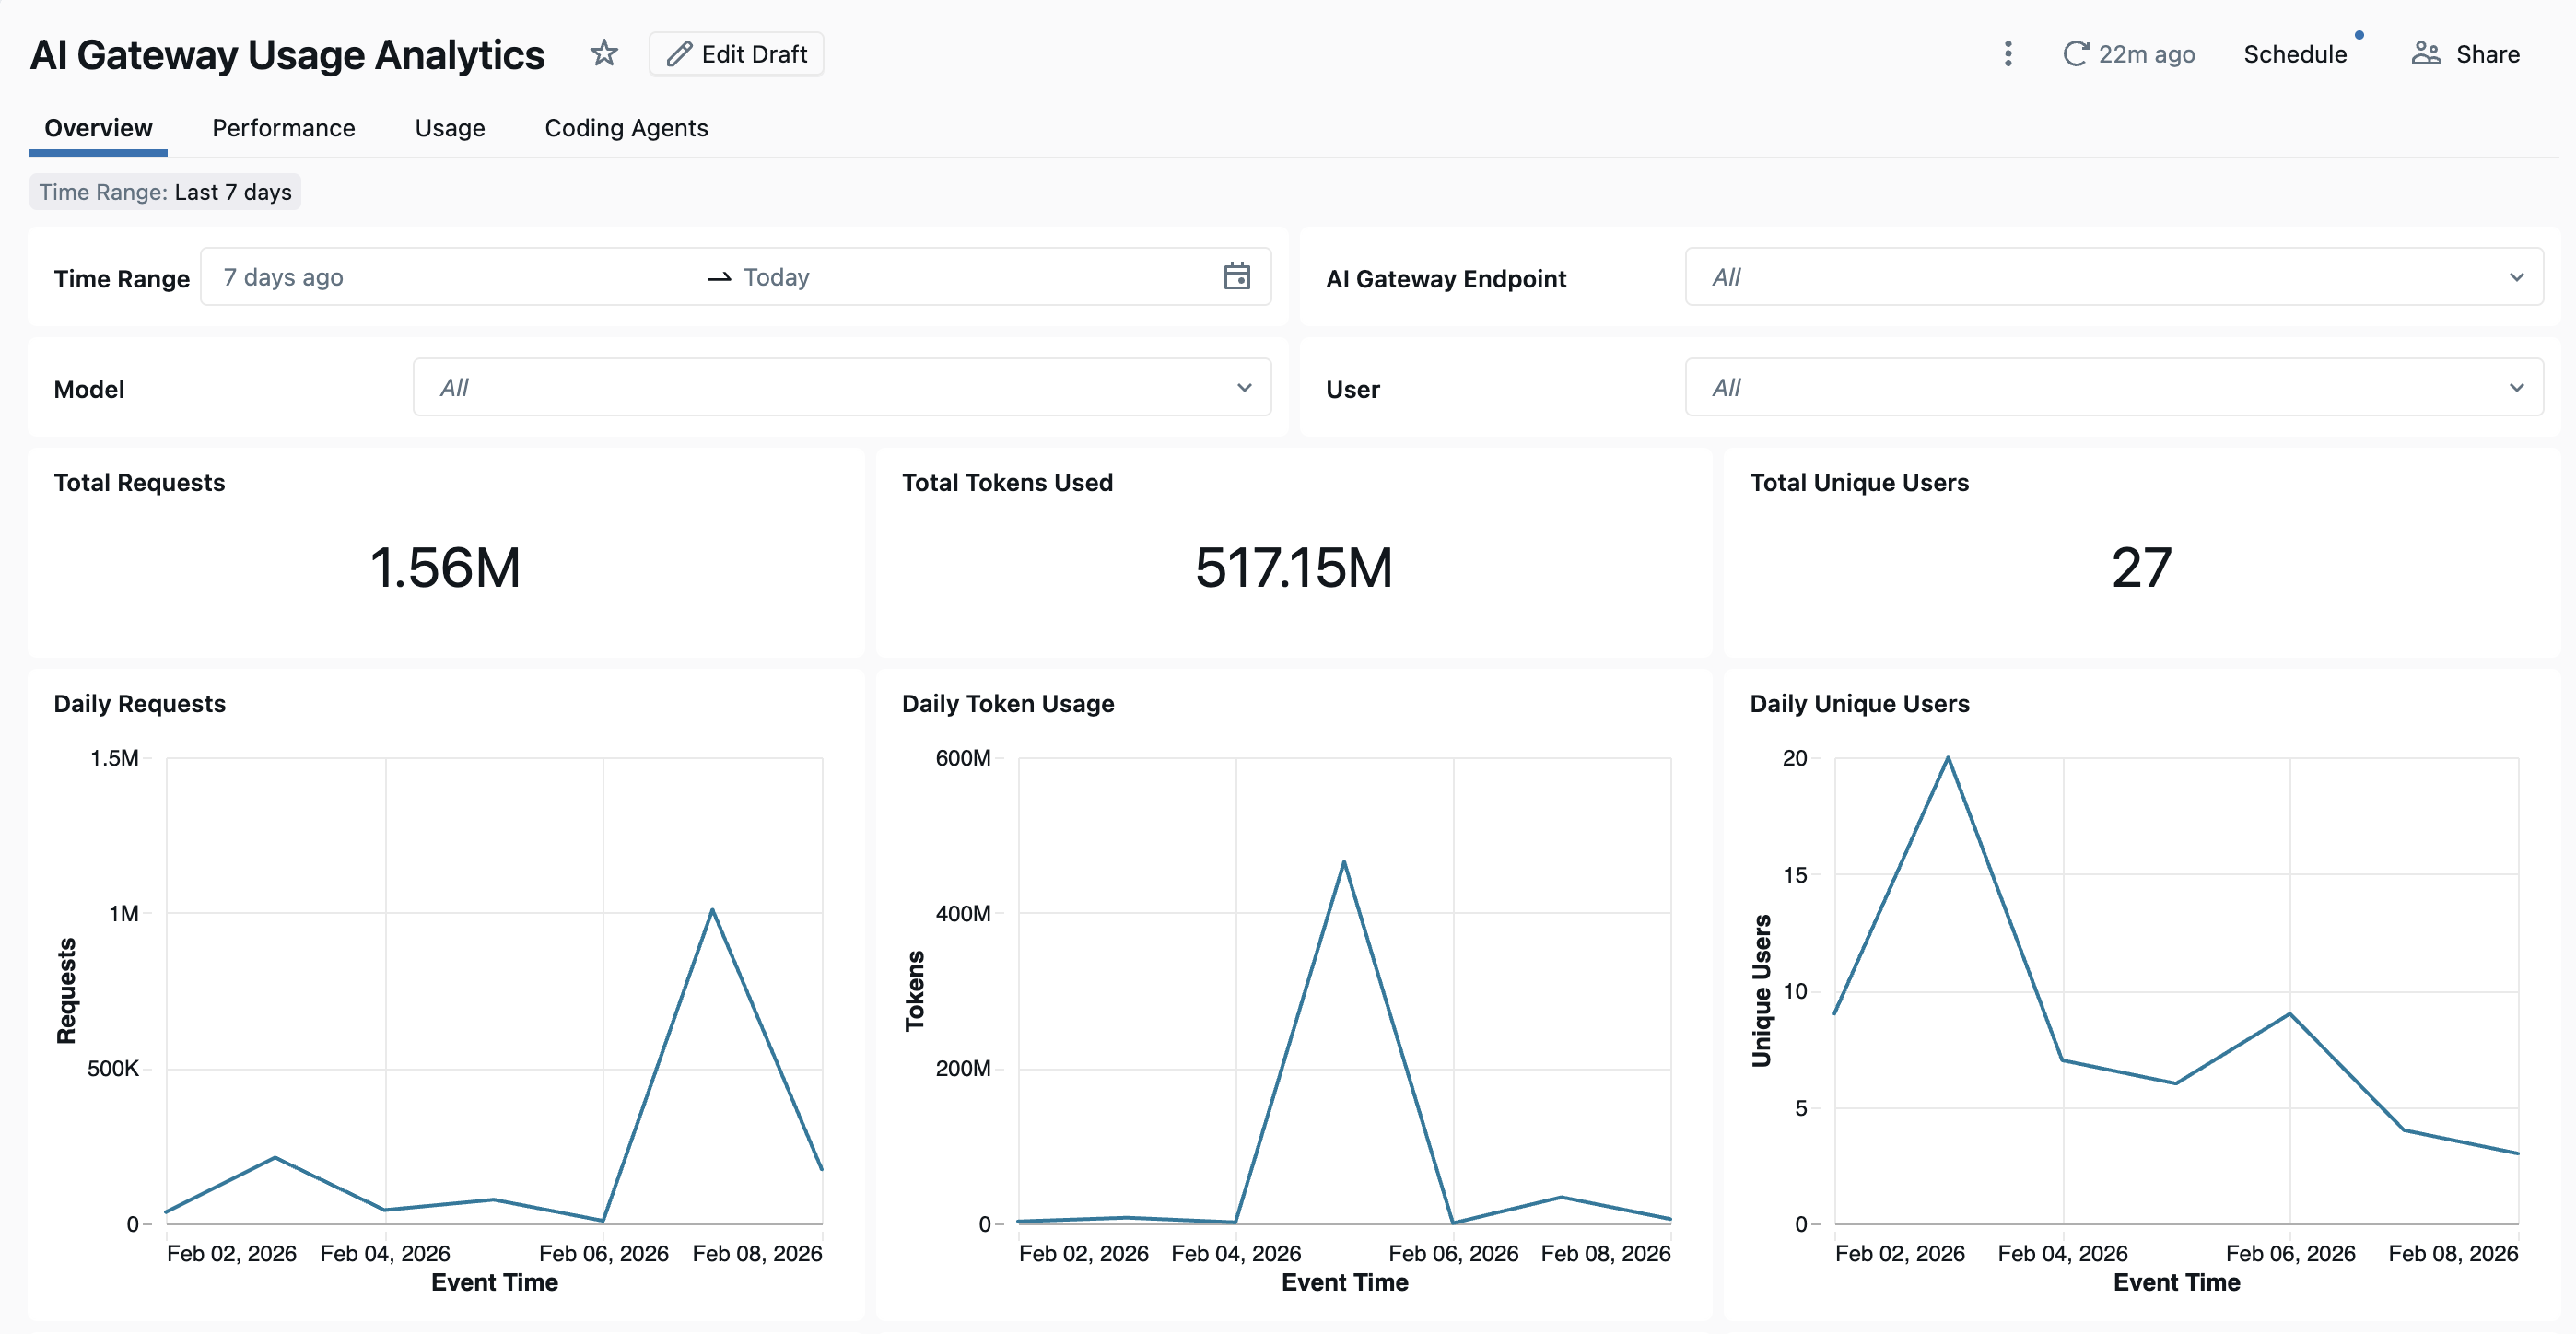
The dashboard provides cross-workspace analytics by default. All dashboard pages can be filtered by date range and workspace ID.
- Overview tab: Shows high-level usage metrics including daily request volume, token usage trends over time, top users by token consumption, and total unique user counts. Use this tab to get a quick snapshot of overall Unity Gateway activity and identify the most active users and models.
- Performance tab: Tracks key performance metrics including latency percentiles (P50, P90, P95, P99), time to first byte, error rates, and HTTP status code distributions. Use this tab to monitor model service health and identify performance bottlenecks or reliability issues.
- Usage tab: Shows detailed consumption breakdowns by model service, workspace, and requester. This tab shows token usage patterns, request distributions, and cache hit ratios.
- Cost Observability tab: Shows cost breakdowns by model service, target model, user, service tags, and request tags. This tab also includes estimated cost for external models. See Analyze Unity Gateway cost.
- External MCP Server tab: Shows request volume, error rates, users and connections, and daily usage trends for external MCP server traffic.
- Coding Agents tab: Tracks activity from integrated coding agents including Claude Code, Codex CLI, Cursor, and Gemini CLI. This tab shows metrics like active days, coding sessions, commits, and lines of code added or removed to monitor developer tool usage. See Coding agent dashboard for more details.
Usage table schema
The system.ai_gateway.usage table has the following schema:
| Column name | Type | Description | Example |
|---|---|---|---|
account_id |
STRING | The account ID. | 11d77e21-5e05-4196-af72-423257f74974 |
workspace_id |
STRING | The workspace ID. | 1653573648247579 |
request_id |
STRING | A unique identifier for the request. | b4a47a30-0e18-4ae3-9a7f-29bcb07e0f00 |
invocation_id |
STRING | A unique identifier for each individual inference call. Multiple invocations can share the same request_id, such as guardrail checks or multi-turn agent calls. Use invocation_id to distinguish them. |
c0a8012e-9f3b-4d21-8a7e-1b2c3d4e5f60 |
schema_version |
INTEGER | The schema version of the usage record. | 1 |
service_type |
STRING | The type of service that generated the usage record. Values are MODEL_SERVICE, MCP_SERVICE, and MODEL_PROVIDER_SERVICE. |
MODEL_SERVICE |
service_id |
STRING | The ID of the Model Service, MCP Service, or Model Provider Service. | 43addf89-d802-3ca2-bd54-fe4d2a60d58a |
service_name |
STRING | The Unity Catalog fully qualified name of the service. | main.default.github_tools |
service_tags |
MAP | Resource tags applied to the Unity Catalog securable at creation or update time. They apply to all requests to the service and are useful for categorizing usage by team, cost center, or project. | {"team": "engineering"} |
endpoint_id |
STRING | The unique ID of the Unity Gateway model service. | 43addf89-d802-3ca2-bd54-fe4d2a60d58a |
endpoint_name |
STRING | The name of the Unity Gateway model service. | system.ai.gpt-5-2 |
endpoint_tags |
MAP | Tags configured on the model service at creation or update time. They apply to all requests to the model service and are useful for categorizing services by team, cost center, or project. | {"team": "engineering"} |
endpoint_metadata |
STRUCT | Model service metadata including creator, creation_time, last_updated_time, destinations, inference_table, and fallbacks. |
{"creator": "user.name@email.com", "creation_time": "2026-01-06T12:00:00.000Z", ...} |
event_time |
TIMESTAMP | The timestamp when the request was received. | 2026-01-20T19:48:08.000+00:00 |
latency_ms |
LONG | The total latency in milliseconds. | 300 |
time_to_first_byte_ms |
LONG | The time to first byte in milliseconds. | 300 |
destination_type |
STRING | The type of destination (for example, external model or foundation model). | PAY_PER_TOKEN_FOUNDATION_MODEL |
destination_name |
STRING | The name of the destination model or provider. | system.ai.gpt-5-2 |
destination_id |
STRING | The unique ID of the destination. | 507e7456151b3cc89e05ff48161efb87 |
destination_model |
STRING | The specific model used for the request. | GPT-5.2 |
requester |
STRING | The ID of the user or service principal that made the request. | user.name@email.com |
requester_type |
STRING | The type of requester (user, service principal, or user group). | USER |
ip_address |
STRING | The IP address of the requester. | 1.2.3.4 |
url |
STRING | The URL of the request. | https://<workspace-url>/ai-gateway/mlflow/v1/chat/completions |
user_agent |
STRING | The user agent of the requester. | OpenAI/Python 2.13.0 |
api_type |
STRING | The type of API call (for example, chat, completions, or embeddings). | mlflow/v1/chat/completions |
request_tags |
MAP | User-provided tags sent with individual requests using the Databricks-Ai-Gateway-Request-Tags HTTP header. Use request tags to attribute usage to specific projects, teams, environments, or end users. See Tag requests for usage tracking and Request tagging. |
{"project": "chatbot", "team": "ml-platform"} |
invocation_metadata |
STRUCT | Information about where the request originated, the service tier reported by the model provider, and whether the request used a Claude subscription. | {"source": "EXTERNAL_CLIENT", "service_tier": "priority", "relayed": false} |
input_tokens |
LONG | The number of input tokens. | 100 |
output_tokens |
LONG | The number of output tokens. | 100 |
total_tokens |
LONG | The total number of tokens (input + output). | 200 |
token_details |
STRUCT | Detailed token and tool usage breakdown, including cache_read_input_tokens, cache_creation_input_tokens, output_reasoning_tokens, cache_creation_5m_input_tokens, cache_creation_1h_input_tokens, file_search_count, and num_web_search_queries. |
{"cache_read_input_tokens": 100, ...} |
response_content_type |
STRING | The content type of the response. | application/json |
status_code |
INT | The HTTP status code of the response. | 200 |
routing_information |
STRUCT | Routing details for fallback attempts. Contains an attempts array with priority, action, destination, destination_id, status_code, error_code, latency_ms, start_time, and end_time for each model tried during the request. |
{"attempts": [{"priority": "1", ...}]} |
mcp_metadata |
STRUCT | Details of a request to an MCP service, including the tool invoked, the server type, and the JSON-RPC operation. Populated for MCP_SERVICE rows. |
{"tool_name": "echo", "server_type": "EXTERNAL", "json_rpc_method": "tools/call"} |
session_metadata |
STRUCT | Session and client context, including session and subagent IDs, coding agent name and version, client interface, reasoning effort, and smart-routing recipe. Use these fields to group related requests and analyze usage by agent or session. | {"coding_agent": "claude-code", "agent_version": "2.1.282", "reasoning_effort": "high", ...} |
auth_mode |
STRING | The Databricks credential type used to authenticate the request: a personal access token (PAT) or an OAuth token (OAUTH). |
OAUTH |
Nested column schemas
The following tables describe fields within nested STRUCT columns. Field availability depends on the service, model, and client used for the request.
Invocation and token metadata
| Field path | Type | Description |
|---|---|---|
invocation_metadata.source |
STRING | The application, service, or API that initiated the request. Use this field to attribute usage to its source. Values include AI_PLAYGROUND, EXTERNAL_CLIENT, AI_QUERY, GUARDRAIL, and MANAGED_AGENT. |
invocation_metadata.service_tier |
STRING | The service tier reported by the model provider in the inference response, such as default or priority. Use this field to compare usage across provider pricing tiers. |
invocation_metadata.relayed |
BOOLEAN | Whether the request was relayed to Anthropic using the caller's Claude subscription. |
token_details.cache_read_input_tokens |
LONG | The number of tokens read from the prompt cache. |
token_details.cache_creation_input_tokens |
LONG | The number of tokens written to the prompt cache. |
token_details.output_reasoning_tokens |
LONG | The number of reasoning tokens in the output. |
token_details.cache_creation_5m_input_tokens |
LONG | The number of input tokens written to the prompt cache with a 5-minute lifetime. |
token_details.cache_creation_1h_input_tokens |
LONG | The number of input tokens written to the prompt cache with a 1-hour lifetime. |
token_details.file_search_count |
LONG | The number of file search tool calls made as part of the request. |
token_details.num_web_search_queries |
LONG | The number of billable web search queries made as part of the request. |
MCP service metadata
These fields are populated in mcp_metadata for MCP_SERVICE rows.
| Field path | Type | Description |
|---|---|---|
mcp_metadata.tool_name |
STRING | The name of the tool invoked by an MCP tools/call request. Use this field to analyze usage of individual tools on a server. |
mcp_metadata.server_type |
STRING | The category of MCP server handling the request, such as EXTERNAL or SYSTEM. |
mcp_metadata.json_rpc_method |
STRING | The JSON-RPC operation requested by the client, such as tools/call to invoke a tool, tools/list to discover tools, or initialize to start a session. |
Session metadata
The session_metadata fields help correlate requests within a session and distinguish coding agents, client interfaces, and request settings. Each field is populated when the corresponding information is available from the client or request.
| Field path | Type | Description |
|---|---|---|
session_metadata.client_session_id |
STRING | The session ID provided by the client. Use it to group requests made during the same conversation or coding-agent session. |
session_metadata.client_subagent_id |
STRING | The subagent ID provided by the client. Use it with client_session_id to distinguish requests from subagents within a parent session. |
session_metadata.coding_agent |
STRING | The normalized name of the coding agent that sent the request, such as claude-code or codex. |
session_metadata.agent_version |
STRING | The coding agent's reported version. Use it with coding_agent to compare usage across agent releases. |
session_metadata.surface |
STRING | The client interface from which the coding agent sent the request, such as a command-line interface, IDE, or desktop application. |
session_metadata.reasoning_effort |
STRING | The reasoning effort specified in the request, such as low, medium, or high. Available values depend on the model and API. |
session_metadata.smart_router_name |
STRING | The name of the smart-routing recipe selected by the client. Use it to group usage by routing recipe. |
Tag requests for usage tracking
Request tags are custom key-value pairs that the caller attaches to individual requests. Use request tags to attribute usage by project, team, environment, end user, or any other dimension relevant to your organization. Request tags are logged to the system.ai_gateway.usage table and can be used to filter, aggregate, and analyze usage data.
To tag individual requests, include the Databricks-Ai-Gateway-Request-Tags HTTP header with a JSON object mapping string keys to string values. Request tags are logged to the request_tags column in the usage table and in inference tables.
For examples showing how to set request tags with REST API, OpenAI SDK, and Anthropic SDK, see Request tagging.
For example, you can aggregate usage by project using request tags:
SELECT
  request_tags['project'] AS project,
  COUNT(*) AS request_count,
  SUM(total_tokens) AS total_tokens
FROM system.ai_gateway.usage
WHERE request_tags['project'] IS NOT NULL
GROUP BY request_tags['project']
ORDER BY total_tokens DESC;
Limitations
- Unity Gateway doesn't track token usage for non-streaming, non-embedding responses larger than 1 MiB.