Note
Access to this page requires authorization. You can try signing in or changing directories.
Access to this page requires authorization. You can try changing directories.
In this tutorial, you learn how to:
- view Azure DDoS Protection diagnostic logs including notifications, mitigation reports and mitigation flow logs.
DDoS Protection diagnostic logs provide you with the ability to view DDoS Protection notifications, mitigation reports and mitigation flow logs after a DDoS attack. You can view these logs in your Log Analytics workspace.
Attack mitigation reports use the Netflow protocol data, which is aggregated to provide detailed information about the attack on your resource. Anytime a public IP resource is under attack, the report generation starts as soon as the mitigation starts. There will be an incremental report generated every 5 mins and a post-mitigation report for the whole mitigation period. This is to ensure that in an event the DDoS attack continues for a longer duration of time, you'll be able to view the most current snapshot of mitigation report every 5 minutes and a complete summary once the attack mitigation is over.
Prerequisites
- An Azure account with an active subscription. Create an account for free.
- DDoS Network Protection must be enabled on a virtual network or DDoS IP Protection must be enabled on a public IP address.
- Configure DDoS Protection diagnostic logs. To learn more, see Configure diagnostic logs.
- Simulate an attack using one of our simulation partners. To learn more, see Test with simulation partners.
View in Log Analytics workspace
Sign in to the Azure portal.
In the search box at the top of the portal, enter Log Analytics workspace. Select Log Analytics workspace in the search results.
Under the Log Analytics workspaces blade, select your workspace.
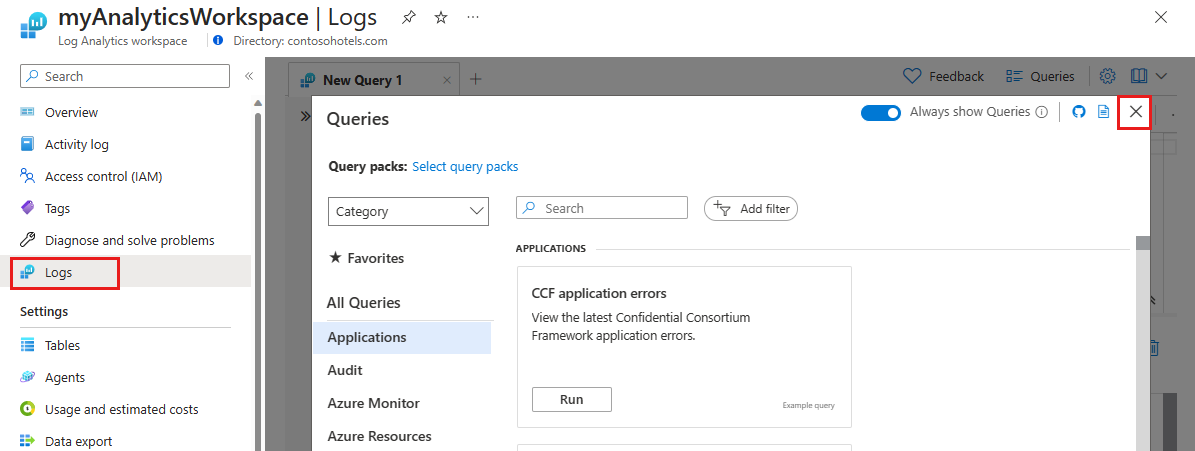
On the left-side tab, select Logs. Here you see the query explorer. Exit out the Queries pane to utilize the Logs page.
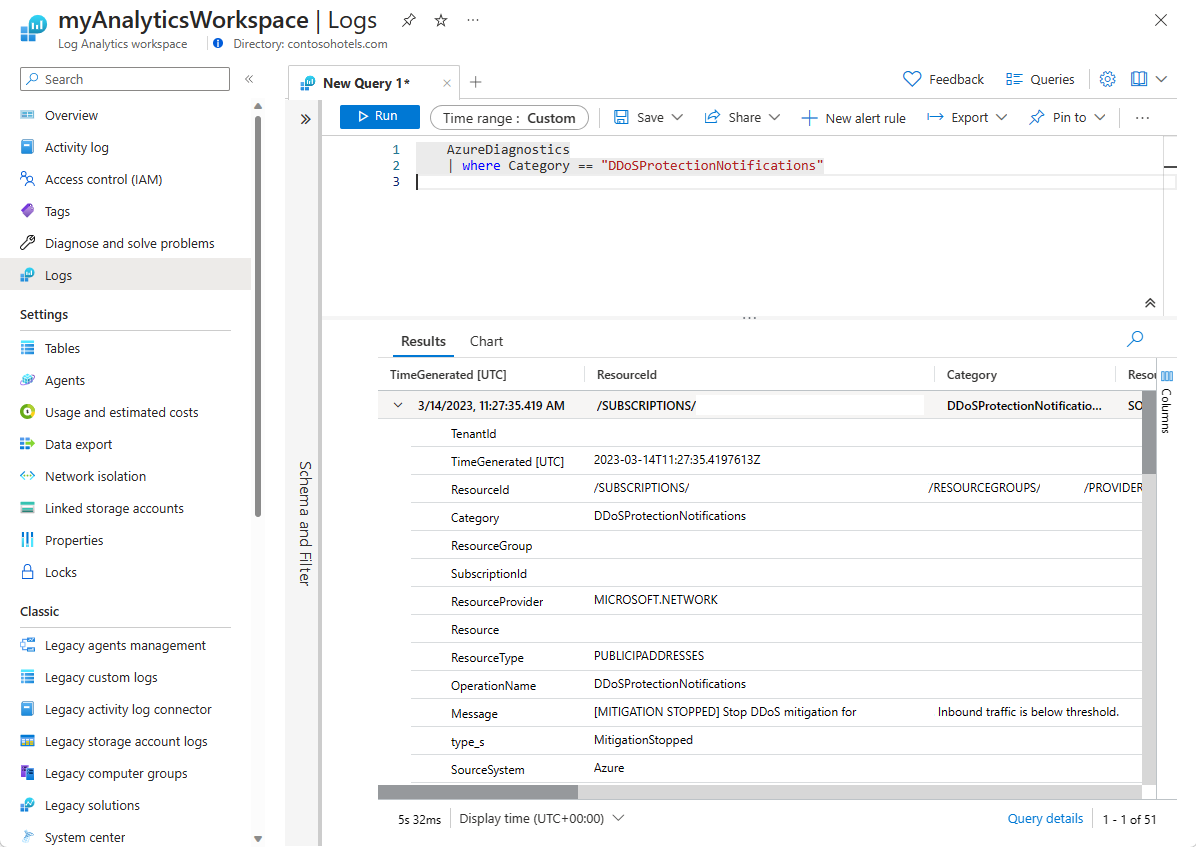
In the Logs page, type in your query then hit Run to view results.
Query Azure DDoS Protection logs in log analytics workspace
For more information on log schemas, see View diagnostic logs.
DDoSProtectionNotifications logs
Under the Log analytics workspaces blade, select your log analytics workspace.
On the left side pane, select Logs. Here you see the query explorer.
In Query explorer, type in the following Kusto Query and change the time range to Custom and change the time range to last three months. Then hit Run.
AzureDiagnostics
| where Category == "DDoSProtectionNotifications"
To view DDoSMitigationFlowLogs change the query to the following and keep the same time range and hit Run.
AzureDiagnostics
| where Category == "DDoSMitigationFlowLogs"
To view DDoSMitigationReports change the query to the following and keep the same time range and hit Run.
AzureDiagnostics
| where Category == "DDoSMitigationReports"
Example log queries
DDoS Protection Notifications
Notifications will notify you anytime a public IP resource is under attack, and when attack mitigation is over.
AzureDiagnostics
| where Category == "DDoSProtectionNotifications"
The following table lists the field names and descriptions:
| Field name | Description |
|---|---|
| TimeGenerated | The date and time in UTC when the notification was created. |
| ResourceId | The resource ID of your public IP address. |
| Category | For notifications, this will be DDoSProtectionNotifications. |
| ResourceGroup | The resource group that contains your public IP address and virtual network. |
| SubscriptionId | Your DDoS protection plan subscription ID. |
| Resource | The name of your public IP address. |
| ResourceType | This will always be PUBLICIPADDRESS. |
| OperationName | For notifications, this is DDoSProtectionNotifications. |
| Message | Details of the attack. |
| Type | Type of notification. Possible values include MitigationStarted. MitigationStopped. |
| PublicIpAddress | Your public IP address. |
DDoS Mitigation FlowLogs
Attack mitigation flow logs allow you to review the dropped traffic, forwarded traffic, and other interesting data-points during an active DDoS attack in near-real time. You can ingest the constant stream of this data into Microsoft Sentinel or to your third-party SIEM systems via event hub for near-real time monitoring, take potential actions and address the need of your defense operations.
AzureDiagnostics
| where Category == "DDoSMitigationFlowLogs"
The following table lists the field names and descriptions:
| Field name | Description |
|---|---|
| TimeGenerated | The date and time in UTC when the flow log was created. |
| ResourceId | The resource ID of your public IP address. |
| Category | For flow logs, this is DDoSMitigationFlowLogs. |
| ResourceGroup | The resource group that contains your public IP address and virtual network. |
| SubscriptionId | Your DDoS protection plan subscription ID. |
| Resource | The name of your public IP address. |
| ResourceType | This will always be PUBLICIPADDRESS. |
| OperationName | For flow logs, this is DDoSMitigationFlowLogs. |
| Message | Details of the attack. |
| SourcePublicIpAddress | The public IP address of the client generating traffic to your public IP address. |
| SourcePort | Port number ranging from 0 to 65535. |
| DestPublicIpAddress | Your public IP address. |
| DestPort | Port number ranging from 0 to 65535. |
| Protocol | Type of protocol. Possible values include tcp, udp, other. |
DDoS Mitigation Reports
AzureDiagnostics
| where Category == "DDoSMitigationReports"
The following table lists the field names and descriptions:
| Field name | Description |
|---|---|
| TimeGenerated | The date and time in UTC when the notification was created. |
| ResourceId | The resource ID of your public IP address. |
| Category | For mitigation reports, this is DDoSMitigationReports. |
| ResourceGroup | The resource group that contains your public IP address and virtual network. |
| SubscriptionId | Your DDoS protection plan subscription ID. |
| Resource | The name of your public IP address. |
| ResourceType | This will always be PUBLICIPADDRESS. |
| OperationName | For mitigation reports, this is DDoSMitigationReports. |
| ReportType | Possible values are Incremental and PostMitigation. |
| MitigationPeriodStart | The date and time in UTC when the mitigation started. |
| MitigationPeriodEnd | The date and time in UTC when the mitigation ended. |
| IPAddress | Your public IP Address. |
| AttackVectors | Degradation of attack types. The keys include TCP SYN flood, TCP flood, UDP flood, UDP reflection, and Other packet flood. |
| TrafficOverview | Degradation of attack traffic. The keys include Total packets, Total packets dropped, Total TCP packets, Total TCP packets dropped, Total UDP packets, Total UDP packets dropped, Total Other packets, and Total Other packets dropped. |
| Protocols | Breakdown of protocols included. The keys include TCP, UDP, and Other. |
| DropReasons | Analysis of causes of dropped packets. The keys include Protocol violation invalid TCP. syn Protocol violation invalid TCP, Protocol violation invalid UDP, UDP reflection, TCP rate limit exceeded, UDP rate limit exceeded, Destination limit exceeded, Other packet flood Rate limit exceeded, and Packet was forwarded to service. Protocol violation invalid drop reasons refer to malformed packets. |
| TopSourceCountries | Breakdown of the top 10 source countries/regions into inbound traffic. |
| TopSourceCountriesForDroppedPackets | Analysis of the top 10 source countries/regions for attack traffic that have been throttled. |
| TopSourceASNs | Analysis of the top 10 sources of autonomous system numbers (ASNs) of incoming traffic. |
| SourceContinents | Analysis of the source continent for inbound traffic. |
| Type | Type of notification. Possible values include MitigationStarted. MitigationStopped. |
Next steps
In this tutorial, you learned how to view DDoS Protection diagnostic logs in a Log Analytics workspace. To learn more about the recommended steps to take when you receive a DDoS attack, see these next steps.