Investigate devices on a device map
OT device maps provide a graphic representation of the network devices detected by the OT network sensor and the connections between them.
Use a device map to retrieve, analyze, and manage device information, either all at once or by network segment, such as specific interest groups or Purdue layers. If you're working in an air-gapped environment with an on-premises management console, use a zone map to view devices across all connected OT sensors in a specific zone.
Prerequisites
To perform the procedures in this article, make sure that you have:
An OT network sensor installed, configured, and activated, with network traffic ingested
Access to your OT sensor or on-premises management console. Users with the Viewer role can view data on the map. To import or export data or edit the map view, you need access as a Security Analyst or Admin user. For more information, see On-premises users and roles for OT monitoring with Defender for IoT.
To view devices across multiple sensors in a zone, you'll also need an on-premises management console installed, activated, and configured, with multiple sensors connected and assigned to sites and zones.
View devices on OT sensor device map
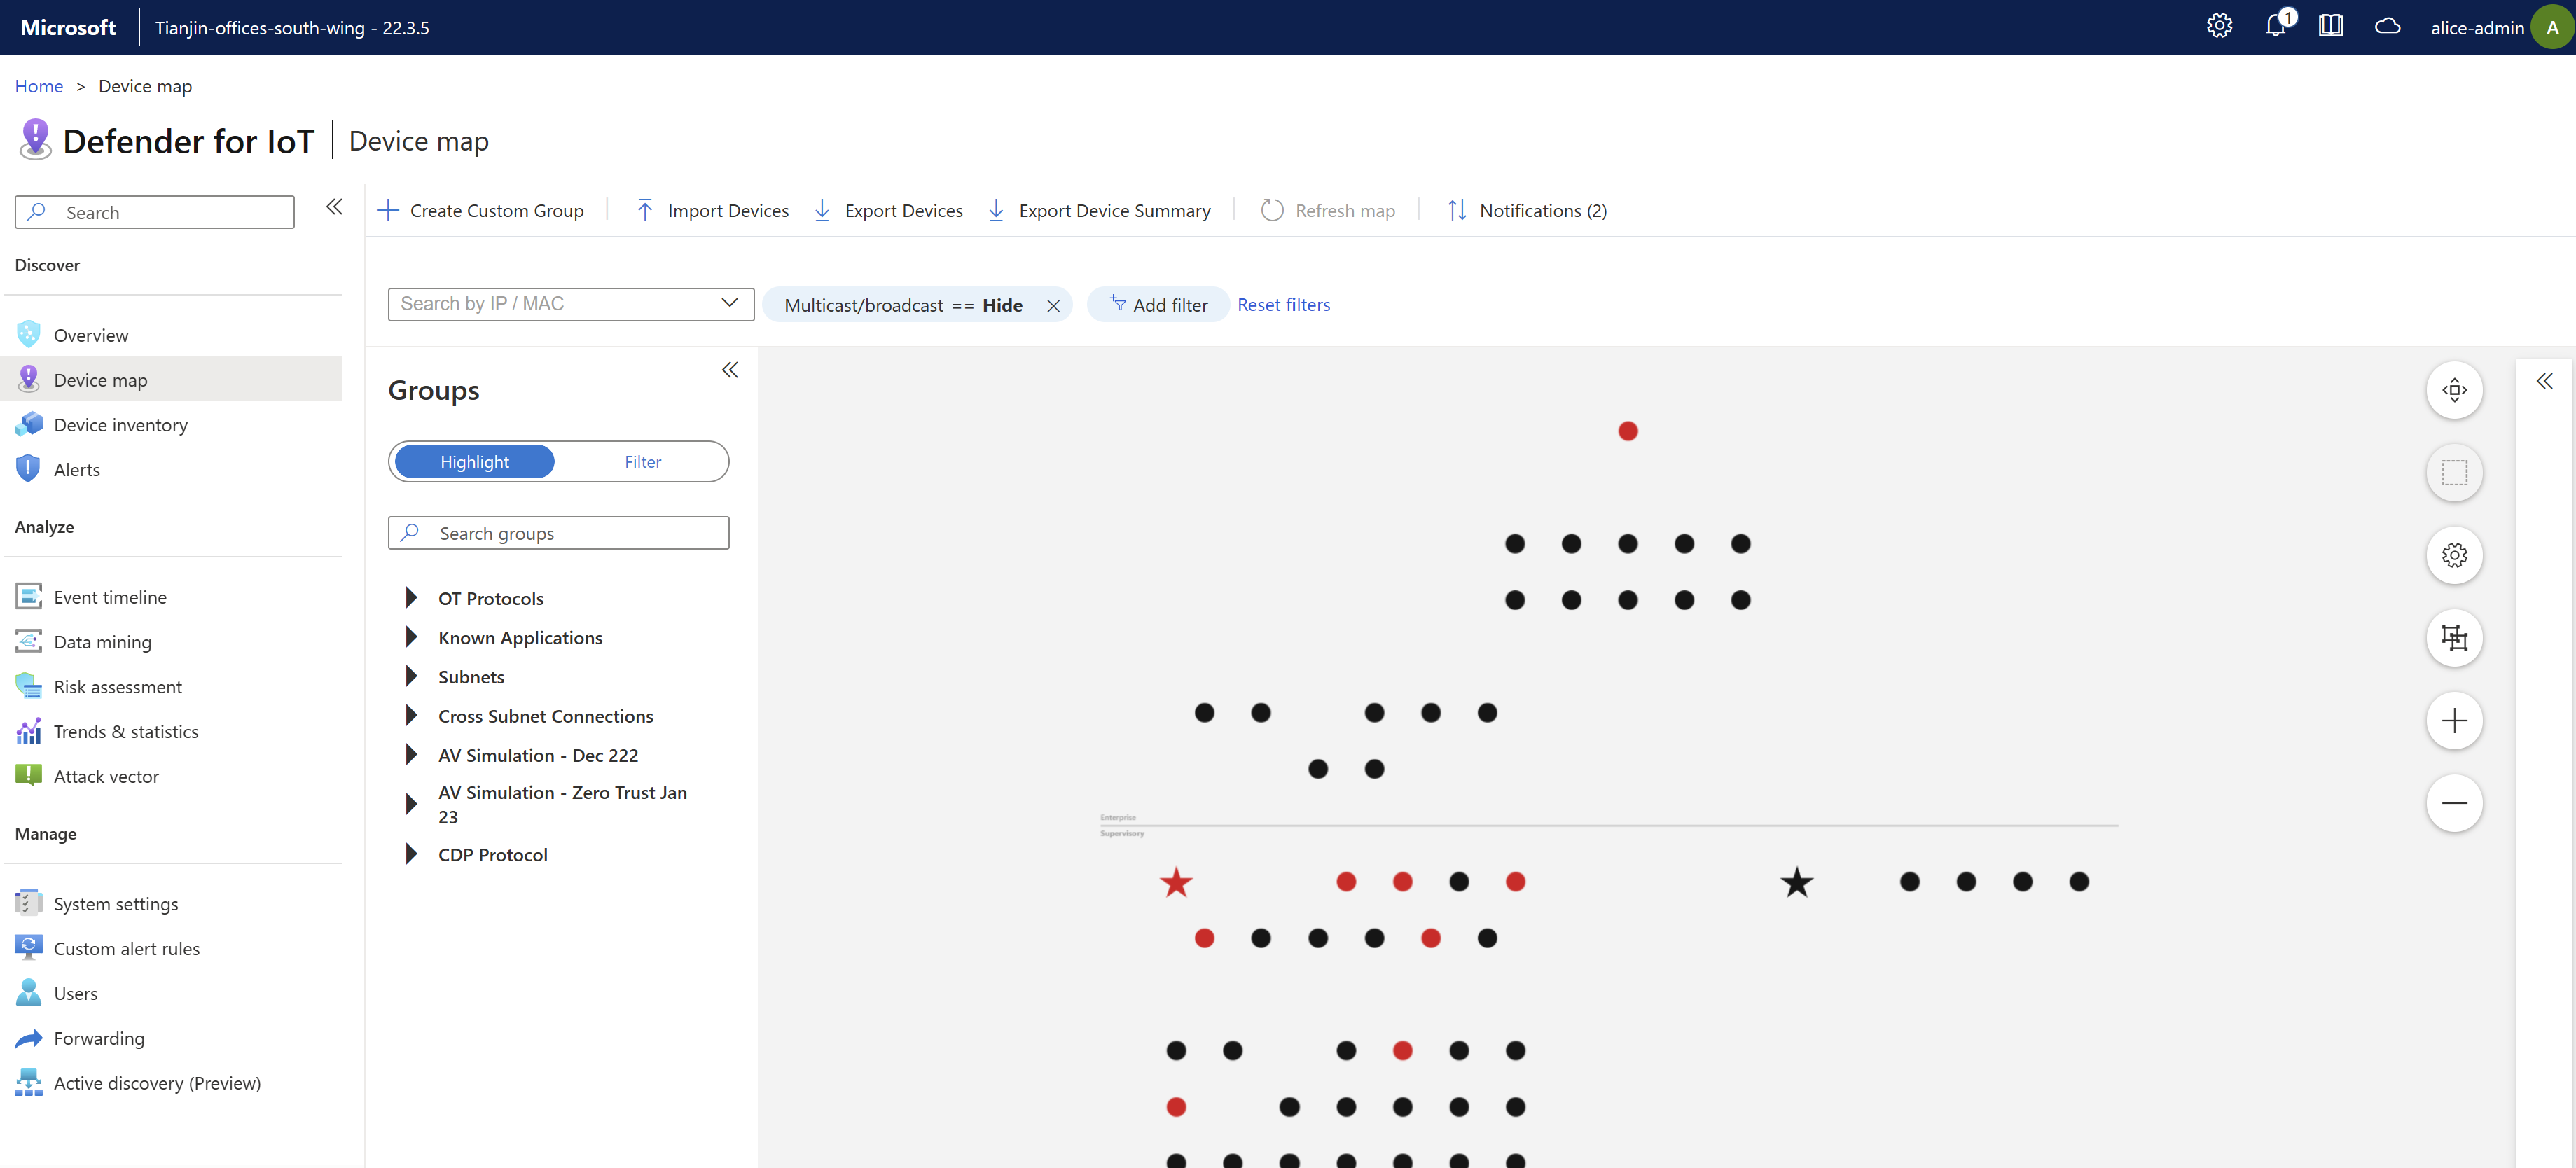
Sign into your OT sensor and select Device map. All devices detected by the OT sensor are displayed by default according to Purdue layer.
On the OT sensor's device map:
- Devices with currently active alerts are highlighted in red
- Starred devices are those that had been marked as important
- Devices with no alerts are shown in black, or grey in the zoomed-in connections view
For example:
Zoom in and select a specific device to view the connections between it and other devices, highlighted in blue.
When zoomed in, each device shows the following details:
- The device's host name, IP address, and subnet address, if relevant.
- The number of currently active alerts on the device.
- The device type, represented by a various icons.
- The number of devices grouped in a subnet in an IT network, if relevant. This number of devices is shown in a black circle.
- Whether the device is newly detected or unauthorized.
Right-click a specific device and select View properties to drill down further to the Map View tab on the device's device details page.

Modify the OT sensor map display
Use any of the following map tools to modify the data shown and how it's displayed:
| Name | Description |
|---|---|
| Refresh map | Select to refresh the map with updated data. |
| Notifications | Select to view device notifications. |
| Search by IP / MAC | Filter the map to display only devices connected to a specific IP or MAC address. |
| Multicast/broadcast | Select to edit the filter that shows or hides multicast and broadcast devices. By default, multicast and broadcast traffic is hidden. |
| Add filter (Last seen) | Select to filter devices displayed by those shown in a specific time period, from the last five minutes to the last seven days. |
| Reset filters | Select to reset the Last seen filter. |
| Highlight | Select to highlight the devices in a specific device group. Highlighted devices are shown on the map in blue. Use the Search groups box to search for device groups to highlight, or expand your group options, and then select the group you want to highlight. |
| Filter | Select to filter the map to show only the devices in a specific device group. Use the Search groups box to search for device groups, or expand your group options, and then select the group you want to filter by. |
| Zoom |
Zoom in on the map to view the connections between each device, either using the mouse or the +/- buttons on the right of the map. |
| Fit to screen |
Zooms out to fit all devices on the screen |
| Fit to selection |
Zooms out enough to fit all selected devices on the screen |
| IT/OT Presentation Options |
Select Disable Display IT Networks Groups to prevent the ability to collapse subnets in the map. This option is selected on by default. |
| Layout options |
Select one of the following: - Pin layout. Select to save device locations if you've dragged them to new places on the map. - Layout by connection. Select to view devices organized by their connections. - Layout by Purdue. Select to view devices organized by their Purdue layers. |
To see device details, select a device and expand the device details pane on the right. In a device details pane:
- Select Activity Report to jump to the device's data mining report
- Select Event Timeline to jump to the device's event timeline
- Select Device Details to jump to a full device details page.
View IT subnets from an OT sensor device map
By default, IT devices are automatically aggregated by subnet, so that the map focuses on your local OT and IoT networks.
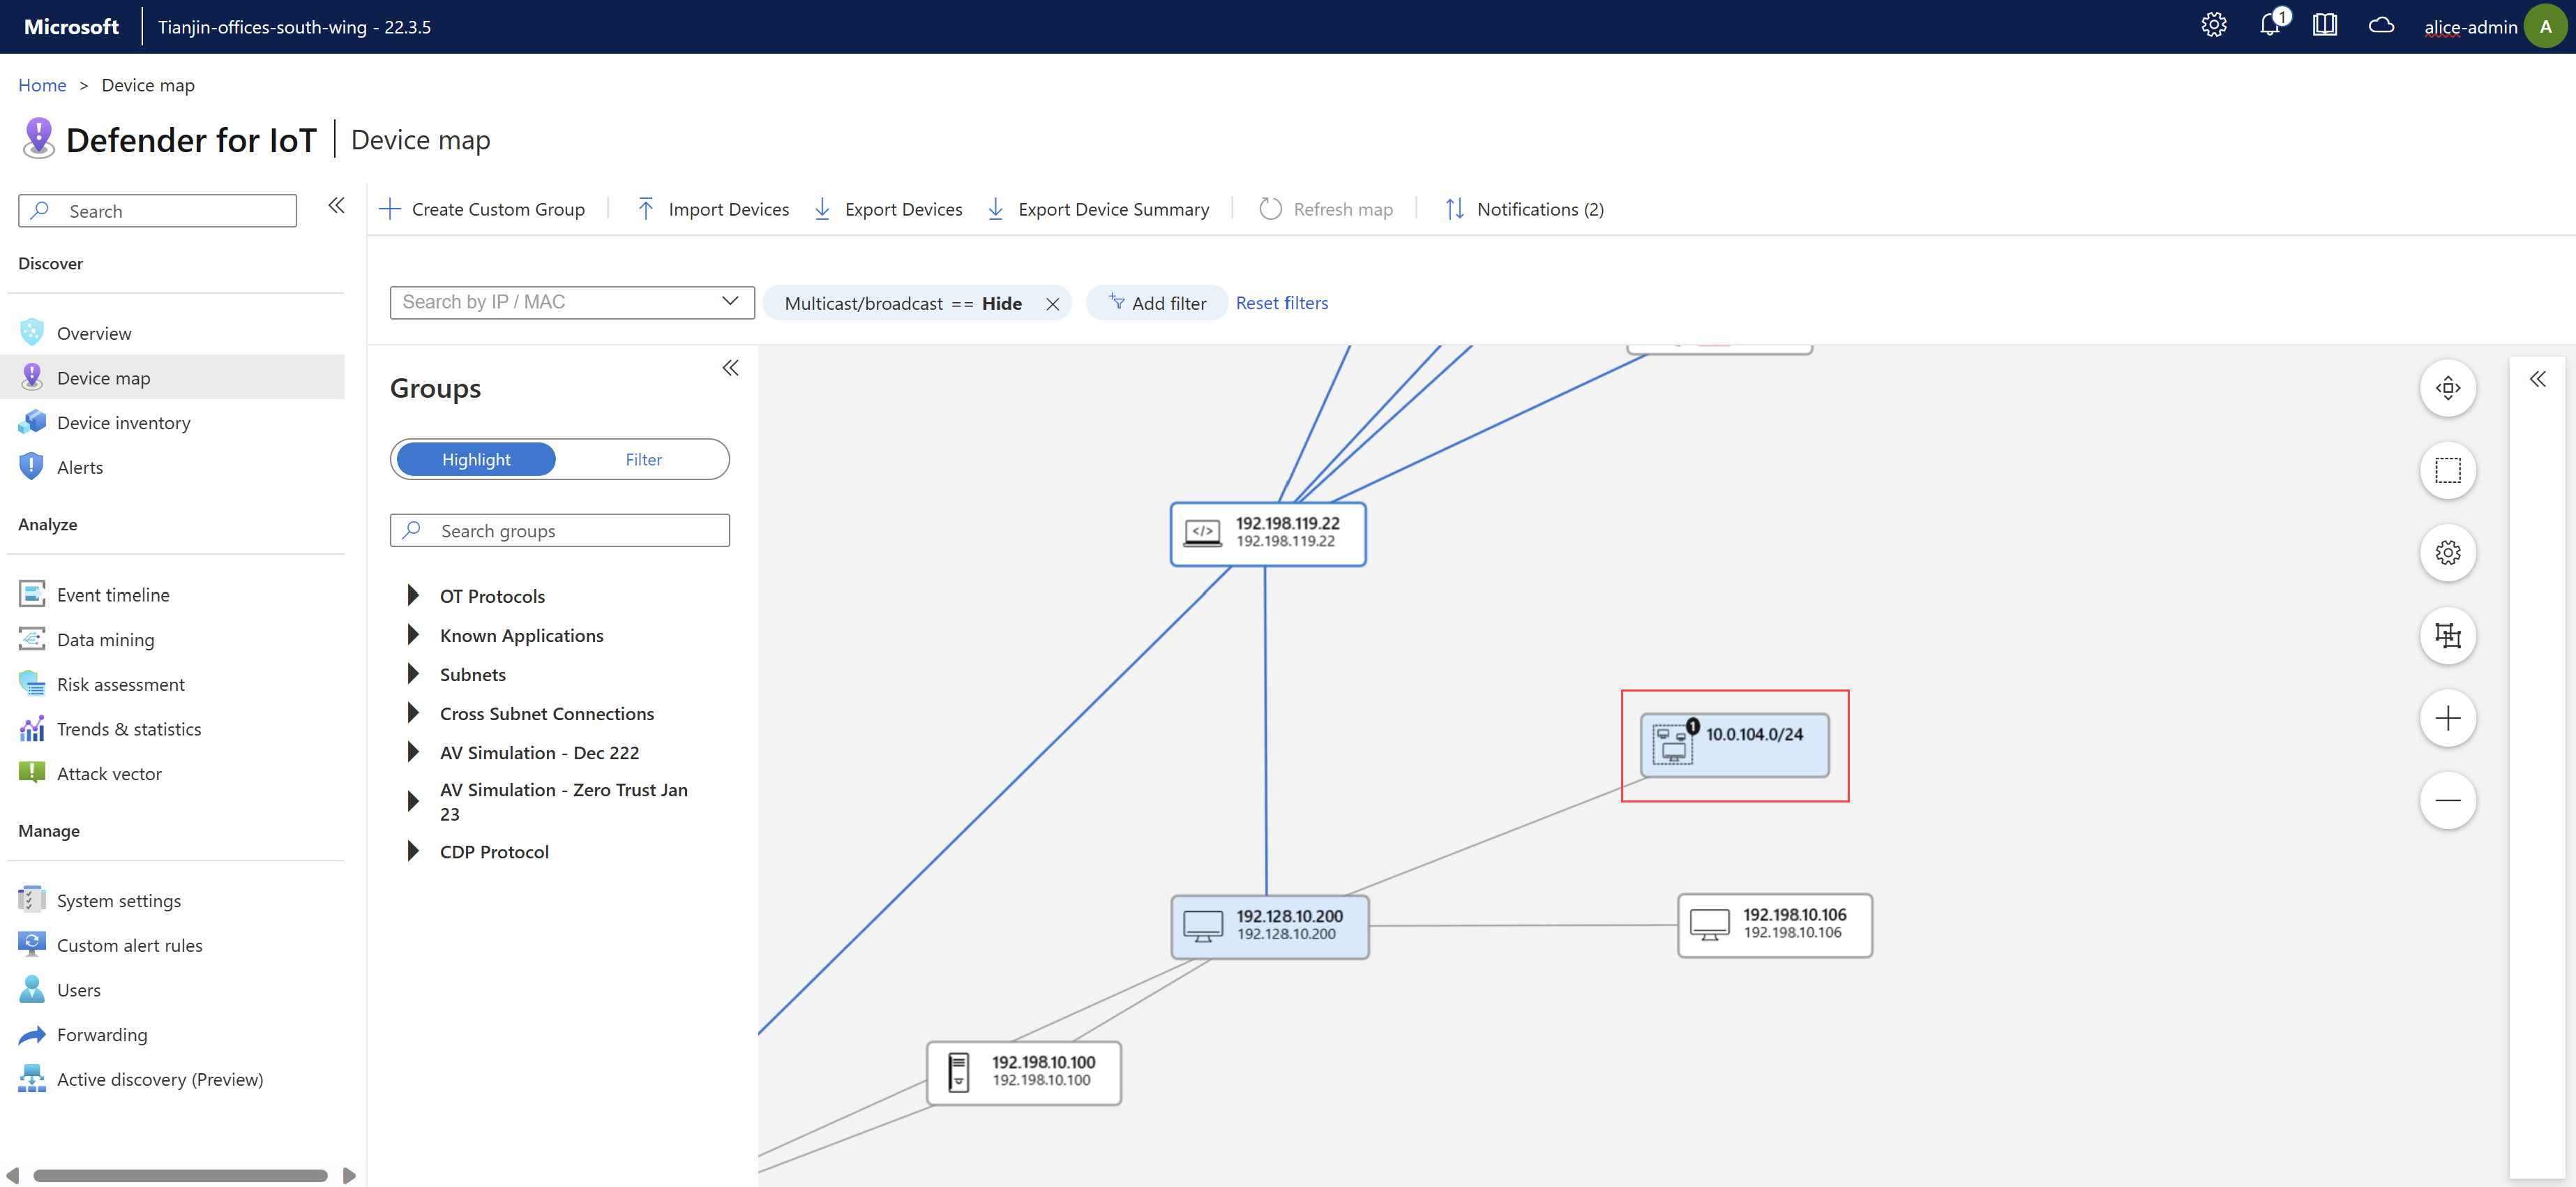
To expand an IT subnet:
Sign into your OT sensor and select Device map.
Locate your subnet on the map. You might need to zoom in on the map to view a subnet icon, which looks like several machines inside a box. For example:
Right-click the subnet device on the map and Expand Network.
In the confirmation message that appears above the map, select OK.
To collapse an IT subnet:
- Sign into your OT sensor and select Device map.
- Select one or more expanded subnets and then select Collapse All.
View traffic details between connected devices
To view traffic details between connected devices:
Sign into your OT sensor and select Device map.
Locate two connected devices on the map. You might need to zoom in on the map to view a device icon, which looks like a monitor.
Click on the line connecting two devices on the map and then
 expand the Connection Properties pane on the right. For example:
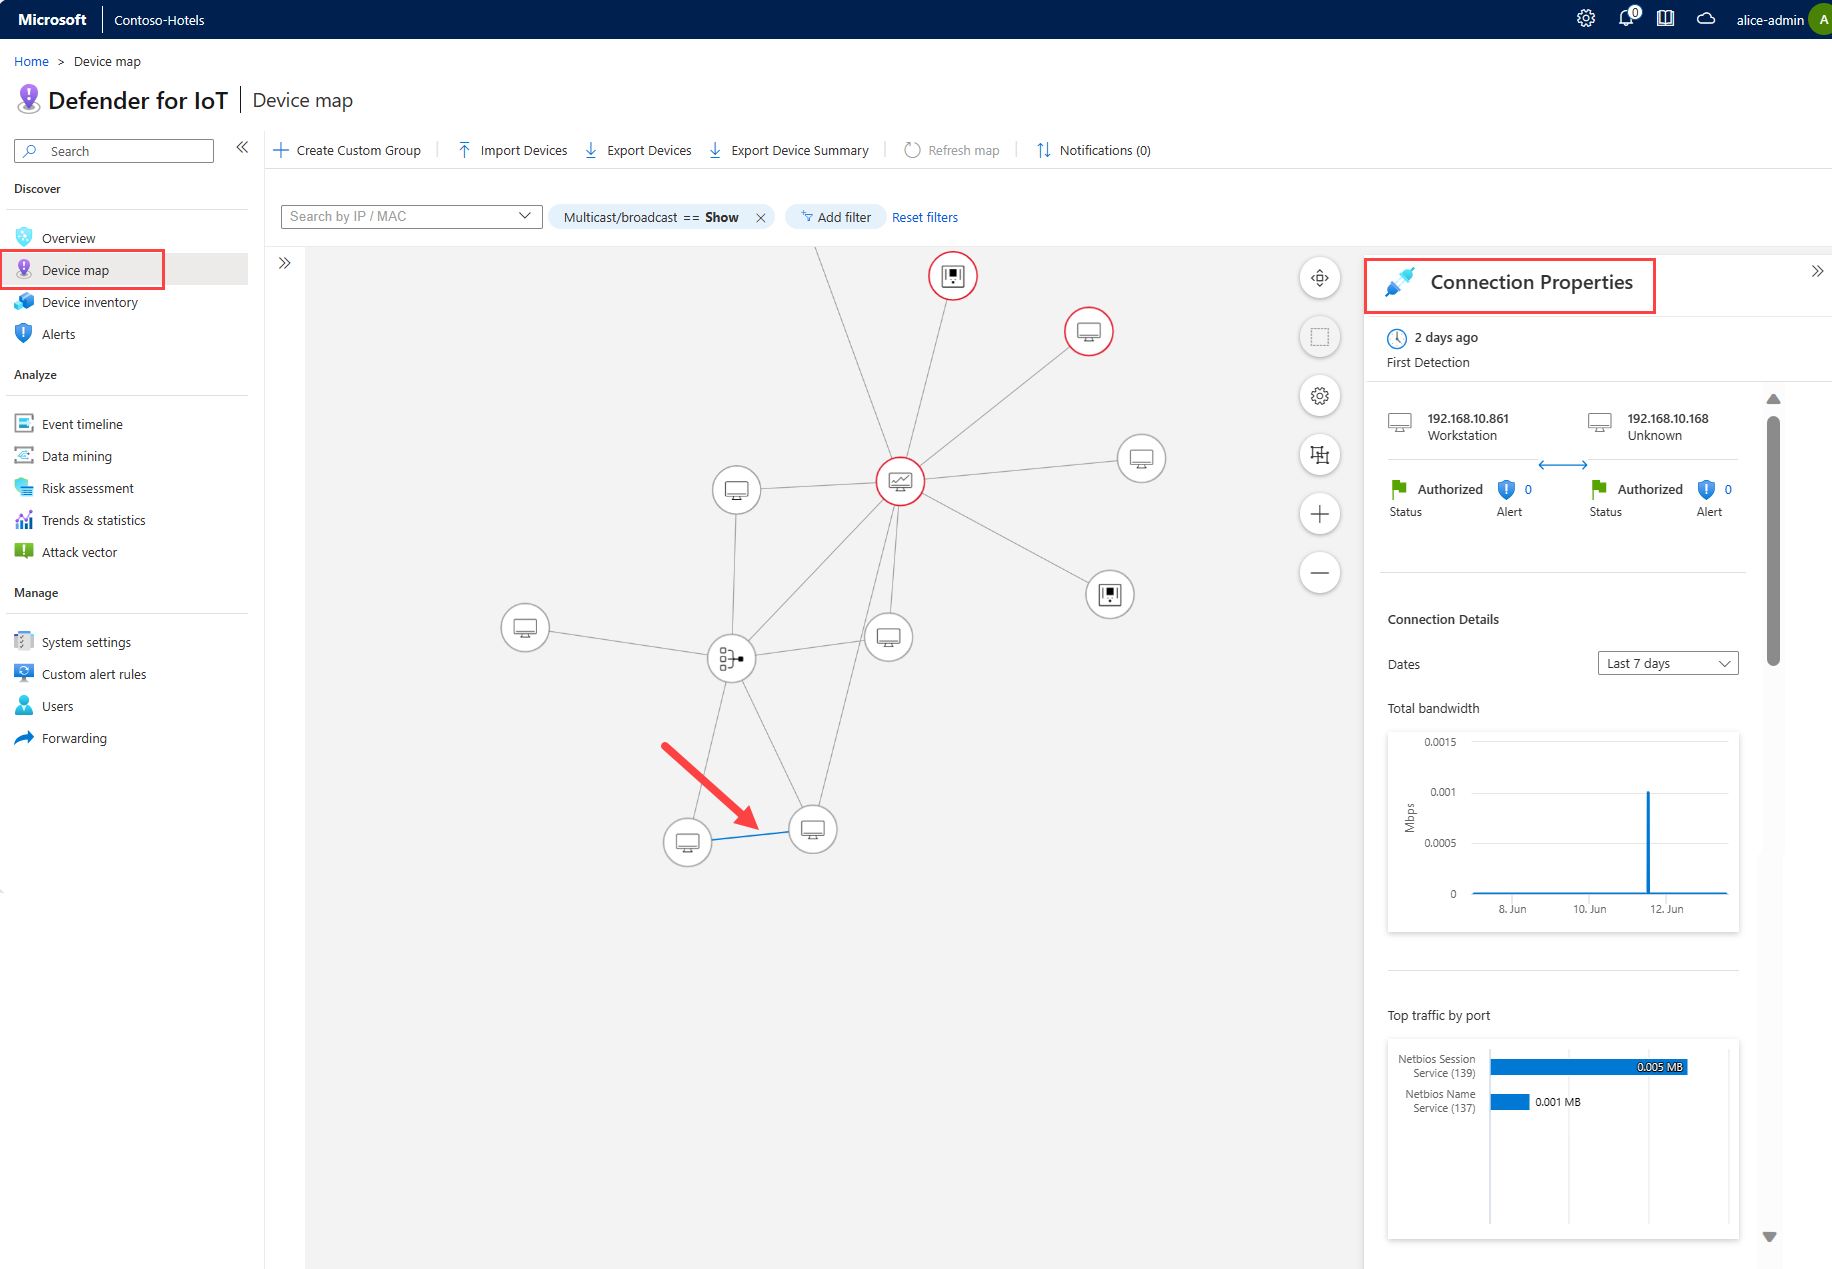
In the Connection Properties pane, you can view traffic details between the two devices, such as:
- How long ago the connection was first detected.
- The IP address of each device.
- The status of each device.
- The number of alerts for each device.
- A chart for total bandwidth.
- A chart for top traffic by port.

Create a custom device group
In addition to OT sensor's built-in device groups, create new custom groups as needed to use when highlighting or filtering devices on the map.
Either select + Create Custom Group in the toolbar, or right-click a device in the map and then select Add to custom group.
In the Add custom group pane:
- In the Name field, enter a meaningful name for your group, with up to 30 characters.
- From the Copy from groups menu, select any groups you want to copy devices from.
- From the Devices menu, select any extra devices to add to your group.
Import / export device data
Use one of the following options to import and export device data:
- Import Devices. Select to import devices from a pre-configured .CSV file.
- Export Devices. Select to export all currently displayed devices, with full details, to a .CSV file.
- Export Device Summary. Select to export a high level summary of all currently displayed devices to a .CSV file.
Edit devices
Sign into an OT sensor and select Device map.
Right-click a device to open the device options menu, and then select any of the following options:
Name Description Edit properties Opens the edit pane where you can edit device properties, such as authorization, name, description, OS platform, device type, Purdue level and if it is a scanner or programming device. View properties Opens the device's details page. Authorize/Unauthorize Changes the device's authorization status. Mark as Important / Non-Important Changes the device's importance status, highlighting business critical servers on the map with a star and elsewhere, including OT sensor reports and the Azure device inventory. Show Alerts / Show Events Opens the Alerts or Event Timeline tab on the device's details page. Activity Report Generates an activity report for the device for the selected timespan. Simulate Attack Vectors Generates an attack vector simulation for the selected device. Add to custom group Creates a new custom group with the selected device. Delete Deletes the device from the inventory.
Merge devices
You may want to merge devices if the OT sensor detected multiple network entities associated with a unique device, such as a PLC with four network cards, or a single laptop with both WiFi and a physical network card.
You can only merge authorized devices.
Important
You can't undo a device merge. If you mistakenly merged two devices, delete the devices and then wait for the sensor to rediscover both.
To merge multiple devices:
Sign into your OT sensor and select Device map.
Select the authorized devices you want to merge by using the SHIFT key to select more than one device, and then right-click and select Merge.
At the prompt, select Confirm to confirm that you want to merge the devices.
The devices are merged, and a confirmation message appears at the top right. Merge events are listed in the OT sensor's event timeline.
Manage device notifications
As opposed to alerts, which provide details about changes in your traffic that might present a threat to your network, device notifications on an OT sensor device map provide details about network activity that might require your attention, but aren't threats.
For example, you might receive a notification about an inactive device that needs to be reconnected, or removed if it's no longer part of the network.
To view and handle device notifications:
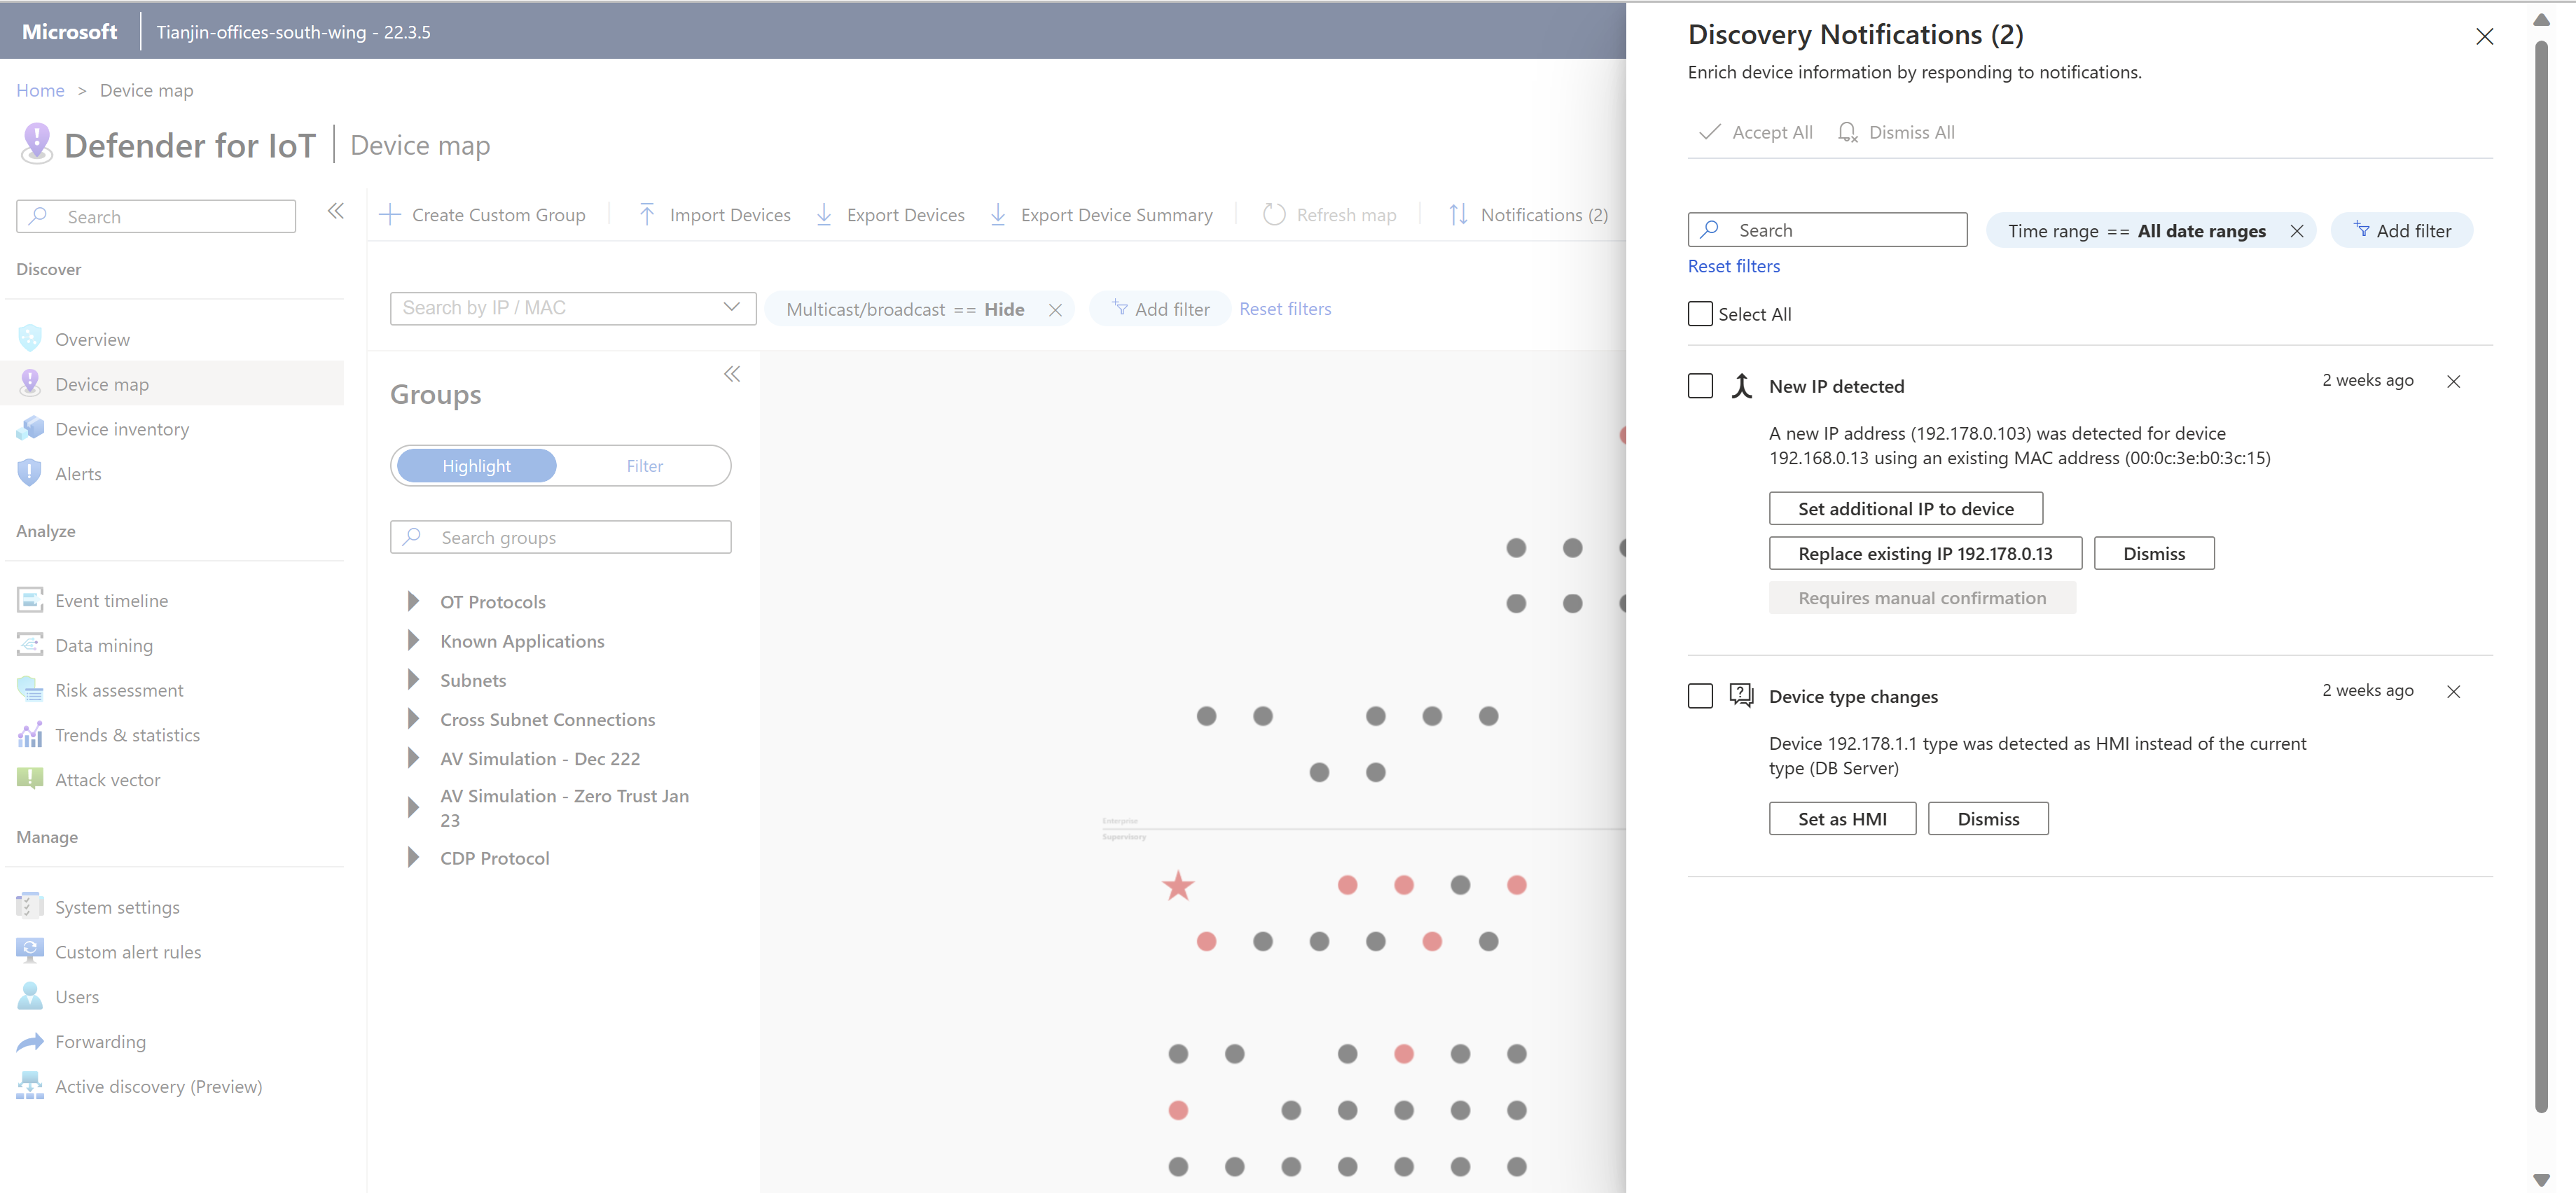
Sign into the OT sensor and select Device map > Notifications.
In the Discovery Notifications pane on the right, filter notifications as needed by time range, device, subnet, or operating systems.
For example:
Each notification may have different mitigation options. Do one of the following:
- Handle one notification at a time, selecting a specific mitigation action, or selecting Dismiss to close the notification with no activity.
- Select Select All to show which notifications can be handled together. Clear selections for specific notifications, and then select Accept All or Dismiss All to handle any remaining selected notifications together.

Note
Selected notifications are automatically resolved if they aren't dismissed or otherwise handled within 14 days. For more information, see the action indicated in the Auto-resolve column in the table below.
Handling multiple notifications together
You may have situations where you'd want to handle multiple notifications together, such as:
IT upgraded the OS across multiple network servers and you want to learn all of the new server versions.
A group of devices is no longer active, and you want to instruct the OT sensor to remove the devices from the OT sensor.
When you handle multiple notifications together, you may still have remaining notifications that need to be handled manually, such as for new IP addresses or no subnets detected.
Device notification responses
The following table lists available responses for each notification, and when we recommend using each one:
| Type | Description | Available responses | Auto-resolve |
|---|---|---|---|
| New IP detected | A new IP address is associated with the device. This may occur in the following scenarios: - A new or additional IP address was associated with a device already detected, with an existing MAC address. - A new IP address was detected for a device that's using a NetBIOS name. - An IP address was detected as the management interface for a device associated with a MAC address. - A new IP address was detected for a device that's using a virtual IP address. |
- Set Additional IP to Device: Merge the devices - Replace Existing IP: Replaces any existing IP address with the new address - Dismiss: Remove the notification. |
Dismiss |
| No subnets configured | No subnets are currently configured in your network. We recommend configuring subnets for the ability to differentiate between OT and IT devices on the map. |
- Open Subnet Configuration and configure subnets. - Dismiss: Remove the notification. |
Dismiss |
| Operating system changes | One or more new operating systems have been associated with the device. | - Select the name of the new OS that you want to associate with the device. - Dismiss: Remove the notification. |
Set with new operating system only if not already configured manually. If the operating system has already been configured: Dismiss. |
| New subnets | New subnets were discovered. | - Learn: Automatically add the subnet. - Open Subnet Configuration: Add all missing subnet information. - Dismiss: Remove the notification. |
Dismiss |
View a device map for a specific zone
If you're working with an on-premises management console with sites and zones configured, device maps are also available for each zone.
On the on-premises management console, zone maps show all network elements related to a selected zone, including OT sensors, detected devices, and more.
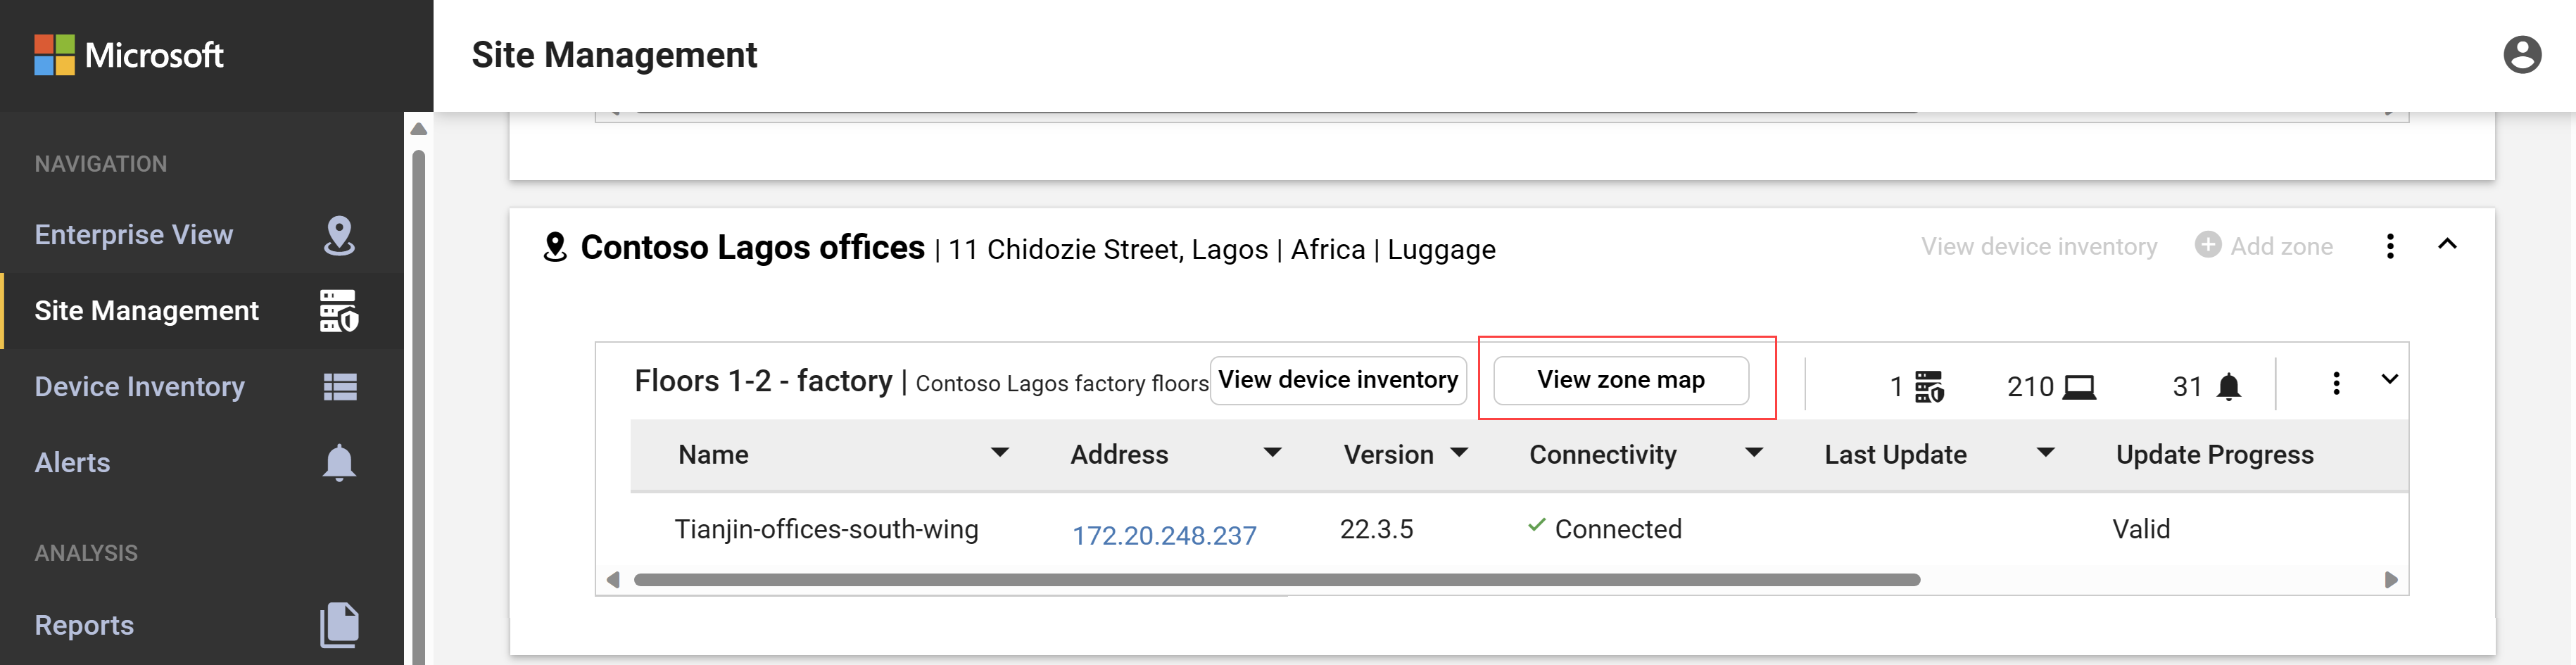
To view a zone map:
Sign into an on-premises management console and select Site Management > View Zone Map for the zone you want to view. For example:
Use any of the following map tools to change your map display:
Name Description Save current arrangement

Saves any changes you've made in the map display. Hide multicast/broadcast addresses 
Selected by default. Select to show multicast and broadcast devices on the map. Present Purdue lines 
Selected by default. Select to hide Purdue lines on the map. Relayout

Select to reorganize the layout by Purdue lines or by zone. Scale to fit screen

Zooms in or out on the map so that the entire map fits on the screen. Search by IP / MAC Select a specific IP or MAC address to highlight the device on the map. Change to a different zone map 
Select to open the Change Zone Map dialog, where you can select a different zone map to view. Zoom  /
/ 
Zoom in on the map to view the connections between each device, either using the mouse or the +/- buttons on the right of the map. Zoom in to view more details per devices, such as to view the number of devices grouped in a subnet, or to expand a subnet.
Right-click a device and select View properties to open a Device Properties dialog, with more details about the device.
Right-click a device shown in red and select View alerts to jump to the Alerts page, with alerts filtered only for the selected device.

Built-in device map groups
The following table lists the device groups available out-of-the-box on the OT sensor Device map page. Create extra, custom groups as needed for your organization.
| Group name | Description |
|---|---|
| Attack vector simulations | Vulnerable devices detected in attack vector reports, where the Show in Device Map option is toggled on. |
| Authorization | Devices that were either discovered during an initial learning period or were later manually marked as authorized devices. |
| Cross subnet connections | Devices that communicate from one subnet to another subnet. |
| Device inventory filters | Any devices based on a filter created in the OT sensor's Device inventory page. |
| Known applications | Devices that use reserved ports, such as TCP. |
| Last activity | Devices grouped by the time frame they were last active, for example: One hour, six hours, one day, or seven days. |
| Non-standard ports | Devices that use non-standard ports or ports that haven't been assigned an alias. |
| Not In Active Directory | All non-PLC devices that aren't communicating with the Active Directory. |
| OT protocols | Devices that handle known OT traffic. |
| Polling intervals | Devices grouped by polling intervals. The polling intervals are generated automatically according to cyclic channels or periods. For example, 15.0 seconds, 3.0 seconds, 1.5 seconds, or any other interval. Reviewing this information helps you learn if systems are polling too quickly or slowly. |
| Programming | Engineering stations, and programming machines. |
| Subnets | Devices that belong to a specific subnet. |
| VLAN | Devices associated with a specific VLAN ID. |
Next steps
For more information, see Investigate sensor detections in a Device Inventory.
Feedback
Coming soon: Throughout 2024 we will be phasing out GitHub Issues as the feedback mechanism for content and replacing it with a new feedback system. For more information see: https://aka.ms/ContentUserFeedback.
Submit and view feedback for