Install OT monitoring software on OT sensors
This article is one in a series of articles describing the deployment path for OT monitoring with Microsoft Defender for IoT, and describes how to install Defender for IoT software on OT sensors and configure initial setup settings.

Use the procedures in this article when installing Microsoft Defender for IoT software on your own appliances. You might be reinstalling software on a preconfigured appliance, or you may be installing software on your own appliance. If you're using a new preconfigured appliance, skip this step and continue directly with configuring and activating your sensor instead.
Caution
Only documented configuration parameters on the OT network sensor and on-premises management console are supported for customer configuration. Do not change any undocumented configuration parameters or system properties, as changes may cause unexpected behavior and system failures.
Removing packages from your sensor without Microsoft approval can cause unexpected results. All packages installed on the sensor are required for correct sensor functionality.
Prerequisites
Before installing, configuring, and activating your OT sensor, make sure that you have:
A plan for your OT site deployment with Defender for IoT, including the appliance you're using for your OT sensor.
Access to the Azure portal as a Security Reader, Security Admin, Contributor, or Owner user.
Performed extra procedures per appliance type. Each appliance type also comes with its own set of instructions that are required before installing Defender for IoT software.
Make sure that you've completed any specific procedures required for your appliance before installing Defender for IoT software. If your appliance has a RAID storage array, make sure to configure it before you continue installation.
For more information, see:
Access to the physical or virtual appliance where you're installing your sensor. For more information, see Which appliances do I need?
This step is performed by your deployment teams.
Note
There is no need to pre-install an operating system on the VM. The sensor installation includes the operating system image.
Configure network adapters for a VM deployment
Before deploying an OT sensor on a virtual appliance, configure at least two network adapters on your VM: one to connect to the Azure portal, and another to connect to traffic mirroring ports.
On your virtual machine:
Open your VM settings for editing.
Together with the other hardware defined for your VM, such as memory, CPUs, and hard disk, add the following network adapters:
- Network adapter 1, to connect to the Azure portal for cloud management.
- Network adapter 2, to connect to a traffic mirroring port that's configured to allow promiscuous mode traffic. If you're connecting your sensor to multiple traffic mirroring ports, make sure there's a network adapter configured for each port.
For more information, see:
- Your virtual machine software documentation
- OT network sensor VM (VMware ESXi)
- OT network sensor VM (Microsoft Hyper-V)
- Networking requirements
Note
If you're working with an air-gapped sensor and are deploying an on-premises management console, configure Network adapter 1 to connect to the on-premises management console UI instead of the Azure portal.
Download software files from the Azure portal
Download the OT sensor software from Defender for IoT in the Azure portal.
In Defender for IoT on the Azure portal, select Getting started > Sensor, and then select the software version you want to download.
Important
If you're updating software from a previous version, use the options from the Sites and sensors > Sensor update menu. For more information, see Update Defender for IoT OT monitoring software.
Install Defender or IoT software on OT sensors
This procedure describes how to install the Defender for IoT software you'd downloaded from the Azure portal.
Tip
While you can run this procedure and watch the installation from a deployment workstation, after you boot your sensor machine from the physical media or virtual mount, the installation can also run automatically on its own.
If you choose to do this without a keyboard or screen, note the default IP address listed at the end of this procedure. Use the default IP address to access the sensor from a browser and continue the deployment process from there.
To install your software:
Mount the downloaded ISO file onto your hardware appliance or VM using one of the following options:
Physical media – burn the ISO file to your external storage, and then boot from the media.
- DVDs: First burn the software to the DVD as an image.
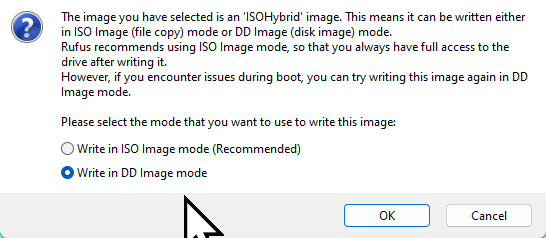
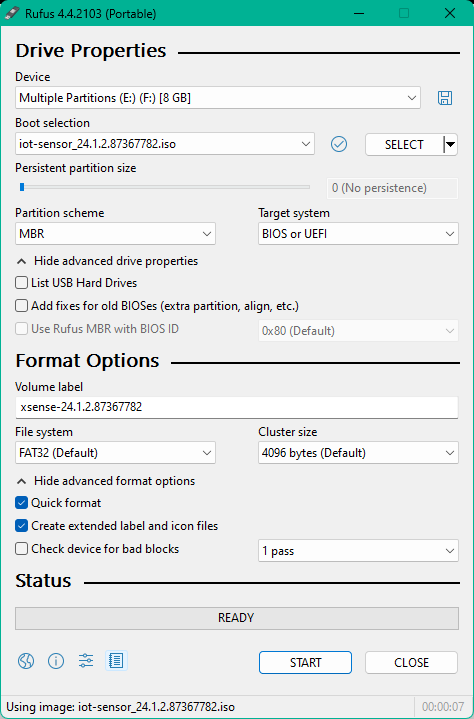
- USB drive: First make sure that you’ve created a bootable USB drive with software such as Rufus, and then save the software to the USB drive. USB drives must have USB version 3.0 or later.
- Select the DD Image mode setting when creating your image, for example:
Your physical media must have a minimum of 4-GB storage.
Virtual mount – use iLO for HPE appliances, or iDRAC for Dell appliances to boot the ISO file.
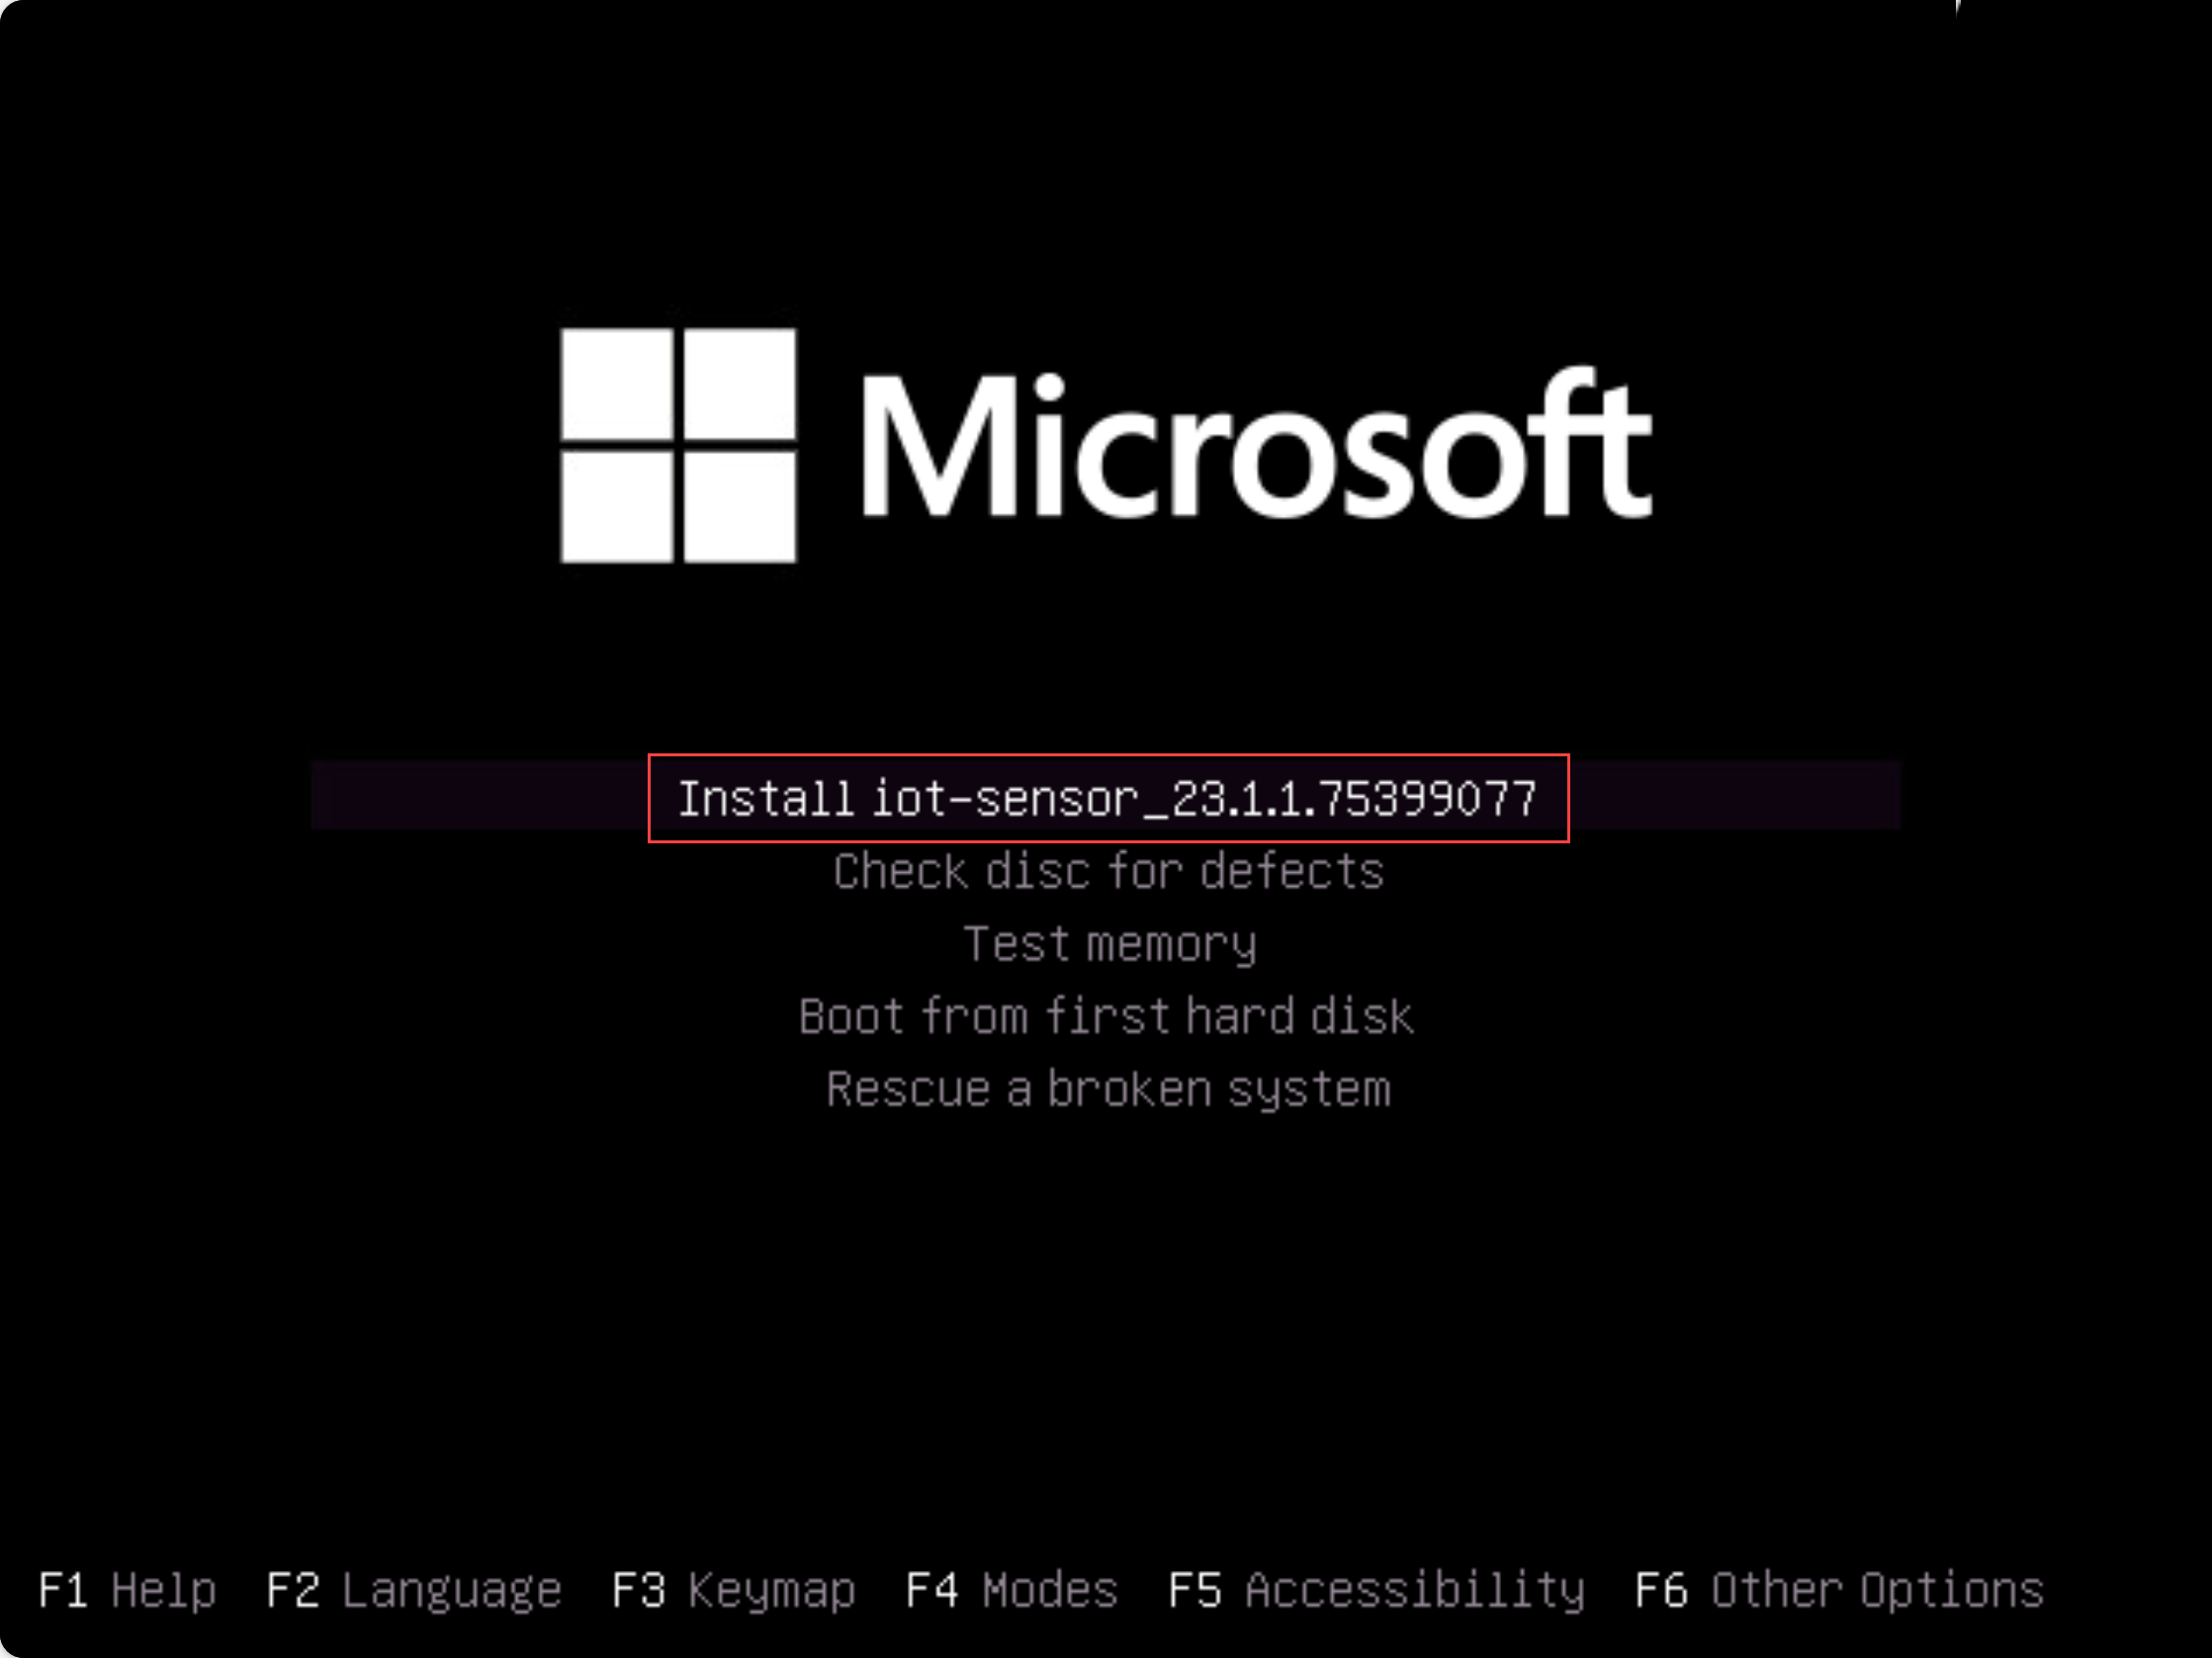
When the installation boots, you're prompted to start the installation process. Either select the Install iot-sensor-
<version number>item to continue, or leave the wizard to make the selection automatically on its own.The wizard automatically selects to install the software after 30 seconds of waiting. For example:
Note
If you're using a legacy BIOS version, you're prompted to select a language and the installation options are presented at the top left instead of in the center. When prompted, select
Englishand then the Install iot-sensor-<version number>option to continue.The installation begins, giving you updated status messages as it goes. The entire installation process takes up to 20-30 minutes, and may vary depending on the type of media you're using.
When the installation is complete, you're shown the following a set of default networking details. While the default IP, subnet, and gateway addresses are identical with each installation, the UID is unique for each appliance. For example:
IP: 192.168.0.101,
SUBNET: 255.255.255.0,
GATEWAY: 192.168.0.1,
UID: 91F14D56-C1E4-966F-726F-006A527C61D
Use the default IP address provided to access your sensor for initial setup and activation.
Next steps
For more information, see Troubleshoot the sensor.
Feedback
Coming soon: Throughout 2024 we will be phasing out GitHub Issues as the feedback mechanism for content and replacing it with a new feedback system. For more information see: https://aka.ms/ContentUserFeedback.
Submit and view feedback for