Note
Access to this page requires authorization. You can try signing in or changing directories.
Access to this page requires authorization. You can try changing directories.
This article is one in a series of articles describing the deployment path for OT monitoring with Microsoft Defender for IoT.

This article describes how to use Promiscuous mode in a ESXi vSwitch environment as a workaround for configuring traffic mirroring, similar to a SPAN port. A SPAN port on your switch mirrors local traffic from interfaces on the switch to a different interface on the same switch.
For more information, see Traffic mirroring with virtual switches.
Prerequisites
Before you start, make sure that you understand your plan for network monitoring with Defender for IoT, and the SPAN ports you want to configure.
For more information, see Traffic mirroring methods for OT monitoring.
Configure a monitoring interface using Promiscuous mode
To configure a monitoring interface with Promiscuous mode on an ESXi v-Switch:
Open the vSwitch properties page and select Add standard virtual switch.
Enter SPAN Network as the network label.
In the MTU field, enter 4096.
Select Security, and verify that the Promiscuous Mode policy is set to Accept mode.
Select Add to close the vSwitch properties.
Highlight the vSwitch you have just created, and select Add uplink.
Select the physical NIC you will use for the SPAN traffic, change the MTU to 4096, then select Save.
Open the Port Group properties page and select Add Port Group.
Enter SPAN Port Group as the name, enter 4095 as the VLAN ID, and select SPAN Network in the vSwitch drop down, then select Add.
Open the OT Sensor VM properties.
For Network Adapter 2, select the SPAN network.
Select OK.
Connect to the sensor, and verify that mirroring works.
Validate traffic mirroring
After configuring traffic mirroring, make an attempt to receive a sample of recorded traffic (PCAP file) from the switch SPAN or mirror port.
A sample PCAP file will help you:
- Validate the switch configuration
- Confirm that the traffic going through your switch is relevant for monitoring
- Identify the bandwidth and an estimated number of devices detected by the switch
Use a network protocol analyzer application, such as Wireshark, to record a sample PCAP file for a few minutes. For example, connect a laptop to a port where you've configured traffic monitoring.
Check that Unicast packets are present in the recording traffic. Unicast traffic is traffic sent from address to another.
If most of the traffic is ARP messages, your traffic mirroring configuration isn't correct.
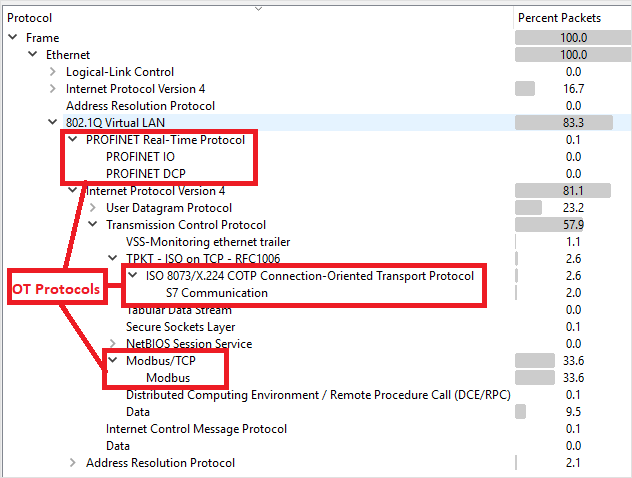
Verify that your OT protocols are present in the analyzed traffic.
For example: