Note
Access to this page requires authorization. You can try signing in or changing directories.
Access to this page requires authorization. You can try changing directories.
Azure DevOps Services | Azure DevOps Server 2022 - Azure DevOps Server 2019
Burndown and burnup charts support project management to visually track work completed over time.
- Burndown charts begin with the total amount of planned work and then as work is completed graphs the remaining work. With the progression of time, the amount of to-do work decreases.
- Burnup charts track work as it is completed over time. They're useful to show the rate at which work is getting completed.
Sprint burndown charts track planned work for a team and a selected sprint, so teams can review how efficiently they plan and execute sprint over sprint.
Burndown charts generally show a downward trend. But, if teams add work through a sprint or release period, then the chart shows upward trends. These charts help teams monitor what they planned to do versus what they actually do. Burnup charts, on the other hand, should always show an upward trend as work is completed over time.
The following configurable charts and widgets are available for tracking burndown or burnup.
- Burndown/burnup widget (Analytics)
- Sprint burndown built-in report (Analytics)
- Sprint burndown widget (Analytics)
- Sprint burndown widget (Legacy) (Work item store)
Important
- Deleting Area Path values or reconfiguring Iteration Path values causes irreversible data loss in the following charts:
- Burndown and burnup widget charts
- Sprint burndown charts
- Velocity charts for teams with changed area paths
- Historical trend charts that reference the Area Path and Iteration Path values as defined at the time for each work item
- When you delete these paths, you can't retrieve their historical data.
- You can delete area and iteration paths only when they're no longer used by any work items.
Supported configuration options
The following table summarizes the configuration options supported by the various burndown chart options. Sprint burndown charts are always focused on a single team, whereas a Burndown/Burnup widget can track work for several teams. All charts support tracking by work item count or a sum of Story Points, Effort, Remaining Work or other custom (integer or decimal) field.
| Configuration | Sprint burndown report | Sprint burndown widget | Burndown/Burnup widget |
|---|---|---|---|
| Team(s) | Single team | Single team | One or more teams |
| Backlog | Product backlog, Task backlog |
Product backlog, Portfolio backlog, Any work item type |
Product backlog Portfolio backlog work item type |
| Work item field filters | None | None | Supported |
| Burndown focus | Count or Sum | Count or Sum | Count or Sum |
| Time period | Single sprint | Single sprint | Configurable |
For details on viewing and configuring charts, see Configure and monitor sprint burndown or Configure a burndown or burnup widget.
General guidance
Depending on the teams, work item types, and time period you want to monitor, choose the chart option according to the following guidance.
| Monitor | Chart option |
|---|---|
| Sprint burndown for a team | Sprint burndown chart |
| Sprint burndown for a specific work item type or a portfolio backlog | Sprint burndown widget |
| Sprint burndown for several teams | Burndown widget |
| Release burndown/burnup for one or more teams or teams in different projects | Burndown/Burnup widget |
| Burnup or burndown for any type of work item and time period | Burndown/Burnup widget |
| Project and target completion date | Burndown/Burnup widget |
Scope management
When you estimate remaining work of tasks for each backlog item, teams better understand what they can accomplish within a sprint. Because the sprint tasks define the overall sprint scope, defining the remaining work leads to a well-defined sprint scope. Any nontasks in the sprint should be considered out of scope for the sprint.
As the team makes progress, divergences from the ideal trend line help the team monitor divergences from scope.
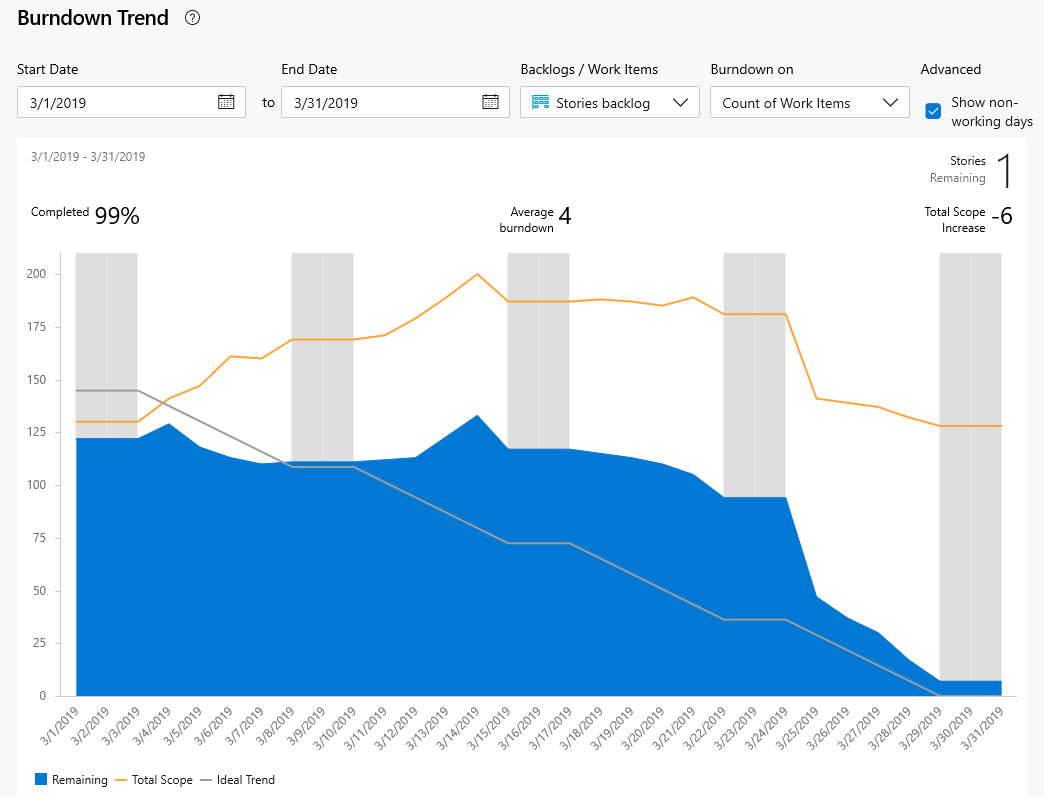
The Show non-working days shades those days set through the team's Working days and Team days off settings.
Increases instead of decreases within the blue graph might indicate:
- Poor estimates made to tasks
- Discovery of new work not accounted for in sprint planning
- Scope creep, other work not agreed to by the team.
Whatever the cause, teams should come together quickly to determine how to remedy the increased workload. Solutions might include reassigning tasks or recruiting more resources. The team should move all nonessential sprint work to the backlog and consider it during the next sprint planning meeting.
Mitigate risk through daily inspection
Your burn-down chart shows you if your project is on schedule. A daily check can mitigate risks and provide early warning of potential schedule or cost overruns, two metrics associated with traditional project management.
For example, when the actual remaining work (blue area) goes flat for a while, or remains high above the ideal trend line, the team is at risk of not meeting their sprint commitments.
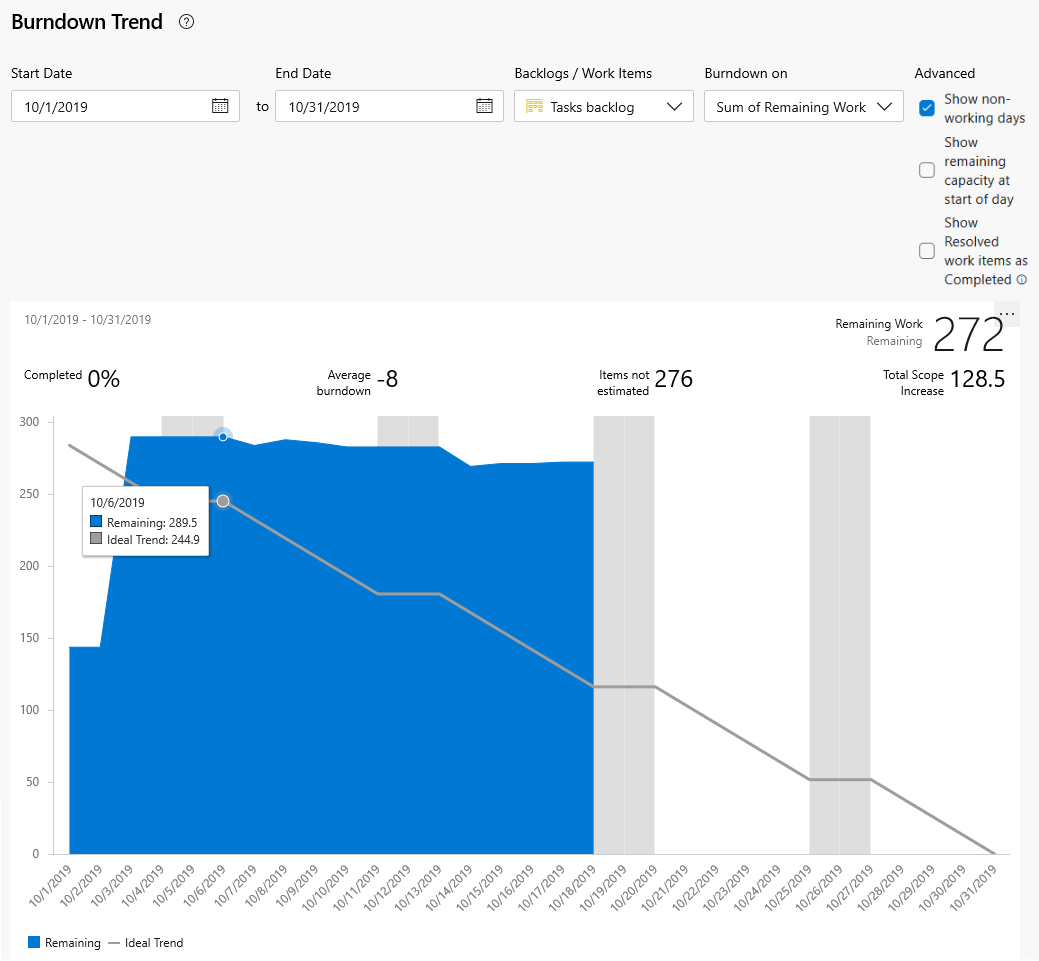
Teams should meet immediately to course correct and either reassign work, recruit more resources, or reset expectations.
Next steps
Related articles
- View and configure velocity
- Implement Scrum practices for your team in Azure Boards
- Query by date or current iteration, List work items moved out of a sprint
- Query by date or current iteration, List work items added to a sprint after the start date
- Manage priorities and gain visibility across teams
- Understand the Scrum Burndown Chart