Note
Access to this page requires authorization. You can try signing in or changing directories.
Access to this page requires authorization. You can try changing directories.
Azure DevOps Services | Azure DevOps Server 2022 - Azure DevOps Server 2019
You can create a custom Analytics view to define the filtered set of data and other criteria to support your Power BI reporting needs. A custom view provides you with greater flexibility over filter criteria and the fields that get loaded into a Power BI report.
Important
Analytics views only support Azure Boards data (work items). Analytics views don't support other data types, such as pipelines. Views provide a flat list of work items and don't support work item hierarchies. At this point, there are no plans to update the connector to support other types of data. For information on other approaches, see About Power BI integration.
You can create custom views in the web portal for Azure DevOps. Then load the view using the Power BI Data Connector. Like work item queries, you can create views only for your use, or share them with others on your team.
Note
If Boards is disabled, then Analytics views is also disabled. All widgets associated with work item tracking are also disabled in the widget catalog. To re-enable a service, see Turn on or off an Azure DevOps service.
Prerequisites
| Category | Requirements |
|---|---|
| Access levels | - Project member. - At least Basic access. |
| Permissions | By default, project members have permission to query Analytics and create views. For more information about other prerequisites regarding service and feature enablement and general data tracking activities, see Permissions and prerequisites to access Analytics. |
Open Analytics to access views
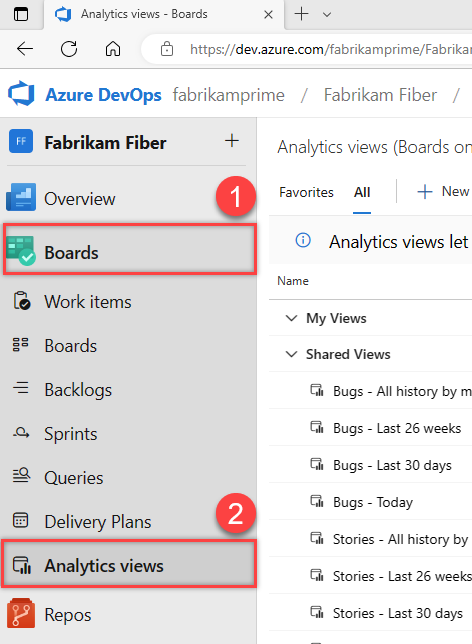
From your web portal, select Boards > Analytics views.
If you don't see Analytics views, check that you have permissions for viewing Analytics. See Permissions and prerequisites to access Analytics.
Browse your views
From the All page as shown in the following image, you can access all Analytics views defined for the project. My Views are views that only you can use or edit. Shared Views are views that are shared across the project. Anyone on your team can connect and use shared views in Power BI.

Note
The labels for the default Analytics views differ depending on the process that was chosen for your team project: Basic, Agile, Scrum, or CMMI. The functionality available to you remains the same unless explicitly mentioned.
To make a view into a favorite, hover over the view and choose the star icon: ![]() . Your favorite views appear on the Favorites page.
. Your favorite views appear on the Favorites page.
Create a custom view
To open a dialog to create a custom view, select ![]() New view. Complete the forms provided in each tab to fully define the filter criteria for shaping the data you want to view in Power BI.
New view. Complete the forms provided in each tab to fully define the filter criteria for shaping the data you want to view in Power BI.
To create a custom view, do the following steps:
- Name the view and choose a sharing option
- Specify work item filters
- Select the view's fields
- Choose the amount of historical data contained within the view
- Verify and save the view
Note
The board fields aren't available to add as filters or selection to view at this time. These fields include Board Column, Board Column Done, and Board Lane. A feature request is defined to add them, Analytics view - Add Board Column to list of available Fields in Views.
1. Name the view and choose a sharing option
Enter a name for the view and provide a description. To allow others to view and use the Analytics view, choose the Shared option. With shared views, you can set permissions as to who can view, edit, and delete the view as described in Manage Analytics views.

2. Specify work item filters
Specify filters to reduce the number of results returned by your view. In the work items section, you can add different filters on work item fields to scope your data. For a description of each available field, see Metadata reference for Azure Boards Analytics.

Tip
Scope your data to generate reports that quickly refresh. For large datasets, refreshing nonfiltered views can fail. To narrow your results, add the right set of filters. The more filters you add, the faster the view loads and refreshes in Power BI.
Add Teams or Area Path filters
By default, a view includes all the teams defined in the current project. You can specifically select teams in the current project or add other projects defined in the organization to the filter.
Important
We recommend a limit of 500 projects per Analytics view. If you need more than 500 projects, you can create more Analytics views and distribute the projects between the views.
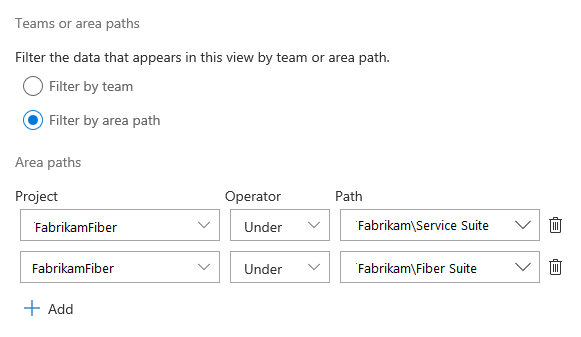
You can change the selected teams for the current project or add other projects to the filter. You can also change from filtering on teams to area paths. Here's a view filtered by two Fabrikam area paths.
Add filters for backlogs and work items types
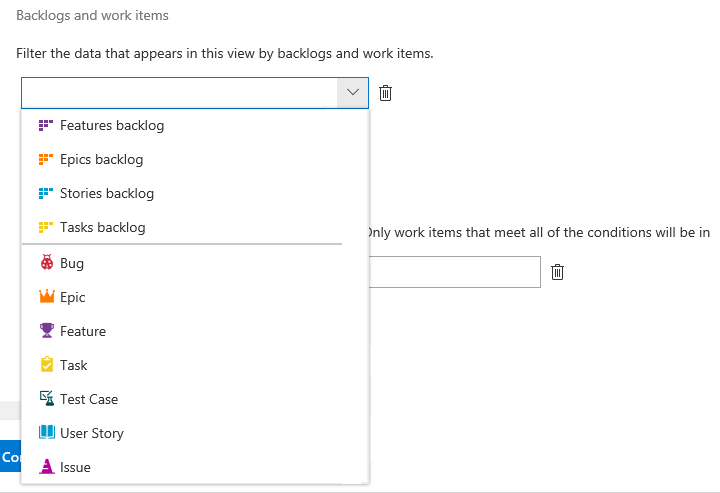
Scope the data to specific Work item types in your project. You can specify a backlog to filter by work item types associated with a specific backlog level or add individual specific work item types. Work items of the selected types are included in the view.
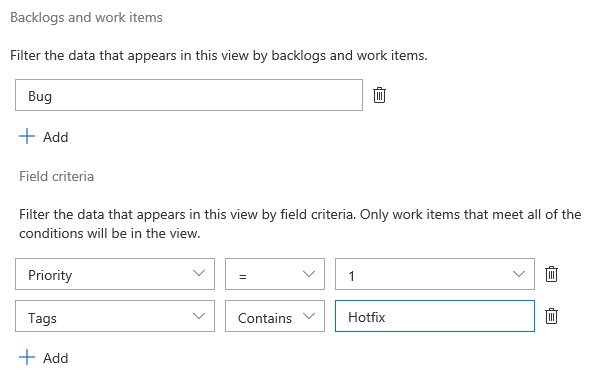
Add filters by field criteria
In addition to all previous filter criteria, you can add filters based on different work item fields. Specify these fields in the same way you do for fields you add to a work item query. As shown in the following example, you can filter to show only high Priority bugs with the specific "Hotfix" tag.
For details about working with tags, see Add work item tags to categorize and filter lists and boards.
Note
It's important to understand how filters apply to historical data. For more information, see Historical data representation in Analytics.
3. Select the fields that appear in the report
In the next tab, Fields, you can add and remove fields that you use in your report. Choose ![]() Add to add a field. To start with a fresh list, choose Remove All.
Add to add a field. To start with a fresh list, choose Remove All.

You can add any custom fields that you add through an inherited process.
Note
You can't add fields with a data type of Plain Text (long text) or HTML (rich-text). These fields aren't available from Analytics for the purposes of reporting.
4. Select trend data options
In the next tab, History, choose the options that determine how much history data is available from the view.
In this example, if you have 10 work items and choose a rolling period of 14 days with a weekly granularity, your view contains 30 rows. If you refresh on Saturday, then you have a row on the last two Saturdays for each work item and a row for the most recent data on Saturday.

History
For a snapshot of the current status, choose Current only. For trend charts, choose one of the other options as indicated.
| Option | Description |
|---|---|
| Current only | Choose this option when you want a snapshot of work item status. Generates a single row per work item matching the work item's latest values in the Analytics data store. |
| Rolling period | Choose this option and enter the number of days previous to the current day to include in the dataset. The sliding window changes each time you refresh your report. |
| Date range | Choose this option and select a specific start and end date to include in the dataset, or select to present to specify a rolling window with no fixed end date. When you select to present, the end date corresponds to the day the reports is refreshed. If you unselect it, the end date is always the date selected on the end date field. |
| All history | Choose this option to include the complete history for all work items you selected in your filter criteria. If you have a significant history, specify a Weekly or Monthly granularity. |
Exclude work items that were completed before the start date - Analytics stores all work item history, including any revisions for a closed work item. As a result, in an Analytics view, if you select a rolling period of 14 days, your view includes the current revision for all work items that were closed before this period.
To Exclude work items that were completed before a specific date, select the corresponding box under any of the options for history. It greatly reduces the amount of data loaded into Power BI and helps advanced calculations, like time in state. For the Rolling period and Date range, the date to exclude work items gets set by the start of the period. For Current only and All history, you need to provide that date. For example, the following image excludes all work times that were completed before August 24, 2024.

Granularity
You can choose to get a snapshot of every work item for each day, week, or month. Each row represents the item based on the most recent revision for the defined interval.
| Option | Description |
|---|---|
| Daily | Generates a row per work item showing the latest data for each day. |
| Weekly | Generates a row per work item showing the data per week taken on the day that represents the week. The value defaults to Saturday. |
| Monthly | Generates a row per work item showing the data for the last day of each month. |
Note
- Preview rows are a calculated value based on history and granularity and might not match with Power BI.
- It's important to understand how filters are applied to historical data. For more information, see Historical data representation in Analytics.
5. Verify and save the view
The last step verifies your view by running a test query against the view and validating the filter criteria. Verification time can vary according to the amount of data defined in your view. For example, a view that includes all work item types and specifies All history takes more time to verify than a view that includes only bugs and specifies a rolling period of 30 days.
Tip
Verifying your view is an important step. When verification ends successfully, your view is more likely to load correctly in Power BI. If verification takes too long, you can adjust the view. Add filters or narrow your history and verify your view again.
After your view successfully verifies, save it. You can then start using it in Power BI.
If a view fails to verify successfully, you get an error explaining the issue and pointing to a possible fix. Try changing the definitions and verify the view again. When the view verifies successfully, you get an estimate of the row count included in your view.

For example, if you try to filter by a field that is no longer defined for the project, you get an error. You can remove that field from the filters in the Work Items filters tab and verify again.
For more information about resolving errors, see Resolve errors associated with an Analytics view.
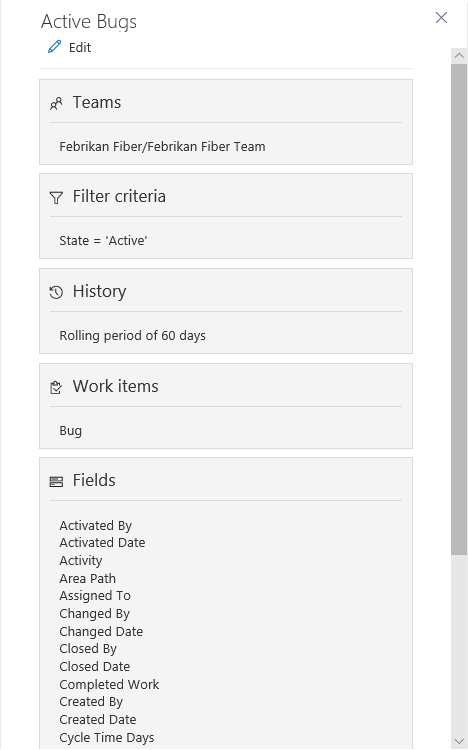
Review a view's filter criteria
In Analytics views, choose any view from the Favorites or All page to see a summary of the view's definitions and filters. Choose Edit to edit a view.