Sprint burndown sample reports
Azure DevOps Services | Azure DevOps Server 2022 - Azure DevOps Server 2019
Sprint burndown charts are useful to monitor how well a team is executing on their sprint plan. Several built-in charts and dashboard widgets support monitoring sprint burndown. See Configure and monitor sprint burndown.
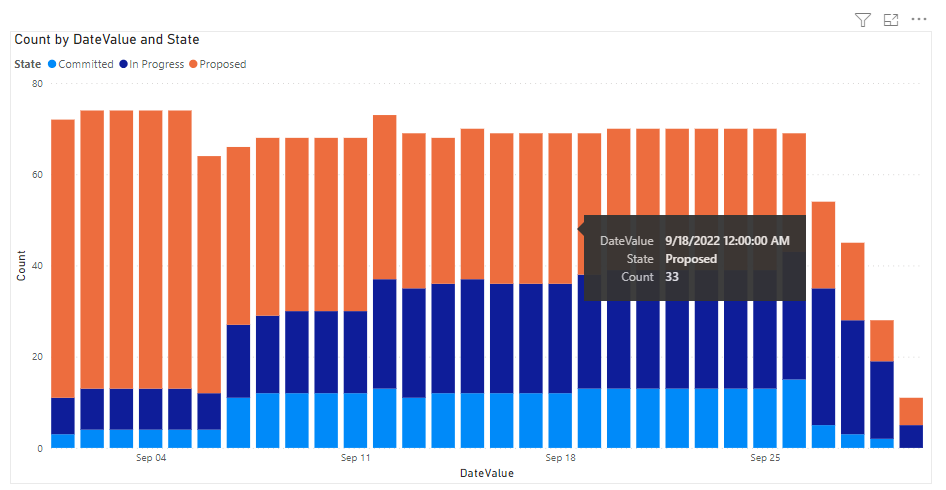
However, you can customize a sprint burndown chart using Analytics and Power BI with the queries provided in this article. The following example shows a burndown of User Stories and their States.
Important
- Deleting Area Paths or reconfiguring Iteration Paths causes irreversible data loss. For example, burndown and burnup widget charts, sprint burndown, and velocity charts for teams with changed Area Paths won't display accurate data. Historical trend charts reference the Area Path and Iteration Path as they were defined at the time for each work item. Once deleted, you can't retrieve historical data for these paths.
- You can only delete area and iteration paths that are no longer used by any work items.
For more information about burndown and burnup, and Burndown and burnup guidance.
Note
This article assumes you read Overview of Sample Reports using OData Queries and have a basic understanding of Power BI.
Prerequisites
- Access: Be a member of a project with at least Basic access.
- Permissions: By default, project members have permission to query Analytics and create views.
- For more information about other prerequisites regarding service and feature enablement and general data tracking activities, see Permissions and prerequisites to access Analytics.
Sample queries
Burndown charts require querying the WorkItemSnapshot entity set to get historical data.
Note
To determine available properties for filter or report purposes, see Metadata reference for Azure Boards. You can filter your queries or return properties using any of the Property values under an EntityType or NavigationPropertyBinding Path values available with an EntitySet. Each EntitySet corresponds to an EntityType. For more information about the data type of each value, review the metadata provided for the corresponding EntityType.
Burndown User Stories for an area path and the current iteration
Copy and paste the following Power BI query directly into the Get Data > Blank Query window. For more information, see Overview of sample reports using OData queries.
let
   Source = OData.Feed ("https://analytics.dev.azure.com/{organization}/{project}/_odata/v3.0-preview/WorkItemSnapshot? "
        &"$apply=filter( "
            &"WorkItemType eq 'User Story' "
            &"and startswith(Area/AreaPath,'{areapath}') "
            &"and StateCategory ne 'Completed' "
            &"and DateValue ge Iteration/StartDate "
            &"and DateValue le Iteration/EndDate "
            &"and Iteration/StartDate le now()  "
            &"and Iteration/EndDate ge now() "
        &") "
        &"/groupby( "
            &"(DateValue,State,WorkItemType,Priority,Area/AreaPath,Iteration/IterationPath), "
            &"aggregate($count as Count, StoryPoints with sum as TotalStoryPoints) "
        &") "
    ,null, [Implementation="2.0",OmitValues = ODataOmitValues.Nulls,ODataVersion = 4])
in
    Source
Substitution strings and query breakdown
Substitute the following strings with your values. Don't include brackets {} with your substitution. For example if your organization name is "Fabrikam", replace {organization} with Fabrikam, not {Fabrikam}.
{areapath}- Your Area Path. Example format:Project\Level1\Level2.
Query breakdown
The following table describes each part of the query.
Query part
Description
$apply=filter(
Start filter()
WorkItemType eq 'User Story'
Burndown on User Stories
and startswith(Area/AreaPath,'{areapath}')
Work items under a specific Area Path. Replacing with Area/AreaPath eq '{areapath}' returns items at a specific Area Path.
To filter by Team Name, use the filter statement Teams/any(x:x/TeamName eq '{teamname})'
and StateCategory ne 'Completed'
Filters out items that are completed. For more information on State Categories, see How workflow states and state categories are used in Backlogs and Boards.
and DateValue ge Iteration/StartDate
Begin trend at Iteration start.
and DateValue le Iteration/EndDate
End trend at Iteration end.
and Iteration/StartDate le now()
Select current Iteration.
and Iteration/EndDate ge now()
Select current Iteration
)
Close filter()
/groupby(
Start groupby()
(DateValue, State, WorkItemType, Priority, Area/AreaPath, Iteration/IterationPath),
Group by DateValue (used for trending), and any fields you want to report on
aggregate($count as Count, StoryPoints with sum as TotalStoryPoints)
Aggregate by count of user stories, and sum of Story Points
)
Close groupby()
Burndown User Stories for a team and the current iteration
This query is the same as the one used above, except it filters by Team Name rather than Area Path.
Copy and paste the following Power BI query directly into the Get Data > Blank Query window. For more information, see Overview of sample reports using OData queries.
let
   Source = OData.Feed ("https://analytics.dev.azure.com/{organization}/{project}/_odata/v3.0-preview/WorkItemSnapshot? "
        &"$apply=filter( "
            &"WorkItemType eq 'User Story' "
            &"and (Teams/any(x:x/TeamName eq '{teamname}) or Teams/any(x:x/TeamName eq '{teamname}) or Teams/any(x:x/TeamName eq '{teamname}) "
            &"and StateCategory ne 'Completed' "
            &"and DateValue ge Iteration/StartDate "
            &"and DateValue le Iteration/EndDate "
            &"and Iteration/StartDate le now()  "
            &"and Iteration/EndDate ge now() "
        &") "
        &"/groupby( "
            &"(DateValue,State,WorkItemType,Priority,Area/AreaPath,Iteration/IterationPath), "
            &"aggregate($count as Count, StoryPoints with sum as TotalStoryPoints) "
        &") "
    ,null, [Implementation="2.0",OmitValues = ODataOmitValues.Nulls,ODataVersion = 4])
in
    Source
Burndown User Stories for all sprints since the start of a year
You may want to view a burndown of all the sprints in a single report. These queries pull in sprint burndowns, and their by story points, for all sprints since the beginning of year 2022.
Copy and paste the following Power BI query directly into the Get Data > Blank Query window. For more information, see Overview of sample reports using OData queries.
let
   Source = OData.Feed ("https://analytics.dev.azure.com/{organization}/{project}/_odata/v3.0-preview/WorkItemSnapshot? "
        &"$apply=filter( "
            &"WorkItemType eq 'User Story' "
            &"and startswith(Area/AreaPath,'{areapath}') "
            &"and StateCategory ne 'Completed' "
            &"and DateValue ge Iteration/StartDate "
            &"and DateValue le Iteration/EndDate "
            &"and Iteration/StartDate ge 2022-01-01Z "
        &") "
        &"/groupby( "
            &"(DateValue,Iteration/EndDate,Area/AreaPath,Iteration/IterationPath,State,WorkItemType,Priority,AreaSK), "
            &"aggregate($count as Count, StoryPoints with sum as TotalStoryPoints) "
        &") "
    ,null, [Implementation="2.0",OmitValues = ODataOmitValues.Nulls,ODataVersion = 4])
in
    Source
Burndown Tasks and Remaining Work
Copy and paste the following Power BI query directly into the Get Data > Blank Query window. For more information, see Overview of sample reports using OData queries.
Doc-ready Power BI Query (anonomized)
let
   Source = OData.Feed ("https://analytics.dev.azure.com/{organization}/{project}/_odata/v3.0-preview/WorkItemSnapshot? "
        &"$apply=filter( "
            &"startswith(Area/AreaPath,'{project}') "
            &"and StateCategory ne 'Completed' "
            &"and DateValue ge Iteration/StartDate "
            &"and DateValue le Iteration/EndDate "
            &"and Iteration/StartDate le now()  "
            &"and Iteration/EndDate ge now() "
            &"and WorkItemType eq 'Task' "
        &") "
            &"/groupby( "
            &"(DateValue,State,WorkItemType,Activity,Priority,Area/AreaPath,Iteration/IterationPath,AreaSK), "
            &"aggregate($count as Count, RemainingWork with sum as TotalRemainingWork) "
        &") "
    ,null, [Implementation="2.0",OmitValues = ODataOmitValues.Nulls,ODataVersion = 4])
in
    Source
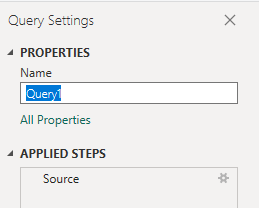
(Optional) Rename query
You can rename the default query label, Query1, to something more meaningful. Simply enter a new name from the Query Settings pane.
Expand columns in Power Query Editor
Prior to creating the report, you'll need to expand columns that return records containing several fields. In this instance, you'll want to expand the following records:
AreaIterationAssignedTo
To learn how to expand work items, see Transform Analytics data to generate Power BI reports.
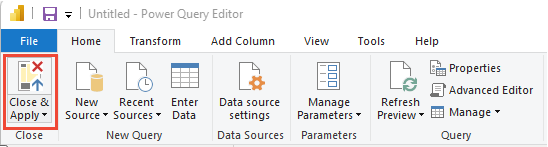
Close the query and apply your changes
Once you've completed all your data transformations, choose Close & Apply from the Home menu to save the query and return to the Report tab in Power BI.
Create the stacked column chart report
In Power BI, choose the Stacked column chart report under Visualizations.
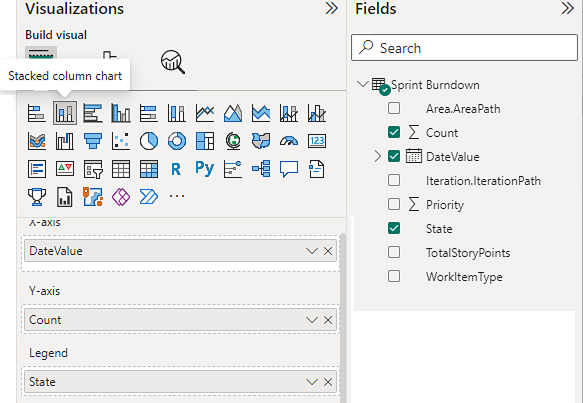
Add
DateValueto X-Axis, right-click and selectDateValue, rather thanDate HierarchyAdd
Countto Y-Axis.Add
Stateto Y-Axis.
The example report, which displays burndown on both Story Points and Count of Stories.